Thermohaline circulation The concept of meridional overturning Deep

 does")


-diagrams. The diagrams on the left show the distribution of temperature")


. That filled with subducted")
- Slides: 18
Thermohaline circulation ●The concept of meridional overturning ●Deep water formation and property Antarctic Bottom Water North Atlantic Deep Water Antarctic Intermediate Water ●Dynamical constraint: Stommel-Arons model
The Concept of Thermohaline Circulation The wind-driven circulation (the Ekman and Sverdrup movements) does not reach below the upper kilometre of the ocean. Water renewal below that depth is achieved by currents which are driven by density differences produced by temperature (thermal) and salinity (haline) effects. The associated circulation is therefore referred to as thermohaline circulation. Since these movements are probably weak, it is often impractical to use current meters to measure them directly; they are usually deduced from the distribution of water properties and the application of geostrophy.
Heating at low latitudes Surface heat at the equator and cooling at higher latitudes generate meridional density difference that drives a overturning cell The overturning circulation is weak because the heat is in the shallow mixed layer The salinity effect (e. g. , evaporation at subtropics and precipitation near the equator) enhances the tropical-subtropical thermal cell but counters the cooling in the higher latitudes with freshening The upper thermohaline cell is of minor importance
Cooling at high latitudes • Net heat loss from the oceans at high latitudes • Cooling of the surface water and increase in density • Sink and replace deeper water • Density can also be increased when ice freezes out, ejecting salt and thus increasing the weight of the remaining water • Thermohaline circulation of the ocean originates from sinking to mid-depth or even to the ocean bottom, followed by horizontal flow.
Interesting facts The vertical distribution of T & S in the central Atlantic is similar to the northsouth distribution of T & S at the surface. Almost all isopycnals come in contact with the atmosphere somewhere on the globe
Questions Does this imply that air-sea interaction at the surface affect the range of ocean water or even determine the ocean stratification? Are there “flows” along the isopycnals that transport these properties? The “flow” here could be intermittent and irregular The T & S patterns do not allow us to see the flow rates or mechanisms The process whereby ocean surface characteristics are transmitted to deeper layers is known as ventilation.
Water masses and water types • Water can be defined as a body of water with a common formation history • Water mass can be identified by plotting temperature against salinity in a T-S diagram • Points in the T-S diagram are called water types • Water sources definition are called source water types
How to track the water masses? temperature-salinity diagram Below the surface layer in permanent contact with the atmosphere, temperature and salinity are conservative properties, i. e. , they can only be changed by mixing and advection. All other properties of sea water such as oxygen, nutrients etc. are affected by biological and chemical processes and therefore non- conservative. Water masses can therefore be identified by their temperature-salinity (T-S) combinations.
Identify water masses from T-S Diagram
Examples of temperature-salinity (TS)-diagrams. The diagrams on the left show the distribution of temperature (red) and salinity (cyan) with depth; the diagrams on the right show the corresponding TS-diagrams. Top: layering of a warm and saline water mass found at 0 - 300 m depth above a cold and fresh water mass found at 300 - 600 m. The full lines show the situation before mixing, the broken lines after mixing. The TS-diagram shows the two water masses as TS points. Before mixing only the two points are seen in the TSdiagram. Mixing connects the two TS-points by a straight line. Bottom: layering of three water masses (intrusion of a low salinity water mass at 300 - 600 m depth). Again, the full lines show the situation before mixing, the broken lines after mixing. The TS - diagram shows two mixing lines; the erosion of the intermediate salinity minimum by mixing is seen by the departure of the broken curve from the original water mass point.
Mixing in the Ocean: Cabelling
Double diffusion: Salt Figure Warm, salty water overlying a cooler, fresher layer Individual salt fingers are a few millimeters across and up to 25 cm long Lateral diffusion occurs between the fingers and produces a uniform layer As a result, layers develop with sharply defined interfaces
Water Mass Formation The driving force for thermohaline circulation is water mass formation. Water masses with well-defined temperature and salinity characteristics are created by surface processes in specific locations; they then sink and mix slowly with other water masses as they move along. The two main processes of water mass formation are deep convection and subduction. Both are linked to the dynamics of the mixed layer at the surface of the ocean; so it is necessary to discuss thermohaline aspects of the upper ocean first.
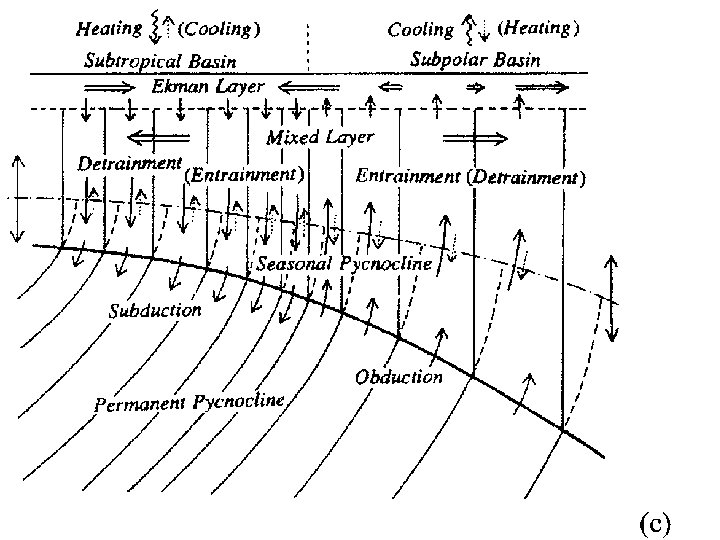
Subduction Water mass formation by subduction occurs mainly in the subtropics. Water from the bottom of the mixed layer is pumped downward through a convergence in the Ekman transport Water “sinks” slowly along surfaces of constant density. This “downward” advection into the ocean, along isopycnals and therefore without significant diapycnal mixing after leaving the surface, is call subduction The opposite of subduction is obduction, i. e. water from subsurface isopycnals enters the surface layer
Sketch of water mass formation by subduction First diagram: Convergence in the Ekman layer (surface mixed layer) forces water downward, where it moves along surfaces of constant density. The 27. 04 σt surface, given by the TS-combination 8°C and 34. 7 salinity, is identified. Second diagram: A TS- diagram along the surface through stations A ->D is identical to a TS-diagram taken vertically along depths A´ - D´.
Over the T-S range of thermocline, the vertical profile at 20 o. S are nearly identical with the T-S diagram of the surface temperature and salinity between 30 o. S and 45 o. S in late winter (August. October) but different during all other seasons
In each isopycnal layer, there can be three regions: 1). That filled with subducted water (ventilated region) 2). A western unventilated pool with streamlines connecting from the western boundary and back into the western boundary without entering the surface layer 3). An eastern quite (shadow) zone between the eastern most subducting streamline and the eastern boundary