Thermodynamic Diagrams and Severe Weather What is Severe


 • Remember: Area on a thermodynamic diagram is proportional")


 • CIN is NOT negative CAPE!!!!!! • CAPE integrates from the")


 BRN= CAPE 1/ 2 Uz 2 (where U is a")


: • right")


- Slides: 24
Thermodynamic Diagrams and Severe Weather
What is Severe Weather? Tornado Hail > or = 3/4 inch Wind > 50 knots
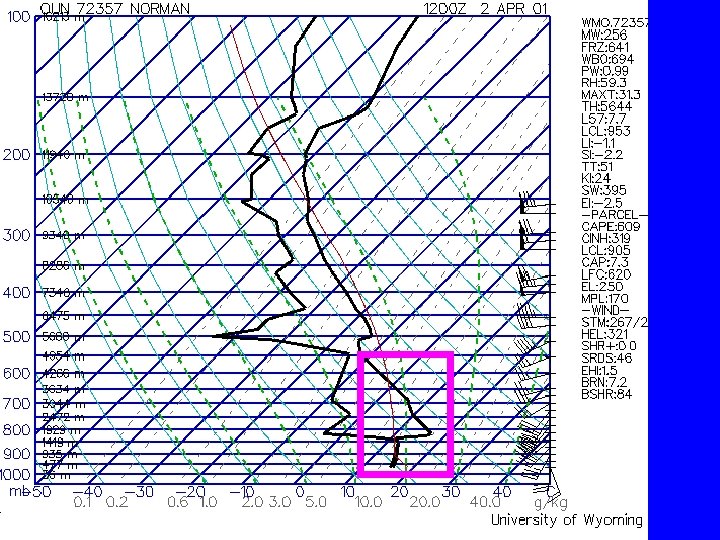
Convective Available Potential Energy (CAPE) • Remember: Area on a thermodynamic diagram is proportional to energy. • CAPE is also called buoyant energy. • CAPE on a thermodynamic diagram is the area between the parcel and the environment temperatures from the LFC to the EL • CAPE is a measure of instability
CAPE
CAPE
Maximum Updraft Speed • If we convert the potential energy of CAPE to a kinetic energy, we can get the maximum speed of any updraft that may develop.
Convective Inhibition (CIN) • CIN is NOT negative CAPE!!!!!! • CAPE integrates from the LFC to the EL, CIN integrates from the surface to the LFC • Is a measure of stability • Reported as an absolute value
CIN
Overcoming Convective Inhibition • A convective outbreak rarely occurs from surface heating alone! • Triggering Mechanisms for T-Storms – – – fronts dry lines sea-breeze fronts gust fronts from other thunderstorms atmospheric bouyancy waves mountains
Cap Strength • Very important for severe weather to develop • Too little or no cap: happy little cumulus everywhere • Too strong of a cap: nothing happens • Just the right amount of a cap: Severe Weather
• At the inversion* look at the temperature difference between the parcel and the environment.
Shear vs. CAPE • Need a balance between Shear and CAPE for supercell development • Without shear: single, ordinary, airmass thunderstorm which lasts 20 minutes • If shear is too strong: multicellular t-storms (gust front moves too fast)
CAPE and Shear
Shear Just Right • 2 -D equilibrium: squall line develops A A B B • 3 -D equilibrium: right moving and left moving supercells Left Mover Right Mover
Bulk Richardson Number (BRN) BRN= CAPE 1/ 2 Uz 2 (where U is a measure of the vertical z wind shear)
V Hodographs • Draw wind vectors in direction they are going U • This is opposite of how the wind barbs are drawn Wind speed
Example
Straight Line Shear 700 • Storm Splitting: – R and L storm cells move with mean wind but drift outward 1000 850 900 500
Curved Hodograph • Emphasizes one of the supercells – Veering (clockwise curve): • right moving supercells • warm air advection in northern hemisphere – Backing (counter clockwise curve): • left moving supercells • warm air advection in southern hemisphere 700 850 900 1000 500 300
Straight Line Hodograph Curved hodograph
Helicity • Can be thought of as a measure of the “corkscrew” nature of the winds. H = velocity dotted with vorticity =V • ζ = u (dyw - dzv) - v (dxw - dzu) + w (dxv - dyu) • Higher helicity values relate to a curved hodograph. – large positive values--> emphasize right cell – large negative values--> emphasize left cells • Values near zero relate to a straight line hodograph.
CAPE and Helicity • Plainfield, IL tornado: CAPE=7000 Helicity=165 Energy Helicity:
Supercell Index • Weights various parameters which are indicative of possible supercell development