Thermic Effect of Food A review of methodology

? What variables affect TEF? How is TEF")


")
- hood Meal")

 was significantly greater in gastric")

 1. Will ginger")
- chamber Meal served- 15")


-hood Meal served")
 displayed as kcal/min � Age adjusted")


 ◦ If measuring full TEF=")

- Slides: 38
Thermic Effect of Food A review of methodology, variables and data presentation
What is thermic effect of food (TEF)? What variables affect TEF? How is TEF measured? How is data displayed?
Outline � Thermic effect of food Review � History of methodology ◦ Weststrate, 1990 ◦ Reed, 1996 � Current methodology ◦ Wilms, 2013 ◦ Mansour, 2012 ◦ Du, 2014 � Conclusion � References
Outline �Review � History thermic effect of food of methodology ◦ Weststrate, 1990 ◦ Reed, 1996 � Current methodology ◦ Wilms, 2013 ◦ Mansour, 2012 ◦ Du, 2014 � Conclusion � References
Thermic Effect of Food � TEF is the increase in energy expenditure after eating � Composes about 10% of total energy � It includes the energy used for the ◦ ◦ Consumption of food Transportation of nutrients Digestion of nutrients Storage of excess fuel
Thermic Effect of Food � Variables ◦ ◦ ◦ that effect TEF include: Meal size Meal composition Gender Age Body composition Glucose/insulin responses
Outline � Review thermic effect of food �History of methodology ◦ Weststrate, 1990 ◦ Reed, 1996 � Current methodology ◦ Wilms, 2013 ◦ Mansour, 2012 ◦ Du, 2014 � Conclusion � References
� There ◦ ◦ ◦ ◦ is a variation in methodology! Instruments used in measuring RMR Study protocols Length of total measurement time Measured and break schedule State of activity allowed Choice of subjects Test meal composition Size of the test meal
Weststrate, 1993 Resting metabolic rate and diet induced thermogenesis: A methodological reappraisal Am J Clin Nutr
Methodology- Weststrate, 1993 1. 2. 3. 4. Obtain a valid RMR- fasting 12 hrs, rest time varied Give patient the meal- delivery of meal Measure metabolic rate for 3 -4 hours 1. Avg metabolic rate every 5 minutes 2. Avg metabolic rate for every hour 3. Subtract metabolic rate avg from base RMR to get DIT Allow patient to move every hour for 2 -3 minutes during calibration
� TEF displayed as k. J/min � Meal size variable
Methodology- Weststrate � Controversies to methodology ◦ 4 hour time period leads to large intra-individual variability ◦ Total DIT is not being shown in 4 hours
Reed, 1996 Measuring thermic effect of food Am J Clin Nutr
Methodology- Reed, 1996 Obtain a valid RMR- hood Give patient the meal Measure metabolic rate for 10 minutes every half hour for 6 subsequent hours 1. 2. 3. 1. 2. Measurements record same was as method 1 Subjects could relax and use the restroom
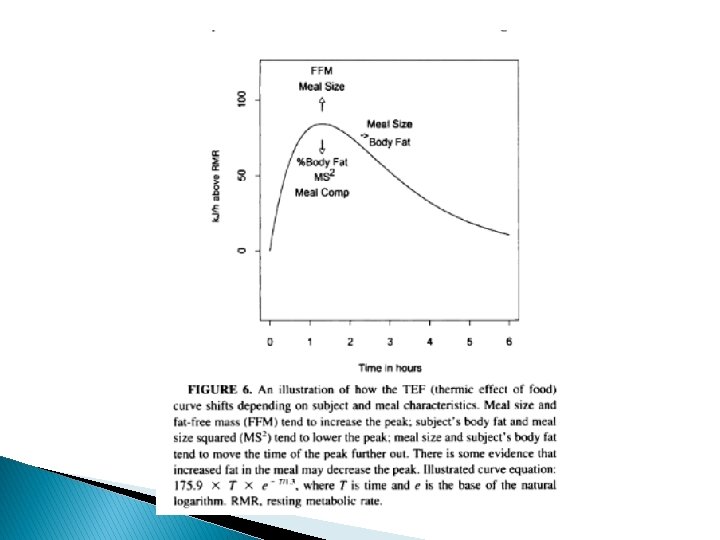
Results- Reed, 1996 � Sample TEF � TEF displayed as k. J/h above RMR � 6 hr mark
� Total measuring time � TEF displayed as % of meal size � Increase time=increased accuracy
Reed, 1996 � Variables that affect TEF
Outline � Review thermic effect of food � History of methodology ◦ Weststrate, 1990 ◦ Reed, 1996 �Current methodology ◦ Wilms, 2013 ◦ Mansour, 2012 ◦ Du, 2014 � Conclusion � References
Wilms, 2013 Enhanced thermic effect of food after Roux-en -Y gastric bypass surgery J Clin Endocrinol Metab
Wilms, 2013 Compares REE in lean, obese, and post-gastic bypass women (10 per group) of similar age and gender 1. Does gastric bypass surgery affect resting energy expenditure and TEF? 2. What is the relationship between TEF and postprandial insulin secretion?
Methodology- Wilms, 2013 1. 2. 3. Obtain a valid RMR (20 mins)- hood Meal served 1. containing 39 g carbs, 15 g prot, and 3 g fat (246 kcal) in Protiline balance (ensure-like drink) Indirect calorimeter was measured for 90 minutes 1. Two 30 minute measurements with a 30 minute break. Metabolic rate averaged every ten minutes. 2. During break- patients stayed in a resting state
� TEF measured as k. J/min � Gastric bypass increased peak and decreased time to peak RYGB (black columns) severely obese (gray columns) lean (open columns) *, P <. 01; **, P <. 001
Results � TEF area under curve (0– 90 minutes) was significantly greater in gastric bypass patients than in severely obese and lean women (both P <. 01) � Gastric bypass surgery is correlated with increased postprandial rise in glucose, insulin, and C-peptide levels (all P <. 001)
Mansour, 2012 Ginger consumption enhances thermic effect of food and promotes feelings of satiety without affecting metabolic and hormonal parameters in overweight men Metabolism
Mansour, 2012 Compares ginger’s affects on overweight men (BMI 25 -29) 1. Will ginger consumption affect TEF and satiety? 2. Does ginger alter appetite-regulating hormones and inflammatory markers?
Methodology, Mansour 1. 2. Obtain a valid RMR (30 mins)- chamber Meal served- 15 mins to consume 1. standard breakfast: 1. 5 small corn muffins: 525 kcal, 67. 5 g carb, 25 g fat, 7. 5 g prot 2. orange juice: 70 kcal, 17. 0 g carb, 3. 6 oz. of hot water 3. Indirect calorimeter was measured for 6 hours for 40 minutes/h 1. The first ten minutes of each measuring period was discarded for stabilization purposes
� TEF displayed as % increase over RMR � TEF increase 42. 7 kcal/d with ginger Black- with ginger white- without ginger
Results � There was a significant effect of ginger on TEF (ginger vs control = 42. 7 ± 21. 4 kcal/d, P =. 049) � The area under the curve was not different (P =. 43) � There were no effects of ginger on glucose, insulin, lipids, or inflammatory markers
Du, 2014 Thermic Effect of Food is Reduced in Older Adults Horm Metab
Du, 2014 Compare age’s affects on TEF in 209 men and women 1. Does age affect RMR and TEF and if so, how? 2. What is the relationship between body composition, fat distribution and postprandial insulin responses and measured TEF?
Methodology- Du, 2014 1. 2. 3. Obtain a valid RMR (30 mins)-hood Meal served 1. 33% of daily calories (from Ensure) calculated according to REE 2. Participants were then allowed to get out of bed to use the bathroom Indirect calorimeter was measured hourly for 4 hours 1. Each reading included a 5 minute stabilization period, followed by a 15 min reading
� TEE displayed as kcal/min � TEF (TEE-REE) displayed as kcal/min � Age adjusted for FFM � Older adults had reduced RMR and TEF
Results � BMR after being adjusted for FFM was less in older adults (p=0. 01) � TEF food was 1% less in the older adults (p=0. 02) � After controlling for meal size and FFM, body fat and fat distribution did not predict TEF � Both BMR and TEF are less in older adults, even when they have similar amounts of lean tissue and consume a similar size meal
Outline � Review thermic effect of food � History of methodology ◦ Weststrate, 1990 ◦ Pier, 1992 ◦ Reed, 1996 � Current methodology ◦ Wilms, 2013 ◦ Mansour, 2012 ◦ Du, 2014 �Conclusion � References
Conclusion � Methodology varies between studies (instrument, schedules, meal) ◦ If measuring full TEF= 4 -6 hours � Ways to display results: * ◦ ◦ ◦ Total TEE (avg kcal per min/h, total area under the curve) Total TEF (avg kcal per min/h, total area under the curve) % increase over RMR Peak energy or time to peak TEF % meal ◦ ◦ ◦ Meal size Body composition Gender Age Glucose/Insulin responses � Known variables that effect TEF:
References 1. Westrate, J. Resting metabolic rate and diet induced thermogenesis: A methodological reappraisal. Am J Clin Nutr November 1993 vol. 58 no. 5 592 -601. 2. Reed GW, Hill, JO. Measuring thermic effect of food. Am J Clin Nutr February 1996 vol. 63 no. 2 164 -169 3. Wilms B, Ernst B, Schmid SM, Thurnheer M, Schultes B. Enhanced thermic effect of food after Roux-en-Y gastric bypass surgery. J Clin Endocrinol Metab. 2013 Sep; 98(9): 3776 -84. Epub 2013 Jul 3. 4. Mansour MS, Ni YM, Roberts AL, Kelleman M, Roychoudhury A, St-Onge MP. Ginger consumption enhances thermic effect of food and promotes feelings of satiety without affecting metabolic and hormonal parameters in overweight men: a pilot study. Metabolism. 2012 Oct; 61(10): 1347 -52. Epub 2012 Apr 24. 5. Du S, Rajjo T, Santosa S, Jensen MD. Thermic Effect of Food is Reduced in Older Adults. Horm Metab Res 2014; 46(05): 365 -369