THERMAL PROPERTIES Plays a vital role in evaluating

 • Vicat Softening Temperature (VSP) • Thermal")


 specimen is usually")

 Defined as the temperature at which a flat ended probe")
 Test Method: • ASTMD 1525 or ISO 306 Test Specimens")
 APPARATUS • Immersion Bath • Heat Transfer Medium • Specimen")
 PROCEDURE • Prepare the immersion bath so that the temperature")
 PROCEDURE • Lower the assembly into the bath and apply")
 CASE STUDY Typical example of depth of penetration with temperature")
 • The torsion pendulum test determines shear modulus and")
 APPARATUS • Rigidly fixed & movable clamp • Disk")
 PROCEDURE • The temp equilibrium should be established first")
 FACTORS INFLUENCING • Specimen thickness, strain rate influences the")
 CASE STUDY • Shear modulus vs Temp. graph shows")
 CASE STUDY Shear modulus & tan d of Makrolon")


 • Measures the change in length")
 Test Method: • ASTMD 696 Test")
 APPARATUS • A vitreous silica dilometer")
 PROCEDURE • Measure the length of")
 PROCEDURE • Maintain the temperature of")
 CALCULATION Calculate the CLTE over the")
 RESULT & CONCLUSION • • •")
 FACTORS INFLUENCING • • Thermal expansion")


 • Specimen is supported in")
 Horizontal Rating Requirements HB 1. Specimens must")
 • A specimen is supported")
 Vertical Ratings Requirements 1. Specimens")
 Vertical Ratings Requirements • Specimens")
 Vertical Ratings Requirements • Specimens")
 • Tests")
 Vertical Rating")
 Procedure:")
 Vertical Rating")
 Vertical Rating")
 Vertical Rating")

 • Measures the percentage of oxygen that has")
 TEST SPECIMEN Type Plastic Form Width (mm) Thickness")
 APPARATUS : • • • Test Column *")
 PROCEDURE • Adjust gas flow rate in the")
 CALCULATION Oxygen index ‘n’ of the material for")
 RESULTS & CONCLUSION • Description of the material")

 Conditioning: 23 ±")


 • 125 ± 5 mm in length")
 • • • Test Chamber Laboratory Burner")
 • Start the stop watch simultaneously apply")

 • • DSC measures the heat flow into or from")
 APPARATUS • DSC apparatus consists of · · · ·")
 TERMINOLOGIES • Glass Transition Temperature (Tg): it is defined as")
 PROCEDURE · DSC apparatus consists of two sealed pans sample")
 FIRST ORDER TRANSITIONS (TC, TM) · Specimen mass appropriate of")
 FOR SECOND ORDER TRANSITION (TG) TYPICAL DSC CURVES · Use")
 Measurement of various properties / explanations • Heat Capacity •")
 HEAT CAPACITY • The heat flow at a given temperature")
 GLASS TRANSITION • Property of the amorphous region • Below")
 CRYSTALLIZATION • Above Tg, the polymers are in mobile conditions.")
c MELTING Above Tc, we reach the polymer's melting temperature, or")
 PUTTING IT ALL TOGETHER Corporate Training & Planning 83")
 POLYMER CRYSTALLINITY • Measure the area of under the melting")
 Degree of crystallinity is given by X 100% = Xc")
 FACTORS AFFECTING • Addition of fillers affects the transitions in")


 and reactive (air")


 • Measures the size change of a material Y z")


 APPARATUS • TMA works with different probes • Expansion probe")
 PROCEDURE • The sample expands during heating • The probe")


- Slides: 110
THERMAL PROPERTIES • Plays a vital role in evaluating the product performance & processibilty characteristics in polymers. • Thermal analytical methods monitor differences in some sample property as the temperature increases, or differences in temperature between a sample and a standard as a function of added heat. These methods are usually applied to solids to characterize the materials. Corporate Training & Planning 2
THERMAL PROPERTIES • Heat Deflection Temperature (HDT) • Vicat Softening Temperature (VSP) • Thermal Endurance • Thermal Conductivity • Thermal Expansion • Low Temperature Brittleness • Flammability • Melting Point, Tm, and Glass Transition, Tg (DSC) • Thermomechanical Analysis Corporate Training & Planning 3
HEAT DEFLECTION TEMPERATURE Defined as the temperature at which a standard test bar (5 x ½ x ¼ in ) deflects 0. 010 inch under a stated load of either 66 or 264 psi. Significance: • HDT values are used to compare the elevated temperature performance of the materials under load at the stated conditions. • Used for screening and ranking materials for short term heat resistance. • HDT values do not represent the upper temperature limit for a specific material or application. • The data are not intended for use in design or predicting endurance at elevated temperatures. Corporate Training & Planning 4
HEAT DEFLECTION TEMPERATURE Test Method: • ASTMD 648, ISO 75 1 and 75 2 Test Specimen: • 127 mm (5 in. ) in length, 13 mm (½ in. ) in depth by any width from 3 mm (⅛ in. ) to 13 mm ((½ in. ) Conditioning: • 23 ± 2 o. C and 50 ± 5% RH for not less than 40 hrs prior to test. Two replicate specimens are used for each test Corporate Training & Planning 5
HEAT DEFLECTION TEMPERATURE APPARATUS • Specimen Supports: Metal supports for the specimen of 100 ± 2 mm • Immersion Bath • Deflection Measurement Device • Weights: 0. 455 MPa (66 psi) ± 2. 5% or 1. 82 MPa (264 psi) ± 2. 5%. • Temperature Measurement System Apparatus for Determination of HDT Corporate Training & Planning 6
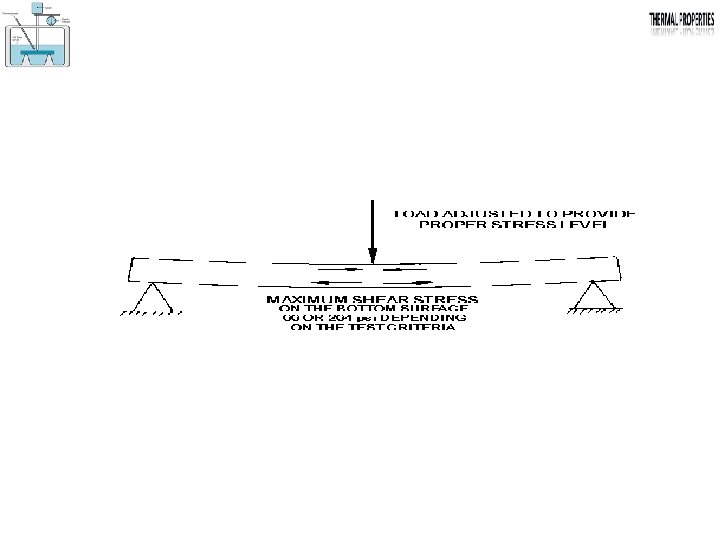
HEAT DEFLECTION TEMPERATURE PROCEDURE • Measure the width and depth of each specimen • Position the test specimens edgewise in the apparatus • Position thermometer bulb sensitive part of the temperature • Stir the liquid heat transfer medium thoroughly • Apply the loaded rod to the specimen and lower the assembly into the bath. • Adjust the load to obtain desired stress of 0. 455 MPa (66 psi) or 1. 82 MPa (264 psi) • Five minutes after applying the load, adjust the deflection measurement device to zero or record its starting position • Heat the liquid heat transfer medium at a rate of 2. 0 ± 0. 2 o. C/min. • Record the temperature of the liquid heat transfer medium at which the specimen has deflected the specified amount at the specified fibre stress. Corporate Training & Planning 7
HEAT DEFLECTION TEMPERATURE CALCULATION The weight of the rod used to transfer the force on the test specimen is included as part of the total load. The load (P) is calculated as: P = 2 Sbd 2 / 3 L Where, S = Max. Fibre stress in the specimen of 66 Psi / 264 Psi b = Width of specimen d = Depth of specimen L = Width of span between support (4 in) Corporate Training & Planning 8
HEAT DEFLECTION TEMPERATURE RESULTS & CONCLUSION • • • A bar of rectangular cross section is tested in the edgewise position as a simple beam. Load applied at the center to give maximum fibre stresses of 66 /264 psi. The specimen is immersed under load in a heat transfer medium provided with a means of raising the temperature at 2 ± 0. 2 o. C/min. The temperature of the medium is measured when the test bar has deflected 0. 25 mm (0. 010 in). This temperature is recorded as the deflection temperature under flexural load of the test specimen. Corporate Training & Planning 9
HEAT DEFLECTION TEMPERATURE FACTORS INFLUENCING • HDT of unannealed (heat treatment) specimen is usually lower than that of annealed specimen. • Specimen thickness is directly proportional to HDT because of the inherently low thermal conductivity of plastic materials. • Higher the fibre stress or loading lower the HDT. • Injection moulded specimen tend to have a lower HDT than compression – moulded specimen. • Compression moulded specimen are relatively stress free. Corporate Training & Planning 10
TYPICAL FIBRE STRAIN VS. TEMPERATURE DIAGRAM OF A PLASTIC SAMPLE Corporate Training & Planning 11
VICAT SOFTENING POINT (VSP) Defined as the temperature at which a flat ended probe with 1 mm 2 cross section penetrates a plastic specimen to 0. 04 inch (1 mm) depth. SIGNIFICANCE • Data obtained by this test method may be used to compare the heat softening qualities of thermoplastic materials. • This test method is useful in the areas of quality control, development and characterization of plastic materials. Corporate Training & Planning 12
VICAT SOFTENING POINT (VSP) Test Method: • ASTMD 1525 or ISO 306 Test Specimens : • The specimen shall be flat, between 3 and 6. 5 mm thick and at least 10 by 10 mm in area or 10 mm in diameter. Conditioning: • 23 ± 20 C and at 50 ± 5 % relative humidity of not less than 40 hrs A minimum of two specimens shall be used to test each sample. Corporate Training & Planning 13
VICAT SOFTENING POINT (VSP) APPARATUS • Immersion Bath • Heat Transfer Medium • Specimen Support • Penetration Measuring Device Masses: 10 ± 0. 2 N or 50 ± 1. 0 N • Temperature Measuring Device • Needle Fig. 2 Apparatus for Softening Temperature Determination Corporate Training & Planning 14
VICAT SOFTENING POINT (VSP) PROCEDURE • Prepare the immersion bath so that the temperature of the heat transfer medium is between 20 and 23 o. C at the start of the test • Place the specimen, which is at room temperature, on the specimen support. • The needle should not be nearer than 3 mm to the edge of the specimen. • Gently lower the needle rod, without the extra mass, so that the needle rests on the surface of the specimen and holds it in position. • Position the temperature measuring device so that the sensing end is located within 10 mm from where the load is applied to the surface of the specimen. Corporate Training & Planning 15
VICAT SOFTENING POINT (VSP) PROCEDURE • Lower the assembly into the bath and apply the extra mass required to increase the load on the specimen to 10 ± 0. 2 N (Loading 1) or 50 ± 1. 0 N (Loading 2). • After a 5 min waiting period, set the penetration indicator to zero. • Start the temperature rise. • Record the temperature of the bath when the needle has penetrated 1 ± 0. 01 mm into the test specimen. RESULTS & CONCLUSION • Vicat softening temperature is expressed as the arithmetic mean of the temperature of penetration of all specimens tested. • If the range of penetration temperatures for the individual test specimens exceeds 2 o. C, record the individual results and repeat the test, using at least two new specimens. Corporate Training & Planning 16
VICAT SOFTENING POINT (VSP) CASE STUDY Typical example of depth of penetration with temperature Corporate Training & Planning 17
TORSION PENDULUM TEST (THERMAL ENDURANCE) • The torsion pendulum test determines shear modulus and mechanical power factor over a wide range of temperatures. In this test an attached flywheel torsionally deforms a specimen, which is allowed to oscillate a in free vibration SIGNIFICANCE: • Determines the effect of elevated temperature on dynamic mechanical properties of plastics. • Provides a indication of a materials upper use temperature limit for short term exposure and degradation phenomenon in polymeric materials. • Gives a quantitative idea on glass transition temperature & crystalline melting point in polymers. • Test method: ASTMD 2236, DIN 53445 • Test Specimen: Specimens of rectangular or cylindrical shape and different length and width are used Corporate Training & Planning 18
TORSION PENDULUM TEST (THERMAL ENDURANCE) APPARATUS • Rigidly fixed & movable clamp • Disk or a rod with a known moment of inertia • A differential transformer • Strip chart recorder • An insulated chamber • Heater Torsion Pendulum tester for determining shear modulus in plastic materials Corporate Training & Planning 19
TORSION PENDULUM TEST (THERMAL ENDURANCE) PROCEDURE • The temp equilibrium should be established first in the chamber. • The clamped specimen is put into oscillation and the period and rate of decay of the amplitude of oscillation are measured. • The elastic shear modulus is calculated from the specimen dimensions, moment of inertia of the movable chamber and period of movement. RESULTS & CONCLUSION • The log decrement is observed to be an approximate 1 st derivative of the modulus temperature curve • The maximum at temperatures at which the modulus shows rapid drop. indicates the effective maximum load – bearing temp. Corporate Training & Planning 20
TORSION PENDULUM TEST (THERMAL ENDURANCE) FACTORS INFLUENCING • Specimen thickness, strain rate influences the test values • Modulus increases with the incorporation of fibres/reinforcements • Incorporation of additives also influences the storage & loss modulus along with the damping characteristics. Corporate Training & Planning 21
TORSION PENDULUM TEST (THERMAL ENDURANCE) CASE STUDY • Shear modulus vs Temp. graph shows the effects of glass transition temperature. • The modulus is very high at the beginning of the curve which decreases slowly as the temperature increases. • Near the glass transition temperature the modulus decreases very rapidly in a short temperature span. Corporate Training & Planning 22
TORSION PENDULUM TEST (THERMAL ENDURANCE) CASE STUDY Shear modulus & tan d of Makrolon 280 & Makrolon 8030 PC resins. • The damping expressed as log decrement is calculated from the rate at which the amplitude of oscillation decreases. • The plot of log decrement versus temperature shows the onset of the transition and this temperature is regarded as the maximum usable load bearing temperature. Corporate Training & Planning 23
THERMAL CONDUCTIVITY • Rate at which heat is transferred by conduction through a unit cross sectional area of a material when a temperature gradient exists perpendicular to the area. • The coefficient of thermal conductivity (K factor), is defined as the quantity of heat that passes through a unit cube of the substance in a given unit time when the difference in temperature of the two faces is 10 C. • Mathematically, thermal conductivity is expressed as K = Qt/A(T 1 T 2) • Q = amount of heat passing through a cross section, A causing a temperature difference, ∆T (T 1 T 2), t = thickness of the specimen. • K is thermal conductivity, typically measured as BTU. in / (hr. ft 2. 0 F) indicates the materials ability to conduct heat energy. Corporate Training & Planning 24
THERMAL CONDUCTIVITY SIGNIFICANCE • Thermal conductivity is particularly important in applications such as headlight housings, pot handles & hair curlers that require thermal insulation or heat dissipation properties. • Computerized mold filling analysis programs requires special thermal conductivity data derived at higher temperatures than specified by most tests. TEST METHODS & SPECIMEN • Test method: Guarded hot plate test ASTM 177, ISO 2582 • Test Specimen: Two identical specimens having plane surface of such size as to completely cover the heating unit surface • The thickness should be greater than that for which the apparent thermal resistivity does not change by more than 2% with further increase in thickness Corporate Training & Planning 25
THERMAL CONDUCTIVITY APPARATUS The apparatus is broadly of two different categories of the following: • Type I (low temperature) Temperature of cold plate : 21 K, Temperature of heating unit: <500 K • Unbalance Detectors • Cooling units • Type II (High temperature) Temperature of heating unit range: >550 K <1350 K • Sensors for measuring Temperature difference • Heating units • Clamping force • Gap & Metering Area • Measuring system for Temperature detector outputs Corporate Training & Planning 26
GUARDED HOT PLATE APPARATUS Guarded Hot plate Apparatus Courtesy: Bayer Material Data Sheet Corporate Training & Planning 27
THERMAL CONDUCTIVITY PROCEDURE • Two test specimens are sandwiched between the heat source (main heater) & heat sink; one on either side of the heat source. • The clamping force is so adjusted that the specimens remain in perfect contact with the heater & sink • Guard heaters are provided to prevent heat flow in all except in the axial direction towards the specimen • The time of stabilization of input & out put temperature is noted. • Temperature difference between the hot & cold surfaces of the specimen should not be less that 5 K or suitable differences as required. Corporate Training & Planning 28
THERMAL CONDUCTIVITY CALCULATION • The relationship between the quantity of heat flow and thermal conductivity is defined as Q ~ K x Q = Quantity of heat flow K = Thermal Conductivity X = The distance the heat must flow • Thermal conductivity is calculated as : K = Qt / A (T 1 – T 2) Q = Rate of heat flow (w) T = Thickness of specimen (m) A = Area under test (m 2) T 1 = Temperature of hot surface of specimen (k) T 2 = Temperature of cold surface of specimen (k) Corporate Training & Planning 29
THERMAL CONDUCTIVITY RESULTS & CONCLUSION • Thermal conductivity is calculated by using the value of rate of flow at a fixed temperature gradient. • Data are obtained in the steady state FACTORS INFLUENCING • Crystallites have higher conductivity. • As the density of the cellular plastic decreases, the conductivity also decreases up to a minimum value and rises again due to increased convection effects caused by a higher proportion of open cells. Corporate Training & Planning 30
THERMAL CONDUCTIVITY CASE STUDY • Variation of thermal conductivity with temperature Corporate Training & Planning 31
THERMAL EXPANSION (COEFFICIENT OF LINEAR THERMAL EXPANSION, CLTE) • Measures the change in length per unit length of a material, per unit change in temperature. • Expressed as in/in/0 F or cm/cm/0 C • Mathematically, CLTE (α), between temperatures T 1 & T 2 for a specimen of length L 0 at the reference temperature, is given by : SIGNIFICANCE α = (L 2 – L 1)/[L 0(T 2 – T 1 )] = L/L 0ΔT • Determines the rate at which a material expands as a function of temperature. • The higher the value for this coefficient the more a material expands and contracts with temperature changes. • Plastics tend to expand contract anywhere from six to nine times more than materials that are metallic. • The thermal expansion difference develops internal stresses and stress concentrations in the polymer, which allows premature failure to occur. Corporate Training & Planning 32
THERMAL EXPANSION (COEFFICIENT OF LINEAR THERMAL EXPANSION, CLTE) Test Method: • ASTMD 696 Test Specimen: • 12. 5 by 6. 3 mm (½ in. by ¼ in. ) 12. 5 by 3 mm (½ by ⅛ in. ), 12. 5 mm (½ in. ) in diameter or 6. 3 mm (¼ in. ) in diameter. Conditioning: • 23 ± 2 o. C & 50 ± 5% RH for not less than 40 h prior to test. Corporate Training & Planning 33
THERMAL EXPANSION (COEFFICIENT OF LINEAR THERMAL EXPANSION, CLTE) APPARATUS • A vitreous silica dilometer • Dial gage • The weight of the inner silica tube + the measuring device reaction shall not exert a stress > 70 k. Pa on the specimen so that the specimen is not distorted or appreciably indented. • Scale or Caliper • Controlled Temperature Environment • Means shall be provided for stirring the bath • Thermometer or thermocouple Corporate Training & Planning 34
THERMAL EXPANSION (COEFFICIENT OF LINEAR THERMAL EXPANSION, CLTE) PROCEDURE • Measure the length of two conditioned specimen at room temperature • Mount each specimen in a dilatometer, install the dilatometer in the – 30 o. C control environment. • Maintain the temperature of the bath in the range – 32 o. C to – 28 o. C ± 0. 2 o. C until temperature of the specimen along the length is constant • Record the actual temperature and the measuring device reading. • Change to the + 30 o. C bath, so that the top of the specimen is at least 50 mm below the liquid level of the bath. Corporate Training & Planning 35
THERMAL EXPANSION (COEFFICIENT OF LINEAR THERMAL EXPANSION, CLTE) PROCEDURE • Maintain the temperature of the bath in the range from + 28 to 32 o. C ± 0. 2 o. C • Record the actual temperature and the measuring device reading. • Change to – 30 o. C and repeat the above procedure & measure the final length of the specimen at room temperature. • If the change in length per degree of temperature difference due to heating does not agree with the change length per degree due to cooling within 10% of their average investigate the cause of the discrepancy and if possible eliminate. • Repeat the test until agreement is reached. Corporate Training & Planning 36
THERMAL EXPANSION (COEFFICIENT OF LINEAR THERMAL EXPANSION, CLTE) CALCULATION Calculate the CLTE over the temperature range as: α = ΔL/LoΔT α ΔL Lo ΔT = Average coefficient of linear thermal expansion degree Celsius. = Change in length of test specimen due to heating or to cooling, = Length of test specimen at room temperature (ΔL &Lo being measured in the same units), and = Temperature differences, o. C, over which the change in the length of the specimen is measured. The values of α for heating and for cooling shall be averaged to give the value to be reported. Corporate Training & Planning 37
THERMAL EXPANSION (COEFFICIENT OF LINEAR THERMAL EXPANSION, CLTE) RESULT & CONCLUSION • • • Provide a means of determining the CLTE of plastics, which are not distorted or indented by the thrust of the dilatometer on the specimen. The specimen is placed at the bottom of the outer dilatometer tube with the inner one resting on it. The measuring device, which is firmly, attached to the outer tube is in contact with top of the inner tube and indicates variations in the length of the specimen with changes in temperature. Temperature changes are brought about by immersing the outer tube in a liquid bath or other controlled temperature environment maintained at the desired temperature. The nature of most plastics and the construction of the dilatometer make – 30 to +30 o. C a convenient temperature ranges for linear thermal expansion measurements of plastics. This range covers the temperatures in which plastics are most commonly used. Corporate Training & Planning 38
THERMAL EXPANSION (COEFFICIENT OF LINEAR THERMAL EXPANSION, CLTE) FACTORS INFLUENCING • • Thermal expansion is substantially affected • by the use of additives • especially fillers • Wt% Of loading Lowers the coefficient of thermal expansion. Corporate Training & Planning 39
FLAMMABILITY • Plastics are carbon based materials and burn and give off gases and smoke when subjected to a flame. • Plastics are excellent fuels but are generally classed as ordinary combustibles • For combustion to take place, three components form the 'fire triangle’ Corporate Training & Planning 40
FLAMMABILITY THE PROCESS OF COMBUSTION IN PLASTICS FOLLOWS 6 SEPARATE STAGES TESTING FOR FLAMMABILITY Corporate Training & Planning • UL 94 • Limiting Oxygen Index • Rate of burning • Smoke density 41
FLAMMABILITY - UL 94 • Method of classifying a material’s tendency to either extinguish or spread a flame once it has been ignited SIGNIFICANCE • 12 flame classifications specified in UL 94. • Describes materials burning characteristics after test specimens have been exposed to a specific test flame under controlled laboratory conditions. • The classifications relate to rate of burning time to extinguish ability to resist dripping and whether or not the drips are burning. Test Method: IEC 60707, 60695 11 10, 60695 11 20, ISO 9772 & 9773. Specimen: 125 x 15 mm (5 x ½ in) Conditioning: 23 ± 2 o. C & 50 ± 5% RH for not less than 40 h prior to the test. Corporate Training & Planning 42
FLAMMABILITY - UL 94 APPARATUS • Fume Hood • HB Support Fixture • Laboratory Burner • Micrometer • Burner Wing Tip • Desiccator • Ring Stands • Conditioning Oven • Timing Devices • Specimen Mandrel Form • Measuring Scale • Tape • Wire Gauze • Support Gauze • Conditioning Room or Chamber • Manometer/Pressure Gage Flow Meter Corporate Training & Planning 43
FLAMMABILITY - UL 94 PROCEDURE • Horizontal Testing (HB) • Specimen is supported in a horizontal position, tilted at 45°. • Flame applied to the end of the specimen for 30 seconds or until the flame reaches the 1 inch mark. • If the specimen continues to burn after the removal of the flame, the time for the specimen to burn between the 1 and 4 inch marks are recorded. • If the specimen stops burning before the flame spreads to the 4 inch mark, the time of combustion and damaged length between the two marks is recorded. • Three specimens are tested for each thickness. Corporate Training & Planning 44
FLAMMABILITY - UL 94 HORIZONTAL TESTING (HB) Horizontal Rating Requirements HB 1. Specimens must not have a burning rate greater than 1. 5 inches/minute for thicknesses between 0. 120 and 0. 500 inches and 3 inches/minute for thicknesses less than 0. 120 inches. 2. Specimens must stop burning before the flame reaches the 4 inch mark. Corporate Training & Planning 45
FLAMMABILITY - UL 94 VERTICAL TESTING (V-0, V-1, V-2) • A specimen is supported in a vertical position and a flame is applied to the bottom of the specimen. • The flame is applied for 10 secs and then removed until flaming stops at which time the flame is reapplied for another 10 secs and then removed. • Two sets of five specimens are tested. • The two sets are conditioned under different conditions. Corporate Training & Planning 46
FLAMMABILITY - UL 94 VERTICAL TESTING (V-0, V-1, V-2) Vertical Ratings Requirements 1. Specimens must not burn with flaming combustion for more than 10 seconds after either test flame application. 2. Total flaming combustion time must not exceed 50 seconds for each set of 5 specimens. V 0 3. Specimens must not burn with flaming or glowing combustion up to the specimen holding clamp. 4. Specimens must not drip flaming particles that ignite the cotton. 5. No specimen can have glowing combustion remain for longer than 30 seconds after removal of the test flame. Corporate Training & Planning 47
FLAMMABILITY - UL 94 VERTICAL TESTING (V-0, V-1, V-2) Vertical Ratings Requirements • Specimens must not burn with flaming combustion for more than 30 secs after either test flame application. • Total flaming combustion time must not exceed 250 secs for each set of 5 specimens. V 1 • Specimens must not burn with flaming or glowing combustion up to the specimen holding clamp. • Specimens must not drip flaming particles that ignite the cotton. • No specimen can have glowing combustion remain for longer than 60 secs after removal of the test flame. Corporate Training & Planning 48
FLAMMABILITY - UL 94 VERTICAL TESTING (V-0, V-1, V-2) Vertical Ratings Requirements • Specimens must not burn with flaming combustion for more than 30 secs after either test flame application. • Total flaming combustion time must not exceed 250 secs for each set of 5 specimens. V 2 • Specimens must not burn with flaming or glowing combustion up to the specimen holding clamp. • Specimens can drip flaming particles that ignite the cotton. • No specimen can have glowing combustion remain for longer than 60 secs after removal of the test flame. Corporate Training & Planning 49
FLAMMABILITY - UL 94 VERTICAL TESTING (5 V, 5 V-A, 5 V-B) • Tests on both bar and plaque specimens. • Bar specimen supported in a vertical position • flame is applied to lower corners of the specimen at a 20° angle. • flame is applied for 5 seconds and is removed for 5 seconds. • flame application and removal is repeated five times. • Plaques specimen mounted horizontally • flame applied to the center of the lower surface of the plaque. Corporate Training & Planning 50
FLAMMABILITY - UL 94 VERTICAL TESTING (5 V, 5 V-A, 5 V-B) Vertical Rating 5 V Requirements 1. Specimens must hot have any flaming or glowing combustion for more than 60 seconds after the five flame applications. 2. Specimens must not drip. 3. Specimens must not be destroyed in the area of the flame. 5 V A 1. Specimens must hot have any flaming or glowing combustion for more than 60 seconds after the five flame applications. 2. Specimens must not drip flaming particles that ignite the cotton. 3. Plaque specimens must not exhibit burnthrough (a hole). 5 V B 1. Specimens must hot have any flaming or glowing combustion for more than 60 seconds after the five flame applications. 2. Specimens must not drip flaming particles that ignite the cotton. 3. Plaque specimens may exhibit burnthrough (a hole). Corporate Training & Planning 51
FLAMMABILITY - UL 94 VERTICAL TESTING OF THIN MATERIALS (VTM-0, VTM -1, VTM-2) Procedure: • An 8 x 2 in specimen is rolled longitudinally around a 1/2 in diameter mandrel and taped on one end. • When the mandrel is removed the specimen forms a cone. • The cone is supported in a vertical position and a flame is applied to the bottom of the specimen. • The flame is applied for three seconds and then removed until flaming stops at which time the flame is reapplied for another three seconds and then removed. • Two sets of five specimens are tested. • The two sets are conditioned under different conditions. Corporate Training & Planning 52
FLAMMABILITY - UL 94 VERTICAL TESTING OF THIN MATERIALS (VTM-0, VTM-1, VTM-2) Vertical Rating for Thin Materials Requirements VTM 0 • Specimens must not burn with flaming combustion for more than 10 secs after either test flame application. • Total flaming combustion time must not exceed 50 secs for each set of 5 specimens. • Specimens must not burn with flaming or glowing combustion up to the specimen holding clamp. • Specimens must not drip flaming particles that ignite the cotton. • No specimen can have glowing combustion remain for longer than 30 secs after removal of the test flame. • No specimen shall have flaming or glowing combustion up to a mark 5 inches from the bottom of the specimen. Corporate Training & Planning 53
FLAMMABILITY - UL 94 VERTICAL TESTING OF THIN MATERIALS (VTM-0, VTM-1, VTM-2) Vertical Rating for Thin Materials Requirements • Specimens must not burn with flaming combustion for more than 30 secs after either test flame application. • Total flaming combustion time must not exceed 250 secs for each set of 5 specimens. VTM 1 • Specimens must not burn with flaming or glowing combustion up to the specimen holding clamp. • Specimens must not drip flaming particles that ignite the cotton. • No specimen can have glowing combustion remain for longer than 60 secs after removal of the test flame. • No specimen shall have flaming or glowing combustion up to a mark 5 in from the bottom of the specimen. Corporate Training & Planning 54
FLAMMABILITY - UL 94 VERTICAL TESTING OF THIN MATERIALS (VTM-0, VTM-1, VTM-2) Vertical Rating for Thin Materials Requirements • Specimens must not burn with flaming combustion for more than 30 seconds after either test flame application. • Total flaming combustion time must not exceed 250 seconds for each set of 5 specimens. • Specimens must not burn with flaming or glowing combustion up to the specimen holding clamp. • Specimens can drip flaming particles that ignite the cotton. • No specimen can have glowing combustion remain for longer than 60 seconds after removal of the test flame. • No specimen shall have flaming or glowing combustion up to a mark 5 inches from the bottom of the specimen. VTM-2 Corporate Training & Planning 55
FLAMMABILITY - UL 94 RESULTS & CONCLUSION • Materials with an HB rating were tested in the horizontal position and found to burn at a rate less than the specified maximum. • HB classified materials are generally not permitted where flammability is a major concern. • The “V” ratings indicate the material was tested in a vertical position. • V 0, V 1 and V 2 indicate that the material self extinguished within a specified time period after the flame was removed and whether the test specimen dripped flaming particles that ignited a cotton indicator below the sample. • VTM ratings are derived from tests designed for very thin materials. • 5 V ratings are the result of the most severe test where the flame is applied 5 times. Corporate Training & Planning 56
FLAMMABILITY - LIMITING OXYGEN INDEX (LOI) • Measures the percentage of oxygen that has to be present to support combustion of the plastic • Air contains approximately 21% oxygen • Material with an LOI of less than 21 will support burning in an open air situation. SIGNIFICANCE: • Tendency of a material to sustain a flame, is widely used as a tool to investigate the flammability of polymers. • A high index, therefore, is indicative of a less easily ignited and less flammable material • Test Method: ASTM D 2863, ISO 4589 Corporate Training & Planning 57
FLAMMABILITY - LIMITING OXYGEN INDEX (LOI) TEST SPECIMEN Type Plastic Form Width (mm) Thickness (mm) Length (mm) A Physically selfsupporting 6. 5± 0. 5 3. 0± 0. 5 70 to 150 B Alternate for selfsupporting flexible plastics 6. 5± 0. 5 2. 0± 0. 25 70 to 150 C Cellular plastic 12. 5± 0. 5 125 to 150 D Film or thin sheet 52± 0. 5 As received 140± 5 CONDITIONING: • 23 ± 2 o. C and 50 ± 5% RH for not less than 40 h prior to the test • A minimum of three specimens shall be used Corporate Training & Planning 58
FLAMMABILITY - LIMITING OXYGEN INDEX (LOI) APPARATUS : • • • Test Column * Ignition Source Specimen Holder * Timer Gas Supply Flow Measurement and Control Devices Soot, Fumes and Heat Removal PROCEDURE • Test conditions: 23 ± 2 o. C (73. 4 ± 3. 6 o. F) & 50 ± 5% RH • Vertically position the specimen in the approximate center of the column • The top of the specimen at least 100 mm below the top of the open column. • Adjust initial concentration of oxygen based on the burning characteristics of the material. Corporate Training & Planning 59
FLAMMABILITY - LIMITING OXYGEN INDEX (LOI) PROCEDURE • Adjust gas flow rate in the column to 4 ± 1 mm/s • Allow the gas to flow for 30 s to purge the system. • Ignite the entire top of the specimen • Remove the ignition flame and start the timer. • Perform the test at least 3 times by starting at a slightly different flow rate within the 30 to 50 mm/s limits Type Plastic Form Criteria or burning A Physically self-supporting At least 3 min or 50 mm B Alternate for self-supporting flexible plastics At least 3 min or 50 mm C Cellular plastic At least 3 min or 75 mm D Film or thin sheet Past the 100 -mm reference mark Corporate Training & Planning 60
FLAMMABILITY - LIMITING OXYGEN INDEX (LOI) CALCULATION Oxygen index ‘n’ of the material for each test specimen is: Where, O 2 = volumetric flow of oxygen (mm 3/s) at the required concentration N 2 = corresponding volumetric flow rate of nitrogen, mm 3/s. If air is used and either oxygen or nitrogen is added as required, n. % = (100 x O 2) + (20. 9 x A)/(O 2 + N 2 + A) Where, A = volumetric flow rate of air. mm 3/s, O 2 = volumetric flow rate of oxygen, and N 2 = volumetric flow rate of nitrogen. Corporate Training & Planning 61
FLAMMABILITY - LIMITING OXYGEN INDEX (LOI) RESULTS & CONCLUSION • Description of the material tested including the type, density and general direction of anisotropy • Test specimen dimensions • Individual OIT for each of the tests and average OIT value. • Description of any unusual behavior such as charring, dripping, bending etc. • Self sustaining combustion is not possible if LOI>100, such values are not physically meaningful. • The effectiveness of fire retardant is measured by the change in the critical oxygen concentration that they induce as a function of their concentration. • FACTORS INFLUENCING • • LOI values decreases with the increase in the test temperature LOI increases with the increase in the moisture in the specimen Incorporation of fillers & flame retardant increases the LOI value Increase in the thickness of the specimen increases LOI Corporate Training & Planning 62
SMOKE DENSITY • The techniques for measuring smoke density are based on the principle of extinction measurement while using optical devices. • The tests are carried out in two different ways a) The smoke generated is collected in a closed system & then measured b) The smoke is measured as it escapes from the test assembly • The first method stimulates smoke production in a test chamber while the second method corresponds to smoke production in an escape route SIGNIFICANCE • Provides a considerable value in comparing the relative smoke generating characteristics of plastics. • Determines the extent to which plastics materials are likely to smoke under conditions of active burning and decomposition in the presence of flame. Corporate Training & Planning 63
SMOKE DENSITY Test Method: ASTM D 2843, ASTM E 662 (NBS) Conditioning: 23 ± 2 o. C & 50 ± 5% RH for not less than 40 h prior to the test Specimen : APPARATUS (ASTM D 2843 – 88) • • • Aluminum test Chamber Specimen Holder Ignition System Photometric System Timing Device Planimeter v Tests shall be conducted in a hood that has a window for observing the test. ASTM Specimen dimensions No. of specimens D 2863 Solid: 30 x 4 mm Foam: 60 x 25 mm Covering: 30 x original thickness 06 nos. E 662 76 x 25 mm 3 are tested under smouldering & 3 under flaming conditions Corporate Training & Planning 64
SMOKE DENSITY PROCEDURE • Shut off the exhaust blower, close the smoke chamber door and immediately position the burner under the specimen and start the timer. • Turn on the photometer lamp, exit sign and exhaust blower. • Turn on the propane, ignite the burner & adjust the propane pressure to 276 k. Pa • Record the percent light absorbed at 15 s intervals for 4 min. • Set the temperature compensation. • Record observations during the conduct of the test. • Adjust the lamp control to zero percent light absorption. • • Position test specimen flat on the screen so that the burner flame will be directly under the specimen • Set the timer to zero. Include the time it takes for the sample to burst into flame the time for flame extinguishment or specimen consumption, the obscuration of the exist sign by smoke accumulation and any general or unusual burning characteristics noted such as melting, dripping foaming or charring. • Run all tests in triplicate. Corporate Training & Planning 65
SMOKE DENSITY RESULT & CONCLUSION FACTORS INFLUENCING • The percentage light absorbed is measured and recorded at 15 sec intervals for 4 mins • The light absorption data are plotted with respect to time • The area under the curve in percentage is obtained as smoke density for the rating of materials. • Classification in various smoke grades is obtained • The degree of obscuration of vision by smoke generated by combustibles can be substantially affected by changes in quantity and form material, humidity, dust, temperature and the supply of oxygen. Corporate Training & Planning 66
RATE OF BURNING • Compares the relative rate of burning and / or extent and time of burning of self supporting plastics or panels and tested in the horizontal position. SIGNIFICANCE • Compares the rate of burning and/or extent and time of burning characteristics of different materials, in controlling manufacturing processes, • Measures the deterioration or change in these burning characteristics prior to or during use. TEST METHOD • ASTM D 635 Standard Test Method for Rate of Burning and / or Extent and Time of Burning of Self Supporting Plastics in a Horizontal Position • ASTM D 1433 Standard Test method for rate of burning of flexible thin plastic sheeting supported on a 450 incline Corporate Training & Planning 67
RATE OF BURNING SPECIMENS (ASTM D 635) • 125 ± 5 mm in length by 12. 5 ± 0. 2 mm in width and of thickness of material normally supplied. • Specimens shall be marked by scribing two lines, 25 mm and 100 mm from one end of the specimen. • The edges of the test specimens shall be smooth. Sawed edges should be fine sanded to a smooth finish. At least ten test specimens for each test Corporate Training & Planning 68
RATE OF BURNING APPARATUS (ASTM D 635) • • • Test Chamber Laboratory Burner Wire Gauze. Timing Device Pan of water. Scale PROCEDURE (ASTM D 635) • Clamp the specimen at the end nearest the 100 mm mark, in a support with its longitudinal axis horizontal and its transverse axis inclined at 45 o to the horizontal. • Under the test specimen clamp a screen of wire gauze • A pan of water should be placed on the floor of the hood in position to catch any burning particles that may drop during the test. • Place the burner remote from the specimen, ignite and adjust it to produce a blue flame 20 mm high. Corporate Training & Planning 69
RATE OF BURNING PROCEDURE (ASTM D 635) • Start the stop watch simultaneously apply the flame for 30 secs. • If the specimen warps, melts or shrinks away from the flame, move the flame to keep it in contact with the specimen. • Remove the burner at 30 s or when the flame front reaches the 25 mm mark • Record the time, in seconds, on the watch when the flame front reaches the 25 mm mark, as burning time t 1. • If the burning has not reached the 100 mm mark, measure the unburned length • Repeat the procedure until three specimens have burned to or beyond the 100 mm mark, or ten specimens have been tested. Corporate Training & Planning 70
CALCULATION RATE OF BURNING • The extent of burning is defined as 100 mm minus the unburned length in the same units. • If the specimen has burned to or beyond the 100 mm mark, calculate the burning rate as 450/(t t 1) (cm/min). • Average Time of Burning (ATB): ATB = [Σ(t – 30 s)]/number of specimens • Average Extent of Burning (AEB): AEB, mm = [Σ(100 mm – unburned length)]/number of specimen RESULTS & CONCLUSION • Burning Rate –two or more specimens have burned to the 100 mm gage mark, report the average burning rate (cm/min) as the average of the burning rates of all specimens which have burned to the mark. • Average Time of Burning and Average Extent of Burning –none of ten or no more than one to twenty specimens has burned to the 100 mm mark, report the average time of burning and average extent of burning. Corporate Training & Planning 71
DIFFERENTIAL SCANNING CALORIMETRY (DSC) • • DSC measures the heat flow into or from a sample as it is heated, cooled or held under isothermal conditions Applications of DSC characterization of • • Polymers fibres Elastomers Composites films pharamaceuticals foods cosmetics includes • DSC provides the following important properties of materials • • • Corporate Training & Planning Glass Transition Temp. (Tg) Melting point (Tm) Crystallization times & Temp. Heats of melting & crystallization Percent Crystallinities Heat set temp. OIT Compositional Analysis Heat capacities Heats of cure Thermal Stabilities 72
DIFFERENTIAL SCANNING CALORIMETRY (DSC) APPARATUS • DSC apparatus consists of · · · · Furnace Temperature Sensor Differential Sensor Test Chamber Environment Temperature Controller Recording Device Sealed pans Balance Corporate Training & Planning 73
DIFFERENTIAL SCANNING CALORIMETRY (DSC) TERMINOLOGIES • Glass Transition Temperature (Tg): it is defined as the temperature below which the polymer is in the glassy state & above which it attains rubbery state. • First order transitions: In a first-order transition there is a transfer of heat between system and surroundings and the system undergoes an abrupt volume change eg. Melting point (Tm), Crystallization Temperature (Tc) • Second order transitions: In a second-order transition, there is no transfer of heat, but the heat capacity does change. The volume changes to accommodate the increased motion of the wiggling chains, but it does not change discontinuously. • Samples: Powder, Liquids, crystal Corporate Training & Planning 74
DIFFERENTIAL SCANNING CALORIMETRY (DSC) PROCEDURE · DSC apparatus consists of two sealed pans sample and reference aluminum pans · The pans are heated, or cooled, uniformly while the heat flow difference between the two is monitored. · This can be done at a constant temperature (isothermally), but is more commonly done by changing the temperature at a constant rate, called temperature scanning. · The instrument detects differences in the heat flow between the sample and reference & plots the differential heat flow between the reference and sample cell as a function of temperature. Corporate Training & Planning 75
DIFFERENTIAL SCANNING CALORIMETRY (DSC) FIRST ORDER TRANSITIONS (TC, TM) · Specimen mass appropriate of 5 mg is taken in the pan · Intimate thermal contact between the pan and specimen is established for reproducible results. · Heat the sample at a rate of 10 o. C/min under inert gas atmosphere from 50 o. C below to 30 o. C above the melting point to erase thermal history. · The selection of temperature and time are critical when effect of annealing is studied. · Hold temperature for 10 min. · Cool to 50 o. C below the peak crystallization temperature at a rate of 10 o. C/min and record the cooling curve. · Repeat heating as soon as possible under inert purge gas at a rate of 10 o. C/min, and record the heating curve. Corporate Training & Planning 76
DIFFERENTIAL SCANNING CALORIMETRY (DSC) FOR SECOND ORDER TRANSITION (TG) TYPICAL DSC CURVES · Use a specimen mass of 5 mg. · Perform and record a preliminary thermal cycle as up to a temperatures 30 o. C above the extrapolated end temperature, Te, to erase previous thermal history, heating at a rate of 20 o. C/min. · Hold temperature for 10 min. · Quench cool to 50 o. C below the transition temperature of interest. · Hold temperature for 10 min. · Repeat heating at a rate of 20 o. C/min, and record the heating curve until all desired transition have been completed. Corporate Training & Planning 77
DIFFERENTIAL SCANNING CALORIMETRY (DSC) Measurement of various properties / explanations • Heat Capacity • Heating the sample & Reference pans, the difference in heat output of the two heaters is plotted against temperature. i. e the heat absorbed by the polymer against temperature. Corporate Training & Planning 78
DIFFERENTIAL SCANNING CALORIMETRY (DSC) HEAT CAPACITY • The heat flow at a given temperature is represented units of heat, q supplied per unit time, t. • The heating rate is temperature increase T per unit time, t. Dividing, Corporate Training & Planning 79
DIFFERENTIAL SCANNING CALORIMETRY (DSC) GLASS TRANSITION • Property of the amorphous region • Below Tg: Disordered amorphous solid with immobile molecules • Above Tg: Disordered amorphous solid in which portions of molecules can wiggle around • A second order transition ( Increase in heat capacity but there is no transfer of heat Corporate Training & Planning 80
DIFFERENTIAL SCANNING CALORIMETRY (DSC) CRYSTALLIZATION • Above Tg, the polymers are in mobile conditions. • When they reach the right temperature, they gain enough energy to move into very ordered arrangements, which we call crystals, • When polymers fall into these crystalline arrangements, they give off heat. • When this heat is dumped out, there is drop in the heat flow as a big dip in the plot of heat flow versus temperature • We call crystallization an exothermic transition. Corporate Training & Planning 81
DIFFERENTIAL SCANNING CALORIMETRY (DSC)c MELTING Above Tc, we reach the polymer's melting temperature, or Tm, those polymer crystals begin to fall apart, that is they melt. The chains come out of their ordered arrangements, and begin to move around freely. Melting is a first order transition (Tm). Corporate Training & Planning 82
DIFFERENTIAL SCANNING CALORIMETRY (DSC) PUTTING IT ALL TOGETHER Corporate Training & Planning 83
DIFFERENTIAL SCANNING CALORIMETRY (DSC) POLYMER CRYSTALLINITY • Measure the area of under the melting of the polymer. • Plot of heat flow per gram of material, versus temperature. multiply this by the mass of the sample Corporate Training & Planning 84
DIFFERENTIAL SCANNING CALORIMETRY (DSC) Degree of crystallinity is given by X 100% = Xc Where , H’= Heat of Fusion determined from DSC thermogram H*m= Heat of fusion of a 100% crystalline sample RESULTS & CONCLUSION • DSC thermograms provides an elaborate picture of various transitions in a polymer. • The degree of crystallinity in a polymer sample, specific heat etc. can be determined. • Any side reaction (for example, crosslinking, thermal degradation or oxidation) shall also be reported and the reaction identified if possible. Corporate Training & Planning 85
DIFFERENTIAL SCANNING CALORIMETRY (DSC) FACTORS AFFECTING • Addition of fillers affects the transitions in DSC • Previous thermal history of the samples also affects the DSC transitions. • There should be proper contact between the samples & pans Corporate Training & Planning 86
CASE STUDY 1: THERMAL HISTORY OF THERMOPLASTIC MATERIALS · · DSC heating profiles for two samples of a PPS, that were previously subjected to different thermal histories. The solid curve represents the material after quench cooling from the molten state. The broken curve represents the material after slow, controlled cooling. The quenched material exhibits a totally amorphous internal structure (as indicated by a Tg) which rearranges on heating to the more stable crystalline structure with an associated exothermic crystallization peak and subsequent melting peak. The slowly cooled material, on the other hand, yields a highly crystalline structure as evidenced by the presence of only a melting peak and a very weak glass transition on reheating. Corporate Training & Planning 87
Corporate Training & Planning 88
CASE STUDY 2: IMMISCIBLE BLENDS Corporate Training & Planning 89
CASE STUDY 3: THERMOSET CURE BY MEASURING THE QUANTITY OF HEAT EVOLVED Corporate Training & Planning 90
THERMO GRAVIMETRIC ANALYSIS Changes in weight of the specimen is recorded as the specimen is heated in air or in a controlled atmosphere such as nitrogen TERMINOLOGIES · Highly volatile matter – moisture, plasticizer, residual solvent or other low boiling (200 o. C or less) components. · Medium volatile matter – medium volatility materials such as oil and polymer degradation products. In general, these materials degrade or volatilize in the temperature range 200 to 750 o. C. · Combustible material – oxidizable material not volatile (in the unoxidized from) at 750 o. C, or some stipulated temperature dependent on material. Carbon is an example of such a material. · Ash – nonvolatile residues in an oxidizing atmosphere which may include metal components, filler content or inert reinforcing materials. · Mass loss plateau – a region of a thermogravimetric curve with a relatively constant mass. Corporate Training & Planning 91
THERMO GRAVIMETRIC ANALYSIS SIGNIFICANCE • Provides a general technique to determine the amount of highly volatile matter, medium volatile matter, combustible material and ash content of compounds. • Thermogravimetric curves (thermograms) provide information regarding polymerization reactions, the efficiencies of stabilizers and activators, thermal stability of final materials, and direct analysis. • This test method is useful in performing a compositional analysis in polymers • This test method is applicable to solids and liquids. Corporate Training & Planning 92
THERMO GRAVIMETRIC ANALYSIS APPARATUS Corporate Training & Planning 93
THERMO GRAVIMETRIC ANALYSIS PROCEDURE · · · Establish the inert (nitrogen) and reactive (air oxygen) gases at the desired flow rates in the range of 10 to 100 m. L/min. Switch the purge gas to the inert (nitrogen) gas. Zero the recorder and tare the balance. Open the apparatus to expose the specimen holder. Prepare the specimen of 10 to 30 mg and carefully place it in the specimen holder. Position the specimen temperature sensor · · · Enclose the specimen holder. Record the initial mass. Initiate the heating program within the desired temperature range. Record the specimen mass change continuously over the temperature interval. The mass loss profile may be expressed in either milligrams or mass percent of original specimen mass. Once a mass loss plateau is established in the range 600 to 1200 o. C, depending on the material, switch from inert to reactive environment. Corporate Training & Planning 94
THERMO GRAVIMETRIC ANALYSIS CALCULATION Corporate Training & Planning 95
THERMO GRAVIMETRIC ANALYSIS CALCULATION Corporate Training & Planning 96
THERMO GRAVIMETRIC ANALYSIS CALCULATION Corporate Training & Planning 97
THERMO GRAVIMETRIC ANALYSIS CALCULATION Corporate Training & Planning 98
THERMO GRAVIMETRIC ANALYSIS FACTORS INFLUENCING • Oil filled elastomers have such high molecular weight oils and such low molecular weight polymer content that the oil and polymer may not be separated based upon temperature stability. • Ash content materials (metals) are slowly oxidized at high temperatures and in an air atmosphere, so that their mass increases (or decreases) with time. Under such conditions, a specific temperature or time region must be identified for the measurement of that component. • Polymers, especially neoprene and acrylonitrile butadiene rubber (NBR), carbonize to a considerable extent, giving low values for the polymer and high rubber values. · Others, such as calcium carbonate, release CO 2 upon decomposition at interference is dependent upon the type and quantity of pigment present. Corporate Training & Planning 99
CASE STUDY 1 Corporate Training & Planning 100
CASE STUDY 2 • • • Elastomer contains oil, polymer and carbon black Oil and polymer weight loss steps severely overlap with standard TGA Cannot quantify amount of oil and polymer in sample Corporate Training & Planning 101
CASE STUDY 3 • ABS has three weight losses due to SAN copolymer, butadiene and carbon residue • Level of butadiene is important as this is related to ABS impact resistance Corporate Training & Planning 102
THERMO MECHANICAL ANALYSIS (TMA) • Measures the size change of a material Y z • X As the temperature of a material changes, so does its free volume. Corporate Training & Planning 103
Volume/mm 3 TMA: FREE VOLUME AND EXPANSION Free Volume As the space between the chains increases, the chains can move Occupied Volume Tg Temperature/K • Slope is Coeffient of Thermal Expansion (CTE) • Change of Slope represents a transition (Tg here) Corporate Training & Planning 104
TMA MEASURES THE FOLLOWING Corporate Training & Planning 105
THERMO MECHANICAL ANALYSIS (TMA) APPARATUS • TMA works with different probes • Expansion probe is commonly used Corporate Training & Planning 106
THERMO MECHANICAL ANALYSIS (TMA) PROCEDURE • The sample expands during heating • The probe is pushed up • Resulting expansion of the sample is recorded Corporate Training & Planning 107
CASE STUDY 1 Corporate Training & Planning 108
CASE STUDY 2: TMA PENETRATION OF CROSSLINKED & NON-CROSSLINKED PE The sample with cross linking exhibits smaller degree of penetration due to higher viscosity in the liquid region above mp Corporate Training & Planning 109
Corporate Training & Planning 110