Thermal properties of gases When investigating the behaviour

Thermal properties of gases When investigating the behaviour of gases, we are able to measure three varying quantities about a fixed mass of gas? Pressure Volume Temperature

The vertical scale is used to measure the volume of trapped air in the glass tube V=Al assuming A constant V l The pressure is measured by this gauge in k. Pa Need to add 101 k Pa for atmospheric pressure BOYLE’S LAW (keeping T constant) We investigate how the volume of the air depends on xthe pressure applied (with T constant). _ x P(k. Pa) V( l) 110 16 100 18 80 22. 5 60 30 40 45 35 52 _ _ x _ P _ x _ x _ _ _ | | V | | |
 The vertical scale is used to measure the volume")
BOYLE’S LAW (keeping T constant) The vertical scale is used to measure the volume of trapped air in the glass tube V=Al assuming A constant V l We need a straight line through the origin. Plot the graph of p vs 1/V _ The pressure is measured by this gauge in k. Pa - Need to add 101 k Pa for atmospheric pressure p(k. Pa) V( l) 1/V 110 16 . 063 100 18 . 056 22. 5 . 044 60 30 . 033 40 45 . 022 35 52 . 019 80 X X _ _ p _ X _ _ X X _ _ _ | | 1/V | |

From the graph as it is a straight line through the origin BOYLE’S LAW For a fixed mass of gas, at constant temperature for a constant temperature. If the gas is held at a constant temperature which is higher what will happen to the P-V graph and the P-1/V graph?

x Higher temperature - more pressure for the same volume X x x _ X Higher x _ _ temperaturex Higher X _ _ temperature x _ _ X x _ p p _ x _ x X _ _ _ | | V | | | | 1/V | |

Water bath Thermometer Trapped air column Mercury At atmospheric pressure open to atmosphere CHARLE’S LAW 1746 -1823 (Pressure kept constant) In this experiment we investigate how the volume of a gas changes as the temperature changes (with the pressure kept constant). Air is held inside a glass capillary tube by a short length of mercury. The length of the trapped air is a measure of the volume of the air assuming uniform crosssection. The apparatus is heated in a water bath, starting from cold, measure the volume and temperature at regular temperature intervals. Plot a graph of Volume against Temperature
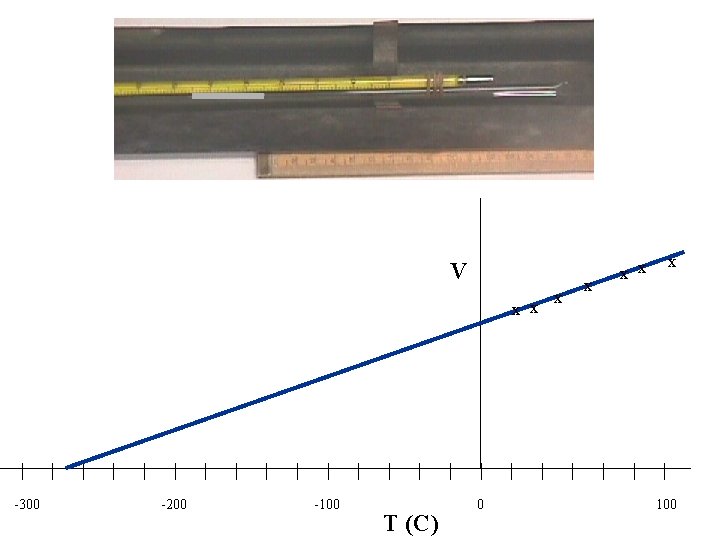

V x x | -300 | | 0 K | | | -200 | | 100 K | | | -100 | | 200 K | T | | 273 K 0 | x x | 300 K | x x x | | | 100

This graph suggests there is a temperature where the volume of the gas will be zero. Although the gas would liquefy before cooling to 0 K this experiment suggests that there is a limit to how cold objects can be. This is called the absolute zero of temperature 0 K = -273. 15 C

From the graph if we use the Kelvin temperature scale as it is a straight line through the origin CHARLE’S LAW for a constant pressure For a fixed mass of gas, at constant pressure, Volume (V) is directly proportional to the absolute temperature (T) (in K) If the gas is held at a constant pressure which is higher what will happen to the V-T graph?

For the gas to be at a higher pressure with the same mass of gas the volume would need to decrease V x x | -300 | | 0 K | | | -200 | | 100 K | | | -100 | | 200 K | T | | 273 K 0 | x x | 300 K | x x x | | | 100
 (Constant volume) We use the apparatus shown to investigate how the")
GAY-LUSSAC’S LAW (17781850) (Constant volume) We use the apparatus shown to investigate how the pressure of air changes as the temperature changes (with the volume kept constant) Glass bulb has mass of gas which is heated using bunsen burner with water in tin can, where V kept constant Water is heated and temperature and pressure readings are taken at several different temperature readings. Plot P vs T Difference in height of mercury is a measure of the pressure (need to add atmospheric pressure 760 mm mercury)

p x x | -300 | | 0 K | | | -200 | | 100 K | | | -100 | | 200 K | T | | 273 K 0 | x x | 300 K | x x x | | | 100

From the graph if we use the Kelvin temperature scale as it is a straight line through the origin GAY-LUSSAC’S LAW for a constant volume For a fixed mass of gas, at constant volume, Pressure (p) is directly proportional to the absolute temperature (T) (in K) If the gas is held at a constant volume which is higher what will happen to the P-T graph?

With a larger volume the pressure would not be as great p x x | -300 | | 0 K | | | -200 | | 100 K | | | -100 | | 200 K | T | | 273 K 0 | x x | 300 K | x x x | | | 100
 Gas Laws BOYLE’S LAW CHARLE’S LAW GAY-LUSSAC’S LAW Combining")
From the empirical (from experiment) Gas Laws BOYLE’S LAW CHARLE’S LAW GAY-LUSSAC’S LAW Combining these together we get Ideal Gas Equation This describes the behaviour of gases when they are not too dense ( the pressure is not too high, about 1 atmos or so) and not close to the liquefaction (boiling) point.

Often used to solve problems in this form Example: A bicycle pump contains 70. 0 cm 3 of air at pressure of 1. 00 atmosphere and a temperature of 7. 00 C. When the air is compressed to 30. 0 cm 3 at a temperature of 27. 00 C, what is the pressure?

p 2 = 1. 0 x 70 x 280 30 x 300 p 2 = 2. 18 atm or 2. 21 x 105 Pa

Ideal Gas Equation of State But what is this constant? What does it depend on? It will depend on the mass of gas present ie the number of particles present or the number of moles of gas. N = number of particles NA = Avagadro’s number

It is found that R is the same for all gases when n is the number of moles - R is called the universal gas constant R = 8. 315 J/(mol. K) When one mole gas at 273 K and a pressure of 100 k. Pa , V=22. 71 (22. 7 x 10 -3 m 3) STP conditions It is called the “ideal” gas equation because real gases do not follow precisely the equation, particularly at high pressure (and density) or when gas is near the liquefaction point (boiling point). However at pressures less than 1 atmosphere and T not too high the equation is quite accurate and useful for real gases.

In Physics we are interested in the actual number of particles in the gas N If we let the constant = Nk n. R = Nk for 1 mole of gas, the number of particles is Avogadro’s number = 6. 023 x 10 23 particles (NA) 1(8. 31) = 6. 023 x 10 23 k k = 1. 38 x 10 -23 J K-1 (BOLTZMANN’S CONSTANT) Physicists use
- Slides: 21