Thermal analysis Dr Rulla Sabah Thermal Analysis Thermal

Thermal analysis Dr. Rulla Sabah

Thermal Analysis • Thermal analysis is a branch of materials science where the properties of materials are studied as they change with temperature When matter is heated, it undergoes certain physical and chemical changes. Physical changes include phase changes such as melting, vaporization, crystallization, transitions between crystal structures, changes in microstructure in metal alloys and polymers, volume changes (expansion and contraction), and changes in mechanical behavior. Chemical changes include reactions to form new products, oxidation, corrosion, decomposition, dehydration, chemisorption, and the like. • These physical and chemical changes take place over a wide temperature range. Materials are used over a wide range of temperatures • It is necessary to characterize materials and their behavior over a range of temperatures to determine what materials are suitable for specific uses and to determine what temperature range materials or chemicals can withstand without changing. • This sort of information is used to predict safe operating conditions for products, such as which type of tire material is best for vehicles in extremely cold or extremely hot climates, the average expected lifetime of materials such as paints and polymers exposed to temperature changes.
 Ø DTG (Derivative Thermal")
Ø Types of thermal analysis Ø TGA (Thermal Gravimetric Analysis) Ø DTG (Derivative Thermal Gravimetric Analysis) Ø DTA (Differential Thermal analysis) Ø DSC (Differential Scanning calorimetry)
 Principle: In thermal gravimetric analysis, the sample is heated in")
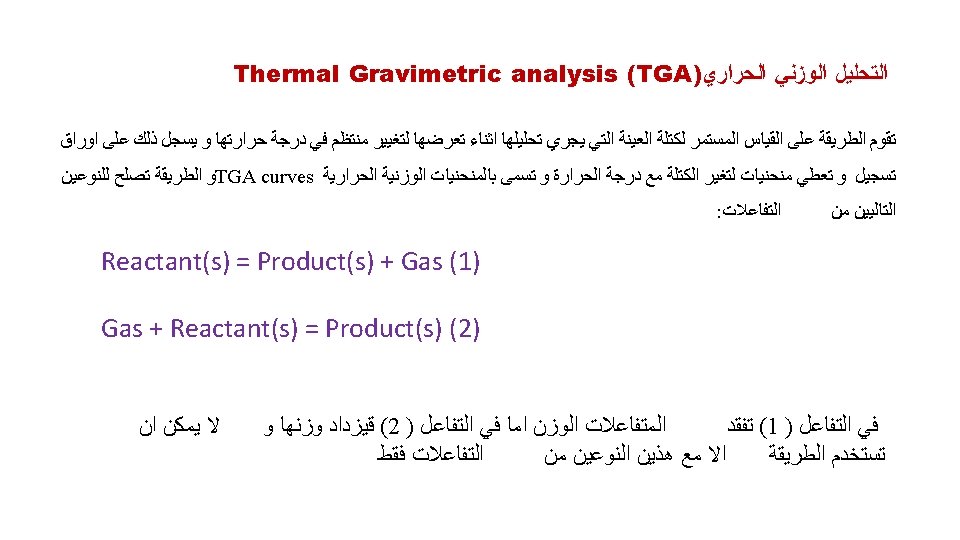
Thermal Gravimetric analysis (TGA) Principle: In thermal gravimetric analysis, the sample is heated in a given environment (Air, N 2, CO 2, He, Ar etc. ) at controlled rate. The change in the weight of the substance is recorded as a function of temperature or time. The temperature is increased at a constant rate for a known initial weight of the substance and the changes in weights are recorded as a function of temperature at different time interval. This plot of weight change against temperature is called thermal gravimetric curve or thermogram.

Example: TGA Curve for Ag. NO 3 • The horizontal portion of the curve indicates that, there is no change in weight (a b & c d) and the portion BC indicates that there is weight change. • The weight of the substance (Ag. NO 3) remains constant up to a temperature of 473°C indicating that Ag. NO 3 is thermally stable up to a temperature of 473°C. • At this temperature it starts losing its weight and this indicates that the decomposition starts at this temperature. It decomposes to NO 2, O 2 and Ag. The loss in weight continues up to 608°C leaving metallic silver as the stable residue. Beyond this temperature the weight of the sample remains constant (c d) TGA • Constant Heating Rate – Initial Temp – Final Temp – Heating Rate (°C/min) • Data – Weight vs Time – Weight vs Temp.
")
Example TGA of calcium oxalate monohydrate (Ca. C 2 O 4. H 2 O) • The successive plateau corresponds to the formation of anhydrous salt, calcium carbonate and calcium oxide. (a) Ca. C 2 O 4. H 2 O → Ca. C 2 O 4 + H 2 O (b) Ca. C 2 O 4 → Ca. CO 3 + CO (c) Ca. CO 3 → Ca. O + CO 2 • The thermogram indicates that the loss of water begins at 100°C and loss of CO at 450°C and CO 2 at 600°C
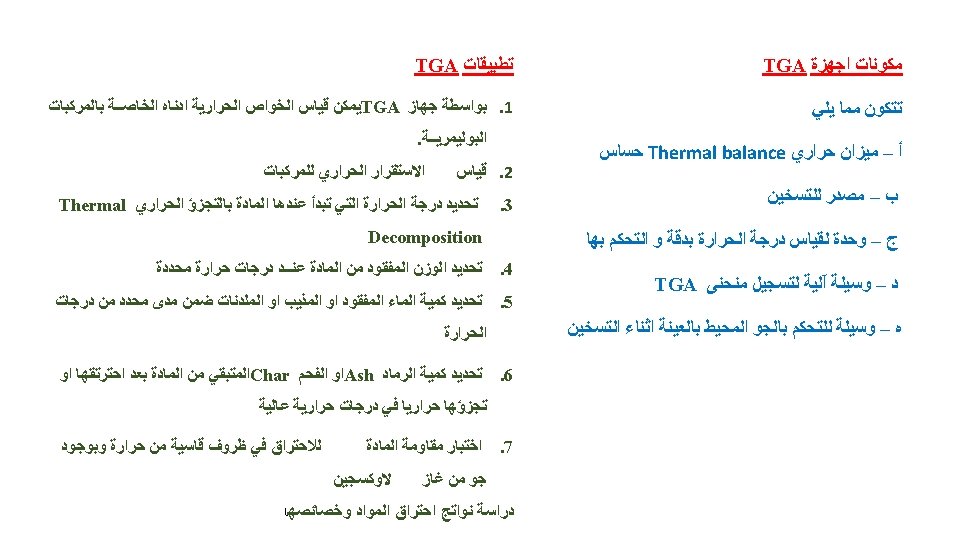

Factors affecting the TG curve The factors which may affect the TGA curves are classified into two main groups. (1) Instrumental factors (a) Furnace heating rate ﻣﻌﺪﻝ ﺗﺴﺨﻴﻦ ﺍﻟﻔﺮﻥ (b) Furnace atmosphere ﺍﻟﺠﻮ ﺍﻟﺪﺍﺧﻠﻲ ﻟﻠﻔﺮﻥ (c) Furnace shape ﺍﻻﺑﻌﺎﺩ ﺍﻟﻬﻨﺪﺳﻴﺔ ﻟﻠﻔﺮﻥ (E) Sensitivity of recording devices and response speed ﺣﺴﺎﺳﻴﺔ ﺍﺟﻬﺰﺓ ﺍﻟﺘﺴﺠﻴﻞ ﺍﻻﺳﺘﺠﺎﺑﺔ ﻭﺳﺮﻋﺔ (2) Sample characteristics includes (a) Weight of the sample (b) Sample particle size ﺣﺠﻢ ﺩﻗﺎﺋﻖ ﺍﻟﻌﻴﻨﺔ ﻫﻞ ﻫﻲ ﺑﻠﻮﺭﻳﺔ ﺍﻭ ﺑﺸﻜﻞ ﻣﺴﺤﻮﻕ (c ) Reaction temperature ﺣﺮﺍﺭﺓ ﺍﻟﺘﻔﺎﻋﻞ (d) Thermal conductivity ﻗﺎﺑﻠﻴﺔ ﺍﻟﺘﻮﺻﻴﻞ ﺍﻟﺤﺮﺍﺭﻱ ﻟﻠﻤﺎﺩﺓ
- Slides: 9