Theory of the Firm 1 How a firm
 How a firm makes costminimizing production decisions. •")


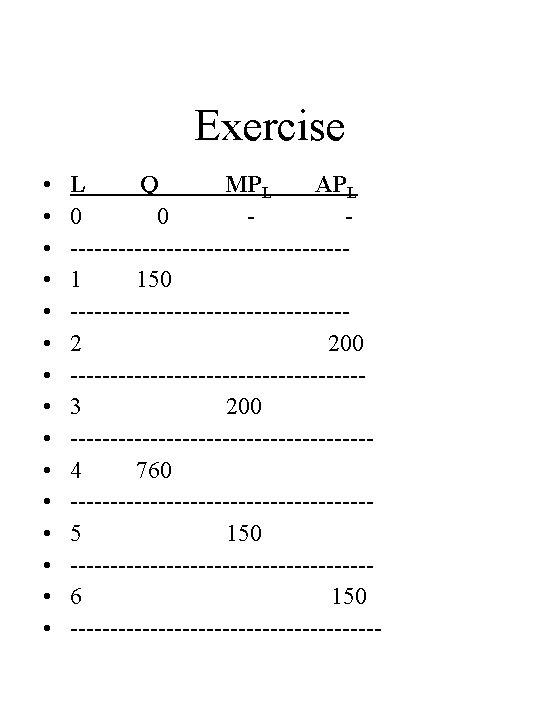
 from (a). • APL")


 • Long run concept: by how much does Q when")

- Slides: 15
Theory of the Firm • 1) How a firm makes costminimizing production decisions. • 2) How its costs vary with output. • Chapter 6: Production: How to combine inputs to produce output • Chapter 7: Costs of Production • Chapter 8: Firm’s profitmaximizing decision in a competitive industry
Chapter 6: Production • Production technology: how firms combine inputs to get output. • Inputs: also called factors of production • Production Function: math expression that shows how inputs combined to produce output. • Q = F (K, L) – Q = output – K = capital – L = labor
Production Function • Production function: Q, K, and L measured over certain time period, so all three are flows. • Production function represents: – 1) specific fixed state of technology – 2) efficient production • Short Run versus Long Run: – SR: one input is fixed. – Typically: K is fixed in the short run so can only Q by L. – LR: both inputs variable.
Production Terminology • Product: same as output • Total product of labor = TPL • As L Q , first by a lot, then less so, then Q will • Marginal product of labor: – MPL = TP/ L = Q/ L – additional output from adding one unit of L – See Table 6. 1 and Figure 6. 1 • Average product of labor: – APL = TP/L = Q/L – Output per unit of labor
To Note About Figure 6. 1 • Can derive (b) from (a). • APL at a specific amount of L: slope of line from origin to that specific point on TPL • MPL for specific amount of L: slope of line tangent to TPL at that point. • Note specific points in (a) and (b). • MPL hits APL: – 1) at the max point on APL – 2) from above.
Law of Diminishing Returns • Given existing technology, with K fixed, as keep adding one additional worker: at some point, the to TP from the one unit L will start to fall. • I. e. , MPL curve slopes upward for awhile, then slopes downward, eventually dropping below zero. • Assumes each unit of L is identical (constant quality). • Consider technological improvement: See Figure 6. 2.
Labor Productivity and Standard of Living • Labor productivity: – APL for an entire industry or for the economy as a whole. – One linkage between micro and macro. – Determines real standard of living for a country. • Background: Aggregate value of all produced = payments all factors of production, including labor. Consumers receive these factor payments in form of wages, etc. – So, consumers in aggregate can rate of consumption in LR only by total amount they produce. – How increase? • By increasing stock of K • By technological improvements. • International Trends (Table 6. 3)
Long Run • Long Run: both K and L variable • See Table 6. 4: shows different output levels associated with different amounts of K and L. • Isoquant (‘iso’ means same): curve that shows all possible combinations of inputs that yields the same output (shows flexibility in production). • Isoquant: shows how K and L can be substituted to produce same output level. – Shows input flexibility. – See Figure 6. 4.
Continue with LR • Can relate shape of isoquant to the Law of Diminishing Marginal Returns. • Marginal Rate of Technical Substitution (MRTS): – (1) Shape of isoquant. – (2) Shows amount by which K can be reduced when one extra unit of L is added, so that Q remains constant. – (3) MRTS as move down curve • Diminishing MRTS.
More on Isoquant • Isoquant curve: shows how production function permits trade-offs between K and L for fixed Q. • MRTS = - K/ L fixed Q • Isoquants are convex. • Much of this comparable to indifference curve analysis. • See Figure 6. 5.
Derive Alternative Expression for MRTS • As move down an isoquant, Q stays fixed but both K and L . • As L: additional Q from that extra L = MPL * L • As K: reduction in Q from K = MPK * - K. • These two sum to zero. • MPL* L + MPK * - K = 0. • MPL/MPK = - K/ L = MRTS. • MRTS = ratio of marginal products.
Two Special Cases of Production Functions • MRTS is a constant (I. e. , isoquant is a straight line) – Perfect substitutes • MRTS = 0: – Fixed proportion production function – Only “corner” points relevant. • See Figures 6. 6 and 6. 7.
Returns to Scale (RTS) • Long run concept: by how much does Q when inputs in proportion? • Or: if double inputs, by how much does Q change? • 1) Increasing RTS: if double inputs more than double Q – Production advantage to large firm. • 2) Constant RTS: if double inputs double Q. • 3) Decreasing RTS: if double inputs less than double Q. • See Figure 6. 9
Exercise • • Input Output L K Combo A 100 20 40 B 250 40 80 C 600 90 180 D 810 126 252 A) Calculate % in each of K, L, and Q in moving from A B, B C, and C D. • B) Are there increasing, decreasing or constant returns to scale between A and B? B and C? C and D?