THEORY CONSTRUCTION 10 Levels of analysis 1 Overview


 A ‘Bottom-up’ causal path C D Meso-level (Organisations, groups) B")


 A ‘Bottom-up’ causal path C D ‘Top-down’ causal path Meso-level")


 A ‘Bottom-up’ causal path C D ‘Top-down’ causal path Meso-level")
 “Welfare states, solidarity")


 data, but draw conclusions about")


- Slides: 40
THEORY CONSTRUCTION 10. Levels of analysis 1
Overview ■ Introduction: multiple levels of analysis ■ Fallacies in reasoning ■ Shifting between levels 2
Important cross-national variation in beliefs about poverty and support for redistribution (source: Alesina & Glaeser, 2004, on the basis of World Value Survey, 1983 -97) Belief VS 29% EU 60% ‘believe that luck determines income’ 30% 54% ‘Believe that the poor are lazy’ 60% 26% ‘believe that the poor are trapped in poverty’
Social research is situated on different levels ■ Sociological analysis implies theoretical assumptions and assertions about causal factors at different levels of analysis, for instance: – The attitudes of individuals towards the welfare state are shaped by a broader macro-context (Example: EU/US) as well as (aggregated) individual features (e. g. education level, income, etc. ) – In the organizations (meso-level) that shape the design and effectivity of social policies – and, arguably, also shape the attitudes of people. – Example: Kohli’s Power Resources Theory stating that “working class power achieved through the organization I the form of labor unions or left parties, which produces more egalitarian distributional outcomes”).
Social research is situated on different levels ■ Levels of analysis: the level in which explanations are situated. – Macro: structure of society (the highest level) ■ e. g. inequality, democracy, immigration, diversity, economic development, functional differentiation, … – Meso: institutions, organisations and networks (the moderate level) ■ e. g. political parties competing for power, social networks of employers, horizontal vs hierarchical organisations, cooperative vs competitive organisational cultures, concentration vs mixed schools. – Micro: individuals and interactions (the lowest level) ■ E. g. individual beliefs about politics, abortion, immigration ■ E. g. individual behaviour: lifestyle, consumption, ■ E. g. individual interaction: encountering strangers, interactions between friends 5
Thinking about different levels of analysis: Aims ■ Provide clarity about units and levels of analysis: what are the main levels of analysis in the social sciences or in social research? ■ Provide some tools and instruments to think about research in multi-level contexts and interpret data across different levels of analysis. ■ Learn to think more systematically about the main problems when one attempts to explain across different levels of analysis?
e. g. Obesitas ■ Can be studied on different levels ■ E. g. why are some persons obese, rather than others? – Can be explained by lifestyle: smoking, drinking, too little exercise – Or by (genetic) medical conditions, or hormones. . – Micro explanations for micro variance 7
USA, Obesity by state
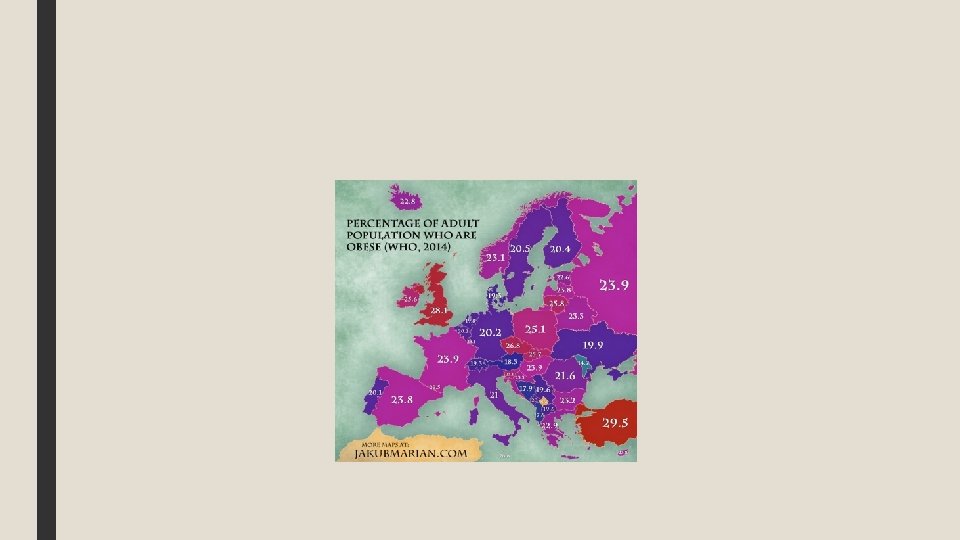
World map of Obesity
Exercise: think-pair-share ■ Obesity is a significant health and social problem which has reached pandemic levels worldwide. ■ Prevention and treatment of obesity has focused on pharmacological, educational, and behavioral interventions (‘life style problem’), with limited overall success ■ While it is accepted obesity is influenced by genetic and behavioral factors, the meso-level and macro-level influences have yet to be fully explored.
e. g. ■ E. g. why do some states count more obese people Obesities than others? – Socio-economic development of the neighborhoods, segregation, access to local health care, low levels of social trust, low levels of social interaction. – You can look at population differences (more poor people, more lowly educated, level of inequality, local labour market composition, etc. ), state institutions (local health care systems, food regulations, …), infrastructure (biking, sports, etc. ), – Similar for comparing obesity in cities/countryside, regions, … – Meso explanation for meso variance. 12
e. g. Obesities ■ E. g. Why do the US count more people with obesities than Europe? – You can look at national characteristics: welfare system, level of inequality, level of economic development, racial inequality, … – Macro explanation for macro variance 13
14
e. g. Obesities ■ All of these levels of explanations can be adequate – Yet social scientists generally concentrate on meso and macro explanations – Not because those levels are inherently more important, but because that’s the contribution social scientists make (as compared to, for instance, psychology, biology, neurosciences, …) ■ “Keeping our levels straight” (Pettigrew): the best way to examine causal relations is by making sure your explanandum (dependent variables) is of the same level as your explanans (independent variables) – Explaining why some people are obese micro explanations – Explaining why obesities is a bigger problem in this neighborhood meso explanations – Explaining why obesities is a bigger problem in this country macro explanations 15
e. g. Obesities ■ However: social scientists also use multilevel analysis. ■ In other words: three strategies for dealing with multiple levels – Staying within the same level of analysis (Pettigrew) – Multilevel top-down: explaining micro by meso/macro (or meso by macro) – Multilevel Bottom-up: explaining macro by micro/meso (or meso by micro) ■ However: it’s easier to make mistakes in reasoning with the latter three… (see the fallacies later on) 16
Macro-level (Social structures ) A ‘Bottom-up’ causal path C D Meso-level (Organisations, groups) B Micro-level (individual level, face –to - face interaction) F ‘Top-down’ causal path E
e. g. Obesities: top-down explanations ■ Macro explanation: high level of inequality, weak regulation in food markets, etc. ■ Meso explanations: ■ Neighborhood and community characteristics (level of residential segregation, etc. ) ■ Access to health care and social services ■ “Causal asymmetry”: looking for statistical explanations, you will probably find a stronger covariance by the macro-level. 18
E. g. Obesities: bottom-up explanations ■ Contribution from microsociology: examining the micro-foundations of macro-social patterns – E. g. by analyzing how particular individuals develop obesities, researchers can analyze the causal mechanisms leading individuals to become obese ■ e. g. through lifestyles, subcultures, lack of access to health care, low income, different media routines, neighborhoods, … – Strictly speaking: this is closer to what is logically considered to be “causality”: you explain events by other specific events ■ National levels of inequality only have an impact because they influence how specific individuals, on the micro-level, have less access to health care, income, adequate information, expensive healthy food, and/or develop specific subcultures of unhealthy lifestyles, … 19
Shifting between levels ■ However: you can shift between those levels (e. g. macro explanations for individual behavior). ■ But then you have to work out the causal mechanisms in between these levels: demonstrate how one level (macro) has an influence on another level (meso). ■ In any case: always reflect about how your phenomenon can be explained by factors/mechanisms on multiple levels! 20
Shifting between levels ■ E. g. If you lose your job, you can’t simply blame it on the global rise of “neoliberalisation” ■ You can only do that if you can point to the causal mechanisms operating between these variables: – You lose your job as a social worker because your social organization has lost part of its funding. – This loss of funding is due to your national government’s policy of austerity cuts. – Your national government was forced or convinced to conduct such austerity policies by institutions like IMF and WTO, embodying a neoliberal ideology spread around the globe. 21
Different causal paths ■ Pettigrew, How to think like a social scientist, pp 116 -21. ■ Micro ( Meso) Macro ■ Macro ( Meso) Micro ■ However: – Pettigrew (a social psychologist) interprets the “meso” level somewhat problematically as interactions between individuals, whereas most sociologists use “meso” to refer to institutions, organizations, and networks. – Micro to Macro / Macro to Micro is (nearly) always mediated by meso dynamics 22
Macro-level (Social structures ) A ‘Bottom-up’ causal path C D ‘Top-down’ causal path Meso-level (Organisations, groups) B Micro-level (individual level, face –to - face interaction) F E
1. Micro Meso Macro ■ E. g. Weber’s The protestant ethic and the spirit of capitalism – Pioneering Protestants like Luther and Calvin emphasized the values of frugality (savings/thrift) and a disciplined working ethic. They claimed that people needed to prepare themselves for God’s final judgment. – This ultimately fed into economic success for many Protestants, because these values (and practices) were crucial in running small businesses, and accumulating capital (without immediately spending it). – Hence the rise of capitalism. 24
1. Micro Meso Macro ■ E. g. Weber’s The protestant ethic and the spirit of capitalism ■ Later researchers refined this theory by making explicit how micro and meso factors led to macro changes – E. g. Protestant values created child-training practices in which children were socialized with a high need for social achievement. This need is challenged and satisfied by operating small business (striving for individual success by working hard). 25
Macro-level (Social structures ) A ‘Bottom-up’ causal path C D ‘Top-down’ causal path Meso-level (Organisations, groups) B Micro-level (individual level, face –to - face interaction) F E
2. Macro Meso Micro ■ Arts W. & Gelissen J. (2001) “Welfare states, solidarity and justice principles: does the type really matter? ” in: Acta Sociologica, 44(4), 283 -299. ■ Want to explain how people think about solidarity and justice in the welfare state (individual level) ■ Explain that by the welfare state of which they are part (macro level) 27
2. Macro Meso Micro ■ Types of welfare states – Liberal: equal opportunity and individual equity ■ ■ People themselves are first and foremost responsible for their own welfare Social support only for deserving poor – Social-democratic: strongly redistributive ■ E. g. providing affordable housing, guaranteeing minimum income, … – Conservative: equity, designed to reproduce status differentials ■ E. g. people accumulate rights by working – Southern-European: immature, poorer welfare states ■ ■ Strong solidarity But: more dependence on family and social networks 28
2. Macro Meso Micro ■ People’s preferences on “solidarity”: whether it is the government’s responsibility to – Provide a job for everybody who wants one – Provide health care for the sick – Provide a decent standard of living for the unemployed – Reduce income differences between the rich and the poor – Give financial help to college students from low-income families – Provide decent housing for those who can’t afford it 29
2. Macro Meso Micro The model Mediating mechanisms: Learning: people grow accostumed to what type of social policies are “normal”. Framing: how people (media, politicians, audience) talk about government support 30
2. Macro Meso Micro ■ Some results: the type of welfare state regime does indeed matter for people’s notions of solidarity and justice – Citizens of social-democratic welfare states are significantly more in favour of social rights by government than citizens of liberal and conservative welfare states – The type of welfare regime explains 0. 24% of the variance between individuals’ preferences, whereas individual factors only account for 0. 09% 31
Overview ■ Introduction: multiple levels of analysis ■ Shifting between levels ■ Fallacies in reasoning 32
Fallacies in reasoning ■ A great deal of social research uses aggregated individual data – E. g. information on individuals’ trust in politics: if you want to compare levels of trust between countries, you will probably work with average scores of trust per nationality. ■ However: from these aggregated data you can’t draw any conclusions on either individuals or social groups… – E. g. if there is lower political trust in Germany than in the UK, you can’t make statements about any particular person – E. g. aggregated individual do not tell you anything about how political parties might work with each other in that country. Trust in politics may be, for instance, very low in Germany, but at the same time political parties may be strongly cooperative towards one another 33
Fallacies in reasoning ■ Two types of fallacies: – Compositional fallacy – Ecological fallacy 34
Compositional fallacy ■ When you only have micro-level (individual) data, but draw conclusions about organizations, institutions or networks (meso) or national societies (macro). ■ This is a fallacy, because “the whole is greater than the sum of its parts” (Aristotle): – These meso and macro levels have their own properties, and social scientists often focus primarily on these meso and macro levels. – You cannot assume that the characteristics of an individual element can be equally applied to the whole 35
Compositional fallacy ■ E. g. political discourse on poverty: – Just because she escaped from poverty by working hard, does not mean that working hard (individually) will solve inequality (societally). There are structural, social causes of inequality and poverty, some of which only few individuals can surpass. Even though it is principally possible for each person to escape poverty. – In other words: by generalizing from individual cases, so it is unlikely that you can find a solution for solving poverty on a national level. 36
Ecological fallacy ■ Drawing conclusions about individuals when you only have meso, macro or aggregated data. This is a problem because macro units are too large to represent individual differences within the unit. ■ E. g. stating that a person must be a bad teacher, because he is working at a school with a really bad reputation. ■ E. g. persons from a poorer background, have lower chances of acquiring a university degree. The statement that “this person will not be able to acquire such a degree” contains an ecological fallacy. 37
Ecological fallacy ■ E. g. positive correlation between mineworkers in a UK region and regional number of suicides. – Policy-makers concluded that miners had a higher suicide risk. – Yet the analysis of individual-level data made clear that it were especially farmers in mining regions that had higher suicide rates… 38
Summing up… ■ Always reflect on the different levels and units of analysis you are using in your research ■ Two types of common mistakes – Compositional fallacy: statements on societies or organisations by drawing on individual data – Ecological fallacy: statements on individuals and organisations by drawing on macro data ■ You can avoid these mistakes in two ways: – “Keeping your levels straight” – Shifting between levels by explicating the causal connections between levels 39
Instructions for Assignment 3 ■ Deadline December 23 rd, 2019. ■ The intended length of the assignment is 2300 to 3000 words. It is graded out of 20 and Late submissions receive a reduction of 1 out of 15, repeated for every extra week of delay. ■ But, as always: quality above quantity. You are advised to write in Dutch, unless you feel sufficiently proficient in English. 40