The Worlds First Triple Nested HF Radar Test

 System Performance in Varied Environments • • Based upon the")


 • Originally developed for")


 Required on vessels of: • 300 gross tonnage or greater,")


- Slides: 35
The World’s First Triple Nested HF Radar Test Bed for Current Mapping and Ship Detection Hugh Roarty Scott Glenn Josh Kohut Rutgers University Don Barrick Pam Kung CODAR Ocean Sensors
FUTURE WORK (ROW 4) System Performance in Varied Environments • • Based upon the shown work, optimal settings have been set at all long-range sites for multi-static dual use operations Now focusing on a long term data set , M/V Oleander sails New York to Bermuda on a weekly basis providing ship tracking opportunities while the network continues to provide surface current maps to the Coast Guard for Search & Rescue Demonstrations. Multiple Frequencies • Sandy Hook: 5, 13 and 25 MHz Multiple Sites • Sandy Hook • Loveladies • Tuckerton & • Wildwood
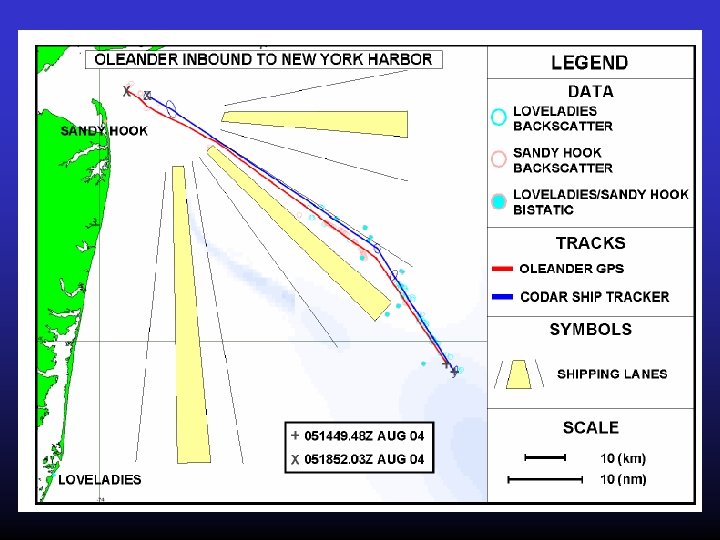
Ship Tracking Throughout Rutgers HF Radar Network
60 Transits of Oleander in 2005
New Jersey Installations Used for Oleander Tests 5 MHz Sandy Hook , NJ 5 MHz Loveladies, NJ
Detection Algorithm • Simultaneous multiple sliding window FFTs in Doppler processing • Two types of background calculation --- median and IIR • 3 D background (Time, Range and Doppler) varying with sea echoes • Thresholding of peaks --- local SNR of monopole or at least one of the two dipole antennas have to be above the threshold • MUSIC algorithm used to determine bearing • Bearing precision determined by SNR (~1/sqrt(SNR))
Oleander Detections 128 point FFT 6 d. B Threshold 256 point FFT 512 point FFT 7 d. B Threshold 8 d. B Threshold
Ship Tracking Algorithm • A Kalman Filter provides a recursive solution to the least squares problem. • Assumptions include linear target motion and normally distributed measurement errors. • Tracker inputs are time; radar transmitter and receiver positions; range, bearing, and range rate; and range, bearing, and range rate uncertainties. • Tracker outputs are target position; velocity; and estimates of position and velocity uncertainties (covariance matrix). • Target Maneuver Test: a statistical test is used to estimate whether a combination of two straight tracks fit the data better than a single straight track. Oleander Constant Course and Speed Tracker Solution Using CODAR Detections from 23 November 2002
Pepper Plots • All targets detected 9 d. B above background
Present Focus • Hardware Improvements – 13 MHz Codar Sea. Sonde, December 2004 – 13 MHz Codar Superdirective System, July 2005 • Software Improvements – SIFTER Algorithm
Sandy Hook Facility March 2004 5 MHz Rx 5 MHz Tx Continuous Operation Since July 2001
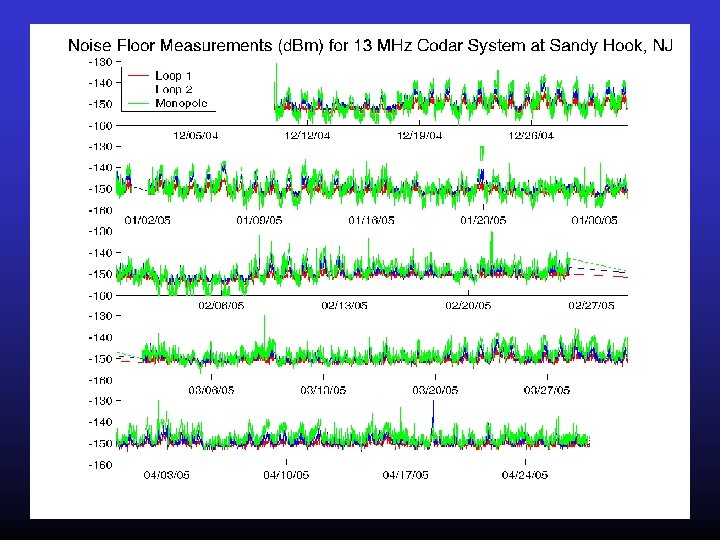
Sandy Hook Test Bed Present Day • 25 MHz system installed March 2004 5 MHz Rx 5 MHz Tx 13 MHz Rx 25 MHz Tx/Rx 13 MHz Tx • 5 MHz Transmit Antenna moved 1 wavelength back from shoreline • 13 MHz System Installed December 2004
5 MHz Rx 25 MHz Tx/Rx 13 MHz Tx 13 MHz Rx 5 MHz Tx
Three Frequency Coverage • 5 MHz • 13 MHz • 25 MHz
How did the move of the Transmit Antenna Affect Radial 5 MHz Rx Coverage? 5 MHz Tx
5 MHz Transmit Antenna Move BEFORE Radial Distribution November 2004 AFTER Radial Distribution April 2005
5 & 13 MHz Receive Antennas in “Cluttered” Environment
5 MHz HOOK Pattern Measurement
Simulated Bearing Error with Added Bias from Improper Antenna Pattern Compared with Real Ship Bearing Data For Simulation: Measured distorted pattern inputted Ideal pattern used to recover echo Expected power-law fit is offset by 16° Ship is also offset when inappropriate ideal pattern is used
Simulated Bearing Error with Distorted, Measured Antenna Patterns Compared with Real Ship Bearing Data Simulated points follow power law: s. B = 36. 4 0. 67 SN R Compared to: 40 s. B = 0. 5 SN R Ship detections at lower SNRs may differ because: Noise peaks are mis-identified as ships "Noise" near peak contains ship signal, i. e. , it is too high
13 MHz HOMR Pattern Measurement Radial Distribution
25 MHz System in Clear Environment
25 MHz HOSR Pattern Measurement Radial Distribution
Sandy Hook Test Bed 13 MHz Super. Directive 5 MHz Rx Future • 13 MHz Super. Directive System Installation July 2005 5 MHz Tx 13 MHz Rx 25 MHz Tx/Rx 13 MHz Tx
Super. Directive System 13 -MHz Heptagonal Array Being Built and Tested at CODAR • • • 23 -foot (7 -m) high mast 9 -foot (3 -m) arms 8 -foot (2. 7 -m) dipoles 2 masts ~21 d. B directivity over ground -32 d. B efficiency
Super. Directive Beam Patterns 360 degree coverage • Blue curve is theoretical pattern for 7 -element array • Red results from use of measured transponder pattern
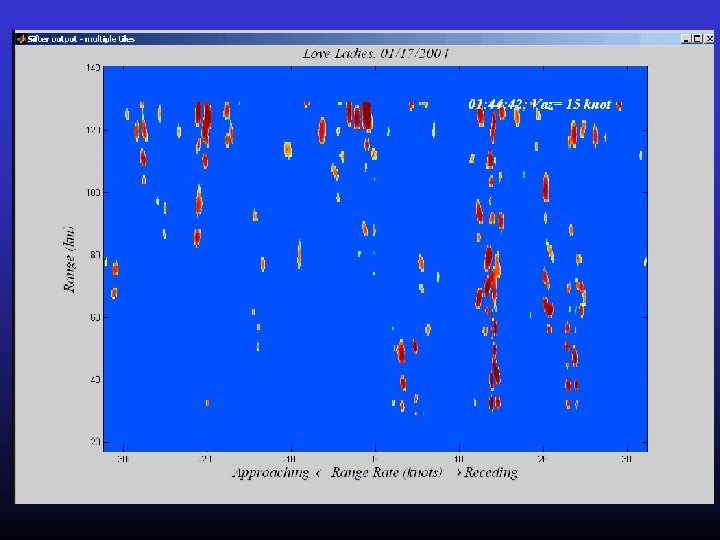
IGNAL NVERSION OR • Developed by Mission Research Corporation (MRC) • Originally developed for ROTHR (Relocatable Over The Horizon Radar) • SIFTER rejects peaks that do not SIFTER move in a consistent way ARGET XTRACTION & EGISTRATION • SIFTER finds “smoothest” SIFTER distribution of scatterers that reproduces HFSWR or ROTHR measurements • Targets appear as localized peaks
SIFTER Results
Future Work • Utilize AIS signal to ground truth multiple ship tracks • New and Different Targets
Automatic Identification System (AIS) Required on vessels of: • 300 gross tonnage or greater, • Length Over All (LOA) over 20 meters, or • carries more than 50 passengers for hire
87’ Coastal Patrol Boat 177’ R/V Oceanus 32’ Go-Fast Boat 135’ R/V Cape Hatteras 47’ Motor Lifeboat
GPS Track of RV Cape Hatteras during LATTE 2005