
The Use of Passive Integrated Transponder PIT Tags



- Slides: 33
The Use of Passive Integrated Transponder (PIT) Tags as a Tool to Monitor and Manage Steelhead John Cassinelli Carl Stiefel Regional Fisheries Biologists Idaho Department of Fish and Game LSRCP Program Review Clarkston, Washington June 20 th and 21 st, 2012
Brief History • PIT tags came on the market in 1987 and PTAGIS was implemented in 1991
Brief History • PIT tags came on the market in 1987 and PTAGIS was implemented in 1991 • Through 1990’s and early 2000’s, PIT tags were mainly used to assess juvenile survival – Some exceptions like the CSS study
Brief History • PIT tags came on the market in 1987 and PTAGIS was implemented in 1991 • Through 1990’s and early 2000’s, PIT tags were mainly used to assess juvenile survival – Some exceptions like the CSS study • In more recent years, PIT tags have been more readily used in evaluating returning adult numbers and behavior
Current PIT Tag Uses in Steelhead
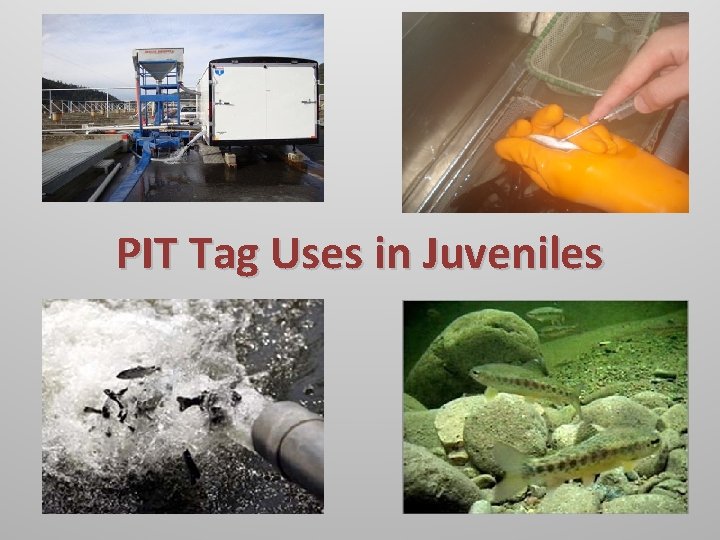
PIT Tag Uses in Juveniles
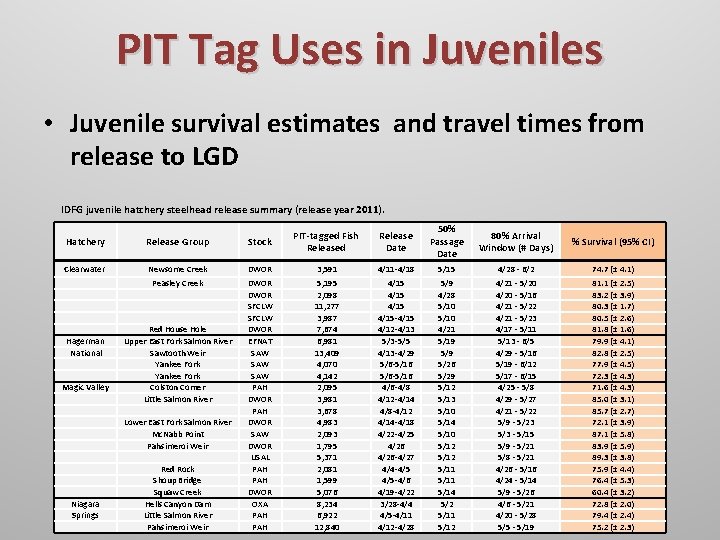
PIT Tag Uses in Juveniles • Juvenile survival estimates and travel times from release to LGD IDFG juvenile hatchery steelhead release summary (release year 2011). Hatchery Release Group Stock PIT-tagged Fish Released Release Date 50% Passage Date 80% Arrival Window (# Days) % Survival (95% CI) Clearwater Newsome Creek DWOR 3, 591 4/11 -4/18 5/15 4/28 - 6/2 74. 7 (± 4. 1) Hagerman National Magic Valley Niagara Springs Peasley Creek Red House Hole Upper East Fork Salmon River Sawtooth Weir Yankee Fork Colston Corner Little Salmon River Lower East Fork Salmon River Mc. Nabb Point Pahsimeroi Weir Red Rock Shoup Bridge Squaw Creek Hells Canyon Dam Little Salmon River Pahsimeroi Weir DWOR SFCLW DWOR EFNAT SAW SAW PAH DWOR SAW DWOR USAL PAH DWOR OXA PAH 5, 195 2, 098 11, 277 3, 987 7, 674 6, 981 13, 409 4, 070 4, 142 2, 095 3, 981 3, 678 4, 983 2, 093 1, 795 5, 371 2, 081 1, 599 5, 076 8, 234 6, 922 12, 840 4/15 -4/15 4/12 -4/13 5/3 -5/5 4/13 -4/29 5/6 -5/16 4/6 -4/8 4/12 -4/14 4/8 -4/12 4/14 -4/18 4/22 -4/25 4/26 -4/27 4/4 -4/5 4/5 -4/6 4/19 -4/22 3/28 -4/4 4/5 -4/11 4/12 -4/28 5/9 4/28 5/10 4/21 5/19 5/26 5/29 5/12 5/13 5/10 5/14 5/10 5/12 5/11 5/14 5/2 5/11 5/12 4/21 - 5/20 4/20 - 5/16 4/21 - 5/22 4/21 - 5/23 4/17 - 5/11 5/13 - 6/5 4/29 - 5/16 5/19 - 6/12 5/17 - 6/15 4/25 - 5/8 4/29 - 5/27 4/21 - 5/22 5/9 - 5/23 5/3 - 5/15 5/9 - 5/21 5/8 - 5/21 4/26 - 5/16 4/24 - 5/14 5/9 - 5/26 4/6 - 5/21 4/20 - 5/28 5/5 - 5/19 81. 1 (± 2. 5) 83. 2 (± 3. 9) 80. 3 (± 1. 7) 80. 5 (± 2. 6) 81. 8 (± 1. 6) 79. 9 (± 4. 1) 82. 8 (± 2. 5) 77. 9 (± 4. 5) 72. 3 (± 4. 3) 71. 6 (± 4. 3) 85. 0 (± 3. 1) 85. 7 (± 2. 7) 72. 1 (± 3. 9) 87. 1 (± 5. 8) 83. 9 (± 5. 9) 89. 3 (± 3. 8) 75. 9 (± 4. 4) 76. 4 (± 5. 3) 60. 4 (± 3. 2) 72. 8 (± 2. 0) 79. 4 (± 2. 4) 75. 2 (± 2. 3)
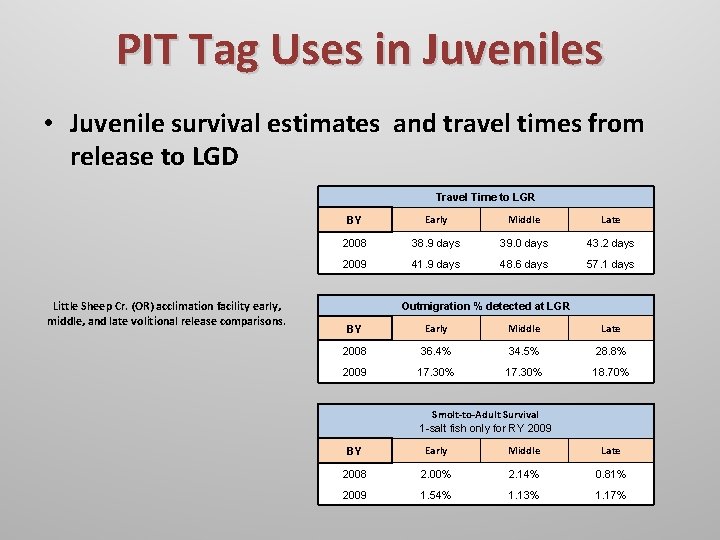
PIT Tag Uses in Juveniles • Juvenile survival estimates and travel times from release to LGD Travel Time to LGR Little Sheep Cr. (OR) acclimation facility early, middle, and late volitional release comparisons. BY Early Middle Late 2008 38. 9 days 39. 0 days 43. 2 days 2009 41. 9 days 48. 6 days 57. 1 days Outmigration % detected at LGR BY Early Middle Late 2008 36. 4% 34. 5% 28. 8% 2009 17. 30% 18. 70% Smolt-to-Adult Survival 1 -salt fish only for RY 2009 BY Early Middle Late 2008 2. 00% 2. 14% 0. 81% 2009 1. 54% 1. 13% 1. 17%
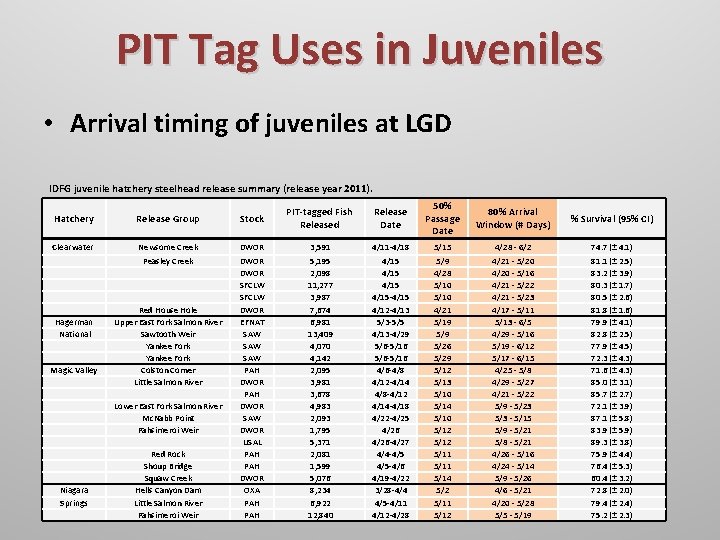
PIT Tag Uses in Juveniles • Arrival timing of juveniles at LGD IDFG juvenile hatchery steelhead release summary (release year 2011). Hatchery Release Group Stock PIT-tagged Fish Released Release Date 50% Passage Date 80% Arrival Window (# Days) % Survival (95% CI) Clearwater Newsome Creek DWOR 3, 591 4/11 -4/18 5/15 4/28 - 6/2 74. 7 (± 4. 1) Hagerman National Magic Valley Niagara Springs Peasley Creek Red House Hole Upper East Fork Salmon River Sawtooth Weir Yankee Fork Colston Corner Little Salmon River Lower East Fork Salmon River Mc. Nabb Point Pahsimeroi Weir Red Rock Shoup Bridge Squaw Creek Hells Canyon Dam Little Salmon River Pahsimeroi Weir DWOR SFCLW DWOR EFNAT SAW SAW PAH DWOR SAW DWOR USAL PAH DWOR OXA PAH 5, 195 2, 098 11, 277 3, 987 7, 674 6, 981 13, 409 4, 070 4, 142 2, 095 3, 981 3, 678 4, 983 2, 093 1, 795 5, 371 2, 081 1, 599 5, 076 8, 234 6, 922 12, 840 4/15 -4/15 4/12 -4/13 5/3 -5/5 4/13 -4/29 5/6 -5/16 4/6 -4/8 4/12 -4/14 4/8 -4/12 4/14 -4/18 4/22 -4/25 4/26 -4/27 4/4 -4/5 4/5 -4/6 4/19 -4/22 3/28 -4/4 4/5 -4/11 4/12 -4/28 5/9 4/28 5/10 4/21 5/19 5/26 5/29 5/12 5/13 5/10 5/14 5/10 5/12 5/11 5/14 5/2 5/11 5/12 4/21 - 5/20 4/20 - 5/16 4/21 - 5/22 4/21 - 5/23 4/17 - 5/11 5/13 - 6/5 4/29 - 5/16 5/19 - 6/12 5/17 - 6/15 4/25 - 5/8 4/29 - 5/27 4/21 - 5/22 5/9 - 5/23 5/3 - 5/15 5/9 - 5/21 5/8 - 5/21 4/26 - 5/16 4/24 - 5/14 5/9 - 5/26 4/6 - 5/21 4/20 - 5/28 5/5 - 5/19 81. 1 (± 2. 5) 83. 2 (± 3. 9) 80. 3 (± 1. 7) 80. 5 (± 2. 6) 81. 8 (± 1. 6) 79. 9 (± 4. 1) 82. 8 (± 2. 5) 77. 9 (± 4. 5) 72. 3 (± 4. 3) 71. 6 (± 4. 3) 85. 0 (± 3. 1) 85. 7 (± 2. 7) 72. 1 (± 3. 9) 87. 1 (± 5. 8) 83. 9 (± 5. 9) 89. 3 (± 3. 8) 75. 9 (± 4. 4) 76. 4 (± 5. 3) 60. 4 (± 3. 2) 72. 8 (± 2. 0) 79. 4 (± 2. 4) 75. 2 (± 2. 3)
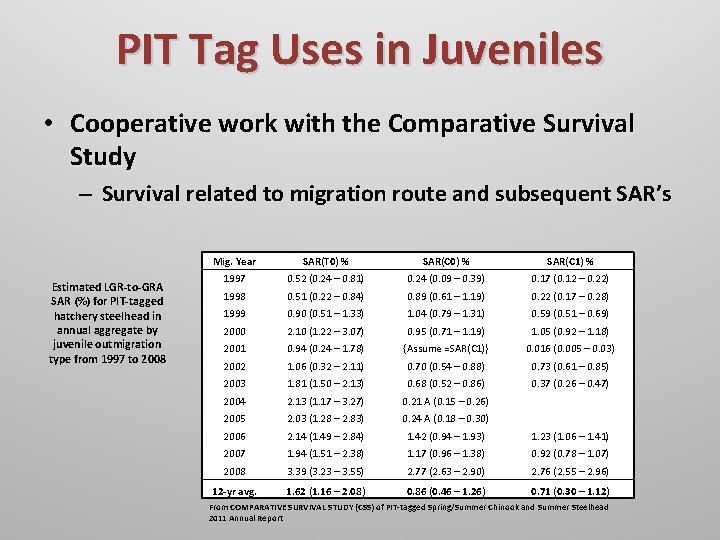
PIT Tag Uses in Juveniles • Cooperative work with the Comparative Survival Study – Survival related to migration route and subsequent SAR’s Estimated LGR-to-GRA SAR (%) for PIT-tagged hatchery steelhead in annual aggregate by juvenile outmigration type from 1997 to 2008 Mig. Year SAR(T 0) % SAR(C 1) % 1997 0. 52 (0. 24 – 0. 81) 0. 24 (0. 09 – 0. 39) 0. 17 (0. 12 – 0. 22) 1998 0. 51 (0. 22 – 0. 84) 0. 89 (0. 61 – 1. 19) 0. 22 (0. 17 – 0. 28) 1999 0. 90 (0. 51 – 1. 33) 1. 04 (0. 79 – 1. 31) 0. 59 (0. 51 – 0. 69) 2000 2. 10 (1. 22 – 3. 07) 0. 95 (0. 71 – 1. 19) 1. 05 (0. 92 – 1. 18) 2001 0. 94 (0. 24 – 1. 78) {Assume =SAR(C 1)} 0. 016 (0. 005 – 0. 03) 2002 1. 06 (0. 32 – 2. 11) 0. 70 (0. 54 – 0. 88) 0. 73 (0. 61 – 0. 85) 2003 1. 81 (1. 50 – 2. 13) 0. 68 (0. 52 – 0. 86) 0. 37 (0. 26 – 0. 47) 2004 2. 13 (1. 17 – 3. 27) 0. 21 A (0. 15 – 0. 26) 2005 2. 03 (1. 28 – 2. 83) 0. 24 A (0. 18 – 0. 30) 2006 2. 14 (1. 49 – 2. 84) 1. 42 (0. 94 – 1. 93) 1. 23 (1. 06 – 1. 41) 2007 1. 94 (1. 51 – 2. 38) 1. 17 (0. 96 – 1. 38) 0. 92 (0. 78 – 1. 07) 2008 3. 39 (3. 23 – 3. 55) 2. 77 (2. 63 – 2. 90) 2. 76 (2. 55 – 2. 96) 12 -yr avg. 1. 62 (1. 16 – 2. 08) 0. 86 (0. 46 – 1. 26) 0. 71 (0. 30 – 1. 12) From COMPARATIVE SURVIVAL STUDY (CSS) of PIT-tagged Spring/Summer Chinook and Summer Steelhead 2011 Annual Report
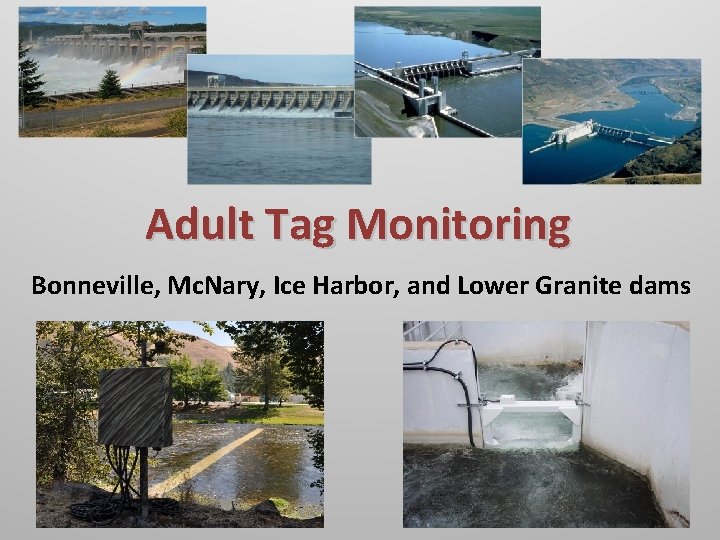
Adult Tag Monitoring Bonneville, Mc. Nary, Ice Harbor, and Lower Granite dams
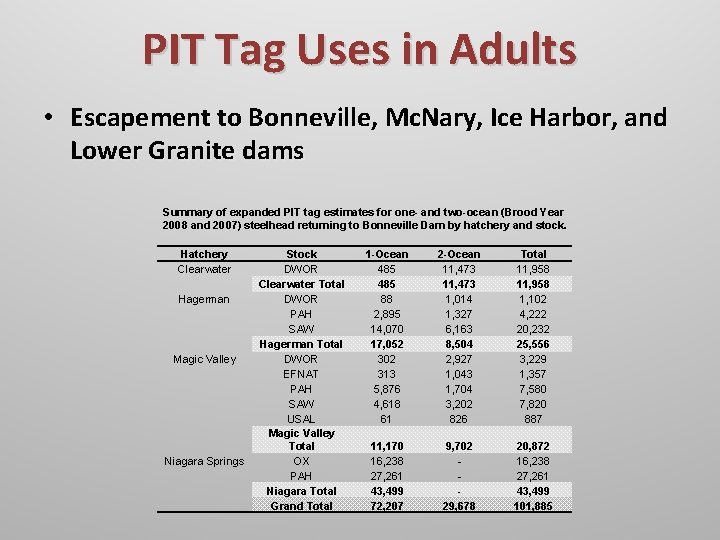
PIT Tag Uses in Adults • Escapement to Bonneville, Mc. Nary, Ice Harbor, and Lower Granite dams Summary of expanded PIT tag estimates for one- and two-ocean (Brood Year 2008 and 2007) steelhead returning to Bonneville Dam by hatchery and stock. Hatchery Clearwater Hagerman Magic Valley Niagara Springs Stock DWOR Clearwater Total DWOR PAH SAW Hagerman Total DWOR EFNAT PAH SAW USAL Magic Valley Total OX PAH Niagara Total Grand Total 1 -Ocean 485 88 2, 895 14, 070 17, 052 302 313 5, 876 4, 618 61 2 -Ocean 11, 473 1, 014 1, 327 6, 163 8, 504 2, 927 1, 043 1, 704 3, 202 826 Total 11, 958 1, 102 4, 222 20, 232 25, 556 3, 229 1, 357 7, 580 7, 820 887 11, 170 16, 238 27, 261 43, 499 72, 207 9, 702 29, 678 20, 872 16, 238 27, 261 43, 499 101, 885
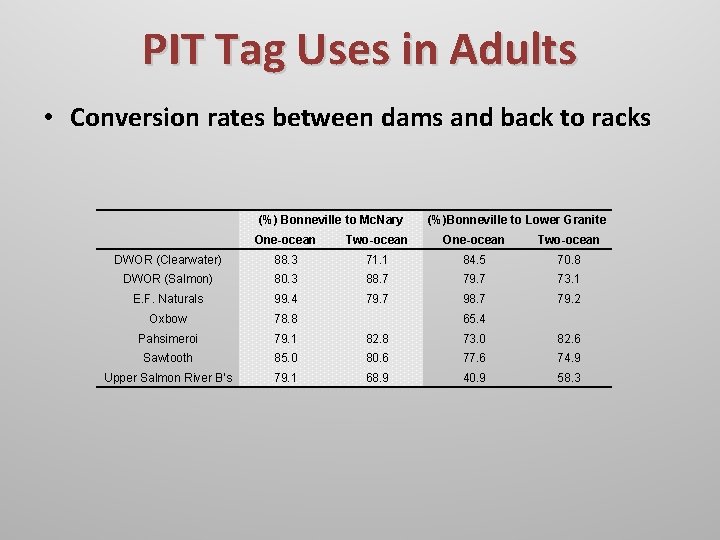
PIT Tag Uses in Adults • Conversion rates between dams and back to racks (%) Bonneville to Mc. Nary (%)Bonneville to Lower Granite One-ocean Two-ocean DWOR (Clearwater) 88. 3 71. 1 84. 5 70. 8 DWOR (Salmon) 80. 3 88. 7 79. 7 73. 1 E. F. Naturals 99. 4 79. 7 98. 7 79. 2 Oxbow 78. 8 Pahsimeroi 79. 1 82. 8 73. 0 82. 6 Sawtooth 85. 0 80. 6 77. 6 74. 9 Upper Salmon River B’s 79. 1 68. 9 40. 9 58. 3 65. 4
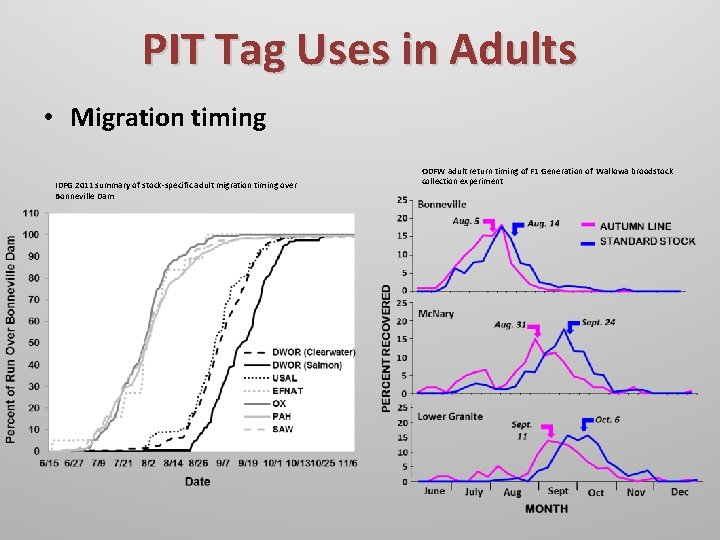
PIT Tag Uses in Adults • Migration timing IDFG 2011 summary of stock-specific adult migration timing over Bonneville Dam ODFW adult return timing of F 1 Generation of Wallowa broodstock collection experiment
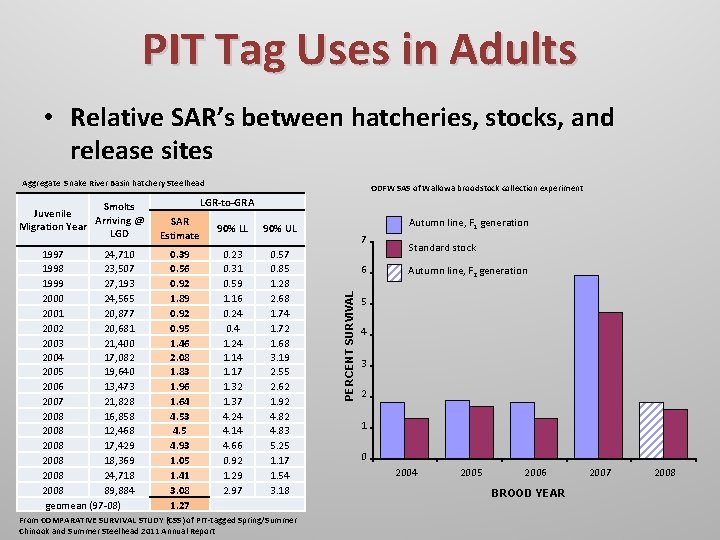
PIT Tag Uses in Adults • Relative SAR’s between hatcheries, stocks, and release sites Aggregate Snake River Basin hatchery Steelhead 1997 24, 710 1998 23, 507 1999 27, 193 2000 24, 565 2001 20, 877 2002 20, 681 2003 21, 400 2004 17, 082 2005 19, 640 2006 13, 473 2007 21, 828 2008 16, 858 2008 12, 468 2008 17, 429 2008 18, 369 2008 24, 718 2008 89, 884 geomean (97 -08) LGR-to-GRA SAR Estimate 0. 39 0. 56 0. 92 1. 89 0. 92 0. 95 1. 46 2. 08 1. 83 1. 96 1. 64 4. 53 4. 5 4. 93 1. 05 1. 41 3. 08 1. 27 90% LL 90% UL 0. 23 0. 31 0. 59 1. 16 0. 24 0. 4 1. 24 1. 17 1. 32 1. 37 4. 24 4. 14 4. 66 0. 92 1. 29 2. 97 0. 57 0. 85 1. 28 2. 68 1. 74 1. 72 1. 68 3. 19 2. 55 2. 62 1. 92 4. 83 5. 25 1. 17 1. 54 3. 18 From COMPARATIVE SURVIVAL STUDY (CSS) of PIT-tagged Spring/Summer Chinook and Summer Steelhead 2011 Annual Report Autumn line, F 1 generation 7 6 PERCENT SURVIVAL Smolts Juvenile Arriving @ Migration Year LGD ODFW SAS of Wallowa broodstock collection experiment Standard stock Autumn line, F 2 generation 5 4 3 2 1 0 2004 2005 2006 BROOD YEAR 2007 2008
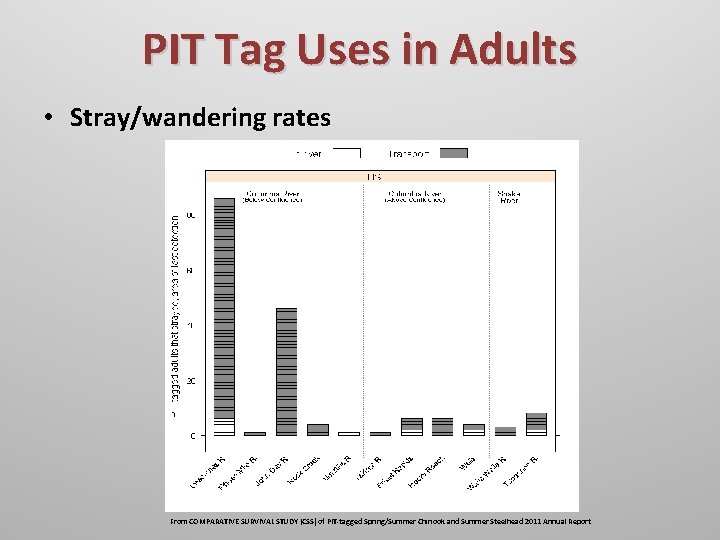
PIT Tag Uses in Adults • Stray/wandering rates From COMPARATIVE SURVIVAL STUDY (CSS) of PIT-tagged Spring/Summer Chinook and Summer Steelhead 2011 Annual Report
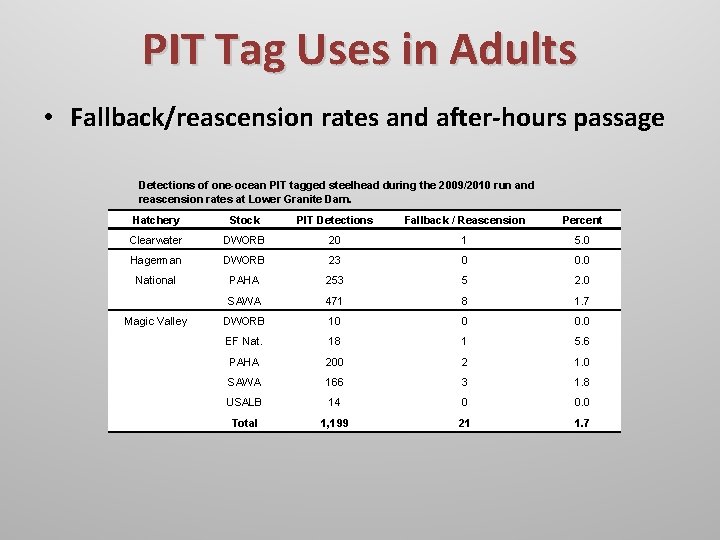
PIT Tag Uses in Adults • Fallback/reascension rates and after-hours passage Detections of one-ocean PIT tagged steelhead during the 2009/2010 run and reascension rates at Lower Granite Dam. Hatchery Stock PIT Detections Fallback / Reascension Percent Clearwater DWORB 20 1 5. 0 Hagerman DWORB 23 0 0. 0 National PAHA 253 5 2. 0 SAWA 471 8 1. 7 DWORB 10 0 0. 0 EF Nat. 18 1 5. 6 PAHA 200 2 1. 0 SAWA 166 3 1. 8 USALB 14 0 0. 0 Total 1, 199 21 1. 7 Magic Valley
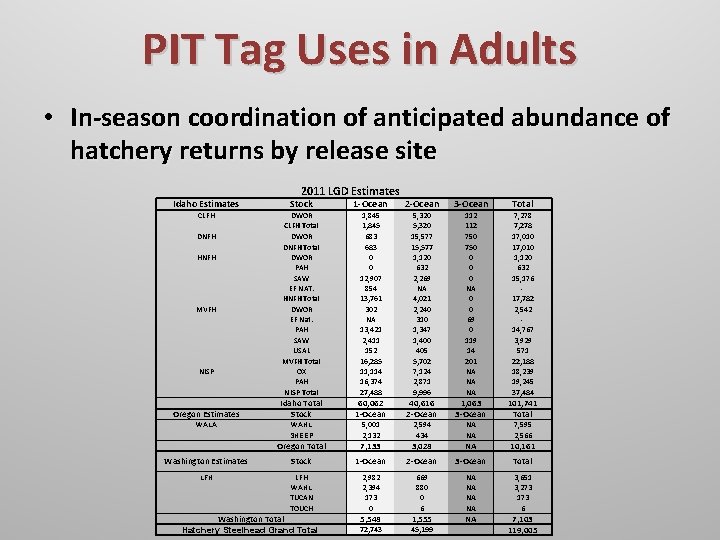
PIT Tag Uses in Adults • In-season coordination of anticipated abundance of hatchery returns by release site 2011 LGD Estimates Idaho Estimates Stock 1 -Ocean 2 -Ocean 3 -Ocean Total CLFH DNFH HNFH MVFH NISP DWOR CLFH Total DWOR DNFH Total DWOR PAH SAW EF NAT. HNFH Total DWOR EF Nat. PAH SAW USAL MVFH Total OX PAH NISP Total 1, 845 683 0 0 12, 907 854 13, 761 302 NA 13, 421 2, 411 152 16, 285 11, 114 16, 374 27, 488 5, 320 15, 577 1, 120 632 2, 269 NA 4, 021 2, 240 310 1, 347 1, 400 405 5, 702 7, 124 2, 871 9, 996 112 750 0 0 0 NA 0 0 69 0 119 14 201 NA NA NA 7, 278 17, 010 1, 120 632 15, 176 17, 782 2, 542 14, 767 3, 929 571 22, 188 18, 239 19, 245 37, 484 Oregon Estimates Idaho Total Stock 60, 062 1 -Ocean 40, 616 2 -Ocean 1, 063 3 -Ocean 101, 741 Total WALA WAHL SHEEP 5, 001 2, 132 2, 594 434 NA NA 7, 595 2, 566 Oregon Total 7, 133 3, 028 NA 10, 161 Washington Estimates Stock 1 -Ocean 2 -Ocean 3 -Ocean Total LFH WAHL 2, 982 2, 394 173 0 669 880 0 6 NA NA 3, 651 3, 273 173 6 5, 548 1, 555 NA 72, 743 45, 199 7, 103 119, 005 TUCAN TOUCH Washington Total Hatchery Steelhead Grand Total
Coordination • Teleconference calls are held through the fall to discuss run status (in conjunction with fall Chinook coordination) • In-season run status can have implications on hatchery operations and fisheries • Participation typically includes IDFG, ODFW, WDFW, USFWS, NPT, SBT, and IPC
Coordination • Teleconference calls are held through the fall to discuss run status (in conjunction with fall Chinook coordination) • In-season run status can have implications on hatchery operations and fisheries • Participation typically includes IDFG, ODFW, WDFW, USFWS, NPT, SBT, and IPC • This process enables the most up to date in-season estimates to be available for all co-managers and for real time management decisions to be made
What are Potential Shortcomings? • Expanding PIT tagged adults by juvenile tagging rates could underestimate the return (well documented in Chinook)
What are Potential Shortcomings? • Expanding PIT tagged adults by juvenile tagging rates could underestimate the return (well documented in Chinook) • Tags are shed and there is the possibility for differential survival between tagged and untagged fish resulting in lower representation of tagged fish in the returning population
What are Potential Shortcomings? • Expanding PIT tagged adults by juvenile tagging rates could underestimate the return (well documented in Chinook) • Tags are shed and there is the possibility for differential survival between tagged and untagged fish resulting in lower representation of tagged fish in the returning population • Historically, rates of tagged fish in adults have been difficult to determine because hand scanning at hatchery racks in not 100% efficient
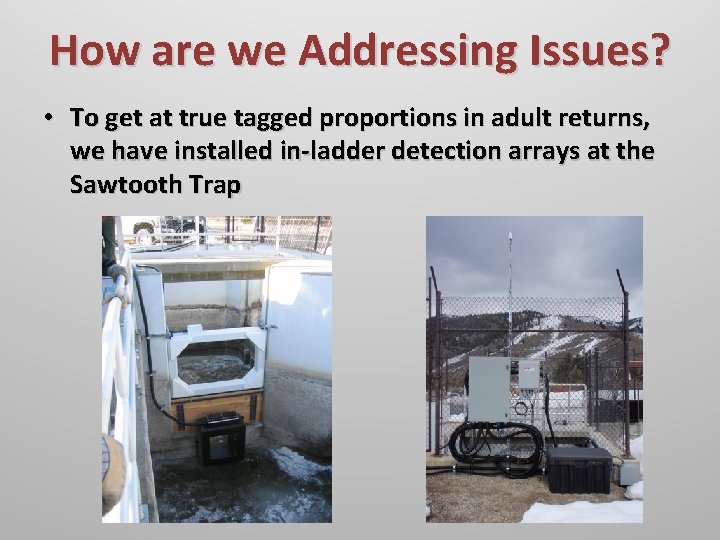
How are we Addressing Issues? • To get at true tagged proportions in adult returns, we have installed in-ladder detection arrays at the Sawtooth Trap
How are we Addressing Issues? • To get at true tagged proportions in adult returns, we have installed in-ladder detection arrays at the Sawtooth Trap • This allows us to assess the proportion of tagged fish in the actual adult return vs. estimated tag proportions in juvenile releases
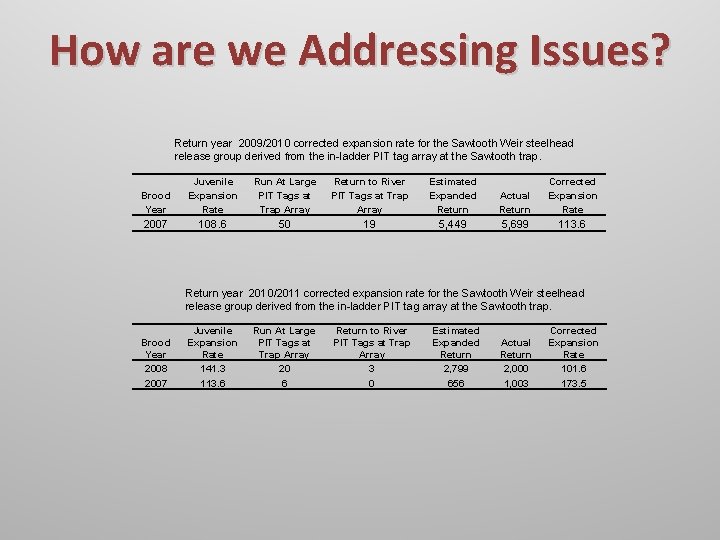
How are we Addressing Issues? • To get at true tagged proportions in adult returns, we have installed in-ladder detection arrays at the Sawtooth Trap • This allows us to assess the proportion of tagged fish in the actual adult return vs. estimated tag proportions in juvenile releases • Through two years of evaluating, initial results are mixed as to the how well returning adult PIT tagged steelhead account for untagged fish based on juvenile tagging rates
How are we Addressing Issues? Return year 2009/2010 corrected expansion rate for the Sawtooth Weir steelhead release group derived from the in-ladder PIT tag array at the Sawtooth trap. Brood Year Juvenile Expansion Rate Run At Large PIT Tags at Trap Array Return to River PIT Tags at Trap Array Estimated Expanded Return Actual Return Corrected Expansion Rate 2007 108. 6 50 19 5, 449 5, 699 113. 6 Return year 2010/2011 corrected expansion rate for the Sawtooth Weir steelhead release group derived from the in-ladder PIT tag array at the Sawtooth trap. Brood Year 2008 2007 Juvenile Expansion Rate 141. 3 113. 6 Run At Large PIT Tags at Trap Array 20 6 Return to River PIT Tags at Trap Array 3 0 Estimated Expanded Return 2, 799 656 Actual Return 2, 000 1, 003 Corrected Expansion Rate 101. 6 173. 5
Summary • PIT tags serve numerous juvenile and adult monitoring and evaluation purposes.
Summary • PIT tags serve numerous juvenile and adult monitoring and evaluation purposes. • PIT tags provide a tool to get real-time, in-season estimates of adult parameters at 4 of the 8 lower Columbia and Snake River dams.
Summary • PIT tags serve numerous juvenile and adult monitoring and evaluation purposes. • PIT tags provide a tool to get real-time, in-season estimates of adult parameters at 4 of the 8 lower Columbia and Snake River dams. • In-season estimates coupled with weekly conference calls, allow for more accurate and timely management decisions and better multi-agency coordination.
Summary • PIT tags serve numerous juvenile and adult monitoring and evaluation purposes. • PIT tags provide a tool to get real-time, in-season estimates of adult parameters at 4 of the 8 lower Columbia and Snake River dams. • In-season estimates coupled with weekly conference calls, allow for more accurate and timely management decisions and better multi-agency coordination. • Variation in the tagged to untagged ratio between juvenile releases and returning adult PIT tagged steelhead is still unclear and may be variable across return years, ages, and stocks. Evaluation is ongoing.
Acknowledgments LSRCP IPC ODFW - Lance Clarke WDFW - Joe Bumgarner NPT SBT IDFG Regional Staff Hatchery Staff Research Staff PSMFC
Questions?