
THE USE OF GENETIC MARKERS IN PLANT BREEDING
THE USE OF GENETIC MARKERS IN PLANT BREEDING
Use of Molecular Markers ü Clonal identity, ü Family structure, ü Population structure, ü Phylogeny (Genetic Diversity) ü Mapping ü Parental analysis, ü Gene flow, ü Hybridisation
Genetic Diversity Define appropriate geographical scales for monitoring and management (epidemology) ü Establish gene flow mechanism ü Identify the origin of individual (mutation detection) ü Monitor the effect of management practices ü Manage small number of individual in ex situ collection ü Establish of identity in cultivar and clones (fingerprint) ü Paternity analysis and forensic ü
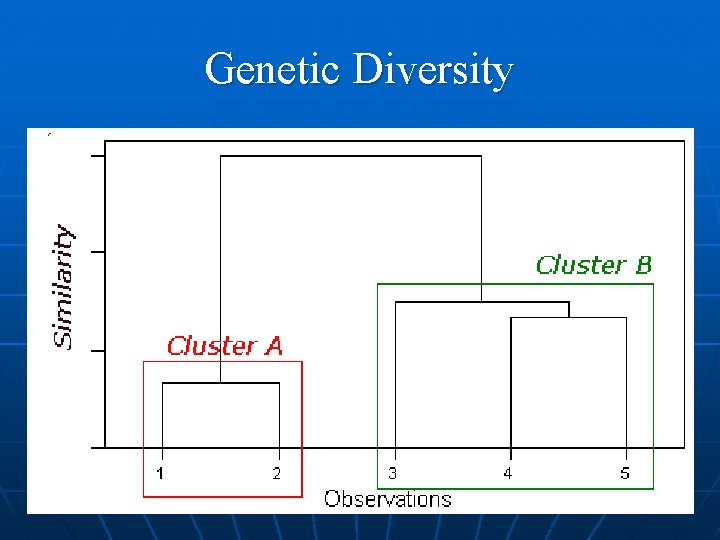
Genetic Diversity

Clonal Identity fingerprints seeds, plantlets early selection of the good allele
Mapping The determination of the position and relative distances of gene on chromosome by means of their linkage q Genetic map A linear arrangement of genes or genetic markers obtained based on recombination q Physical map A linear order of genes or DNA fragments
Physical Mapping ü It contains ordered overlapping cloned DNA fragment ü The cloned DNA fragments are usually obtained using restriction enzyme digestion
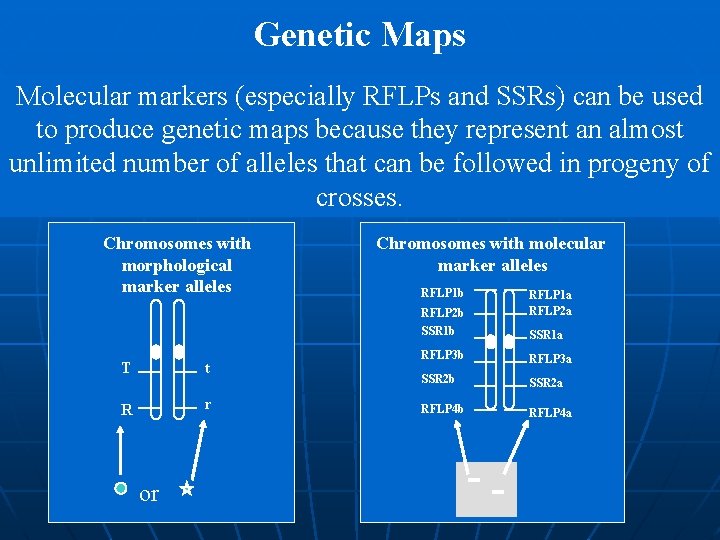
Genetic Maps Molecular markers (especially RFLPs and SSRs) can be used to produce genetic maps because they represent an almost unlimited number of alleles that can be followed in progeny of crosses. Chromosomes with morphological marker alleles Chromosomes with molecular marker alleles RFLP 1 b RFLP 2 b SSR 1 b T t R r or RFLP 1 a RFLP 2 a SSR 1 a RFLP 3 b RFLP 3 a SSR 2 b SSR 2 a RFLP 4 b RFLP 4 a
QTL (Quantitative Trait Loci) ü A locus or DNA segment that carries more genes coding for an agronomic or other traits ü Individual loci responsible for quantitative genetic variation ü Region in the genome containing factors influencing a quantitative trait ü Region identified by statistical association QTL Mapping ü ü A set of procedures for detecting genes controlling quantitative traits (QTL) and estimating their genetics effects and location Localizing and determining a segment of DNA that regulate quantitative traits ü Detecting and locating gene having an effect on a quantitative traits To assist selection Marker Assisted Selection Þ
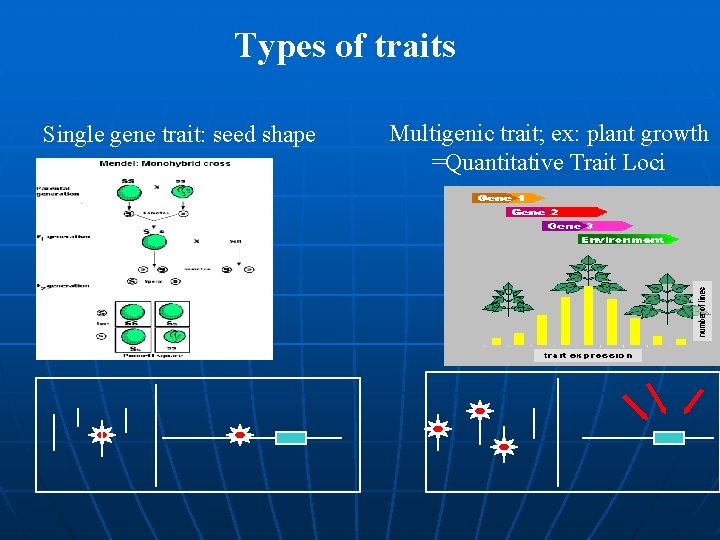
Types of traits Single gene trait: seed shape Multigenic trait; ex: plant growth =Quantitative Trait Loci
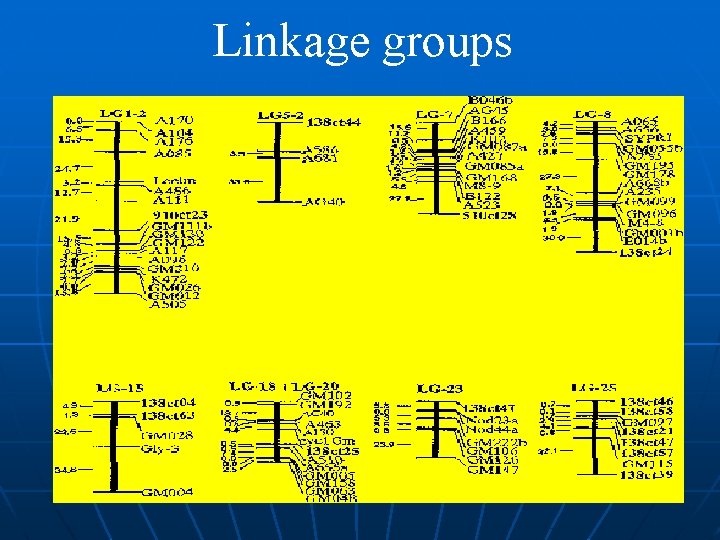
Linkage groups
Developing a Marker n n n Best marker is DNA sequence responsible for phenotype i. e. gene If you know the gene responsible and has been isolated, compare sequence of wild-type and mutant DNA Develop specific primers to gene that will distinguish the two forms
Developing a Marker n n n If gene is unknown, screen contrasting populations Use populations rather than individuals Need to “blend” genetic differences between individual other than trait of interest
Developing Markers n n Cross individual differing in trait you wish to develop a marker Collect progeny and self or polycross the progeny Collect and select the F 2 generation for the trait you are interested in Select 5 - 10 individuals in the F 2 showing each trait
Developing Markers n n Extract DNA from selected F 2 s Pool equal amounts of DNA from each individual into two samples - one for each trait Screen pooled or “bulked” DNA with what method of marker method you wish to use Conduct linkage analysis to develop QTL Marker Other methods to develop population for markers exist but are more expensive and slower to develop → Near Isogenic Lines, Recombinant Inbreeds, Single Seed Decent
MAS n n Marker assisted selection The use of DNA markers that are tightly- linked to target loci as a substitute for or to assist phenotypic screening Assumption DNA markers can reliably predict phenotype
Marker Assisted Selection ü ü ü Breeding for specific traits in plants is expensive and time consuming The progeny often need to reach maturity before a determination of the success of the cross can be made The greater the complexity of the trait, the more time and effort needed to achieve a desirable result The goal to MAS is to reduce the time needed to determine if the progeny have trait The second goal is to reduce costs associated with screening for traits If you can detect the distinguishing trait at the DNA level you can identify positive selection very early.
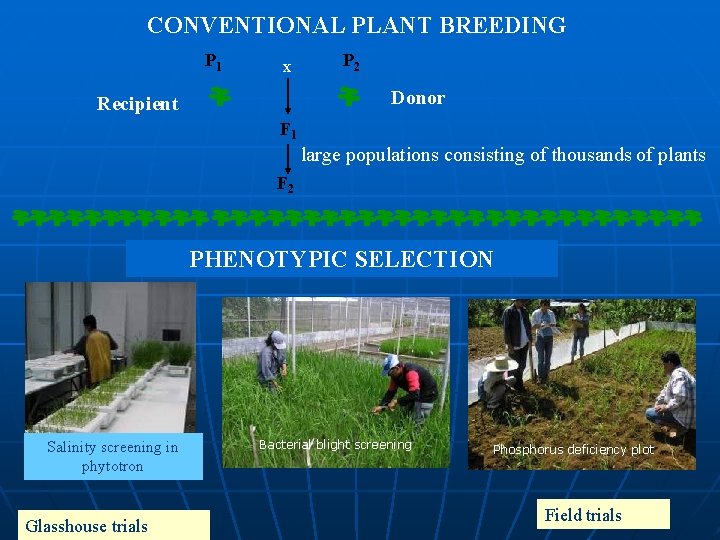
CONVENTIONAL PLANT BREEDING P 1 x P 2 Donor Recipient F 1 large populations consisting of thousands of plants F 2 PHENOTYPIC SELECTION Salinity screening in phytotron Glasshouse trials Bacterial blight screening Phosphorus deficiency plot Field trials
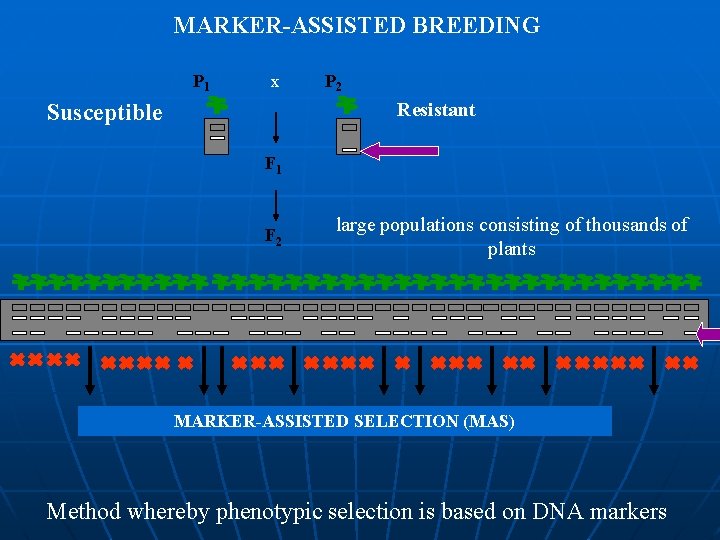
MARKER-ASSISTED BREEDING P 1 x P 2 Resistant Susceptible F 1 F 2 large populations consisting of thousands of plants MARKER-ASSISTED SELECTION (MAS) Method whereby phenotypic selection is based on DNA markers
Advantages of MAS n Simpler method compared to phenotypic screening • Especially for traits with laborious screening • May save time and resources n Selection at seedling stage • Important for traits such as grain quality • Can select before transplanting in rice n Increased reliability • No environmental effects • Can discriminate between homozygotes and heterozygotes and select single plants
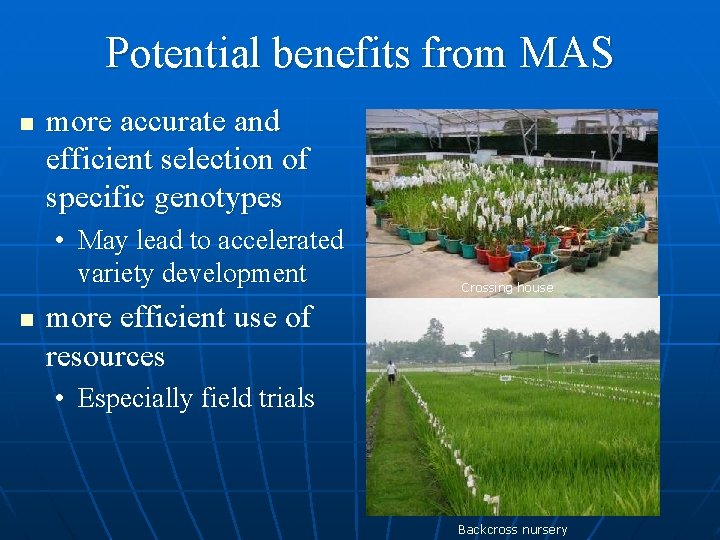
Potential benefits from MAS n more accurate and efficient selection of specific genotypes • May lead to accelerated variety development n Crossing house more efficient use of resources • Especially field trials Backcross nursery
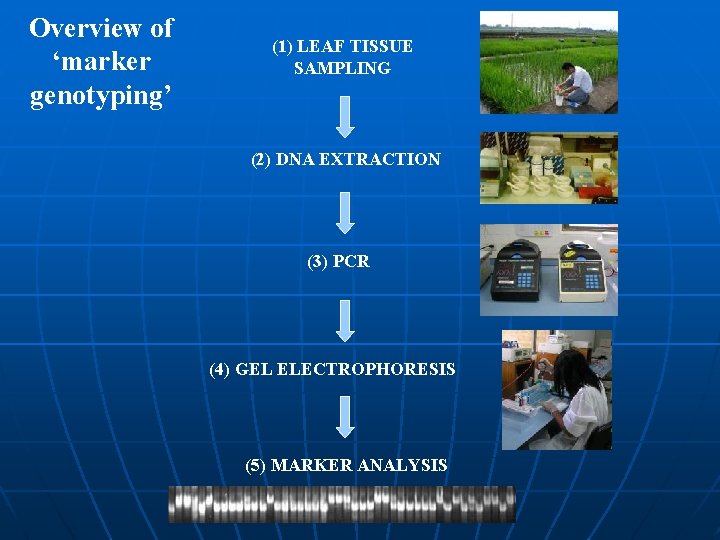
Overview of ‘marker genotyping’ (1) LEAF TISSUE SAMPLING (2) DNA EXTRACTION (3) PCR (4) GEL ELECTROPHORESIS (5) MARKER ANALYSIS
Developing a Marker n n n Best marker is DNA sequence responsible for phenotype i. e. gene If you know the gene responsible and has been isolated, compare sequence of wild-type and mutant DNA Develop specific primers to gene that will distinguish the two forms
Developing a Marker n n n If gene is unknown, screen contrasting populations Use populations rather than individuals Need to “blend” genetic differences between individual other than trait of interest
Developing Markers n n Cross individual differing in trait you wish to develop a marker Collect progeny and self or polycross the progeny Collect and select the F 2 generation for the trait you are interested in Select 5 - 10 individuals in the F 2 showing each trait
Developing Markers n n Extract DNA from selected F 2 s Pool equal amounts of DNA from each individual into two samples - one for each trait Screen pooled or “bulked” DNA with what method of marker method you wish to use Conduct linkage analysis to develop QTL Marker Other methods to develop population for markers exist but are more expensive and slower to develop → Near Isogenic Lines, Recombinant Inbreeds, Single Seed Decent
Considerations for using DNA markers in plant breeding n Technical methodology • simple or complicated? n n n Reliability Degree of polymorphism DNA quality and quantity required Cost** Available resources • Equipment, technical expertise
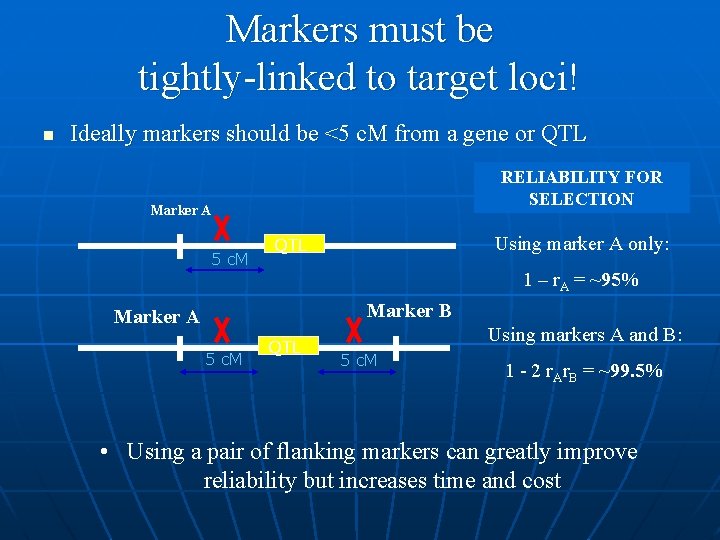
Markers must be tightly-linked to target loci! n Ideally markers should be <5 c. M from a gene or QTL RELIABILITY FOR SELECTION Marker A 5 c. M Using marker A only: QTL 1 – r. A = ~95% Marker B Marker A 5 c. M QTL Using markers A and B: 5 c. M 1 - 2 r. Ar. B = ~99. 5% • Using a pair of flanking markers can greatly improve reliability but increases time and cost
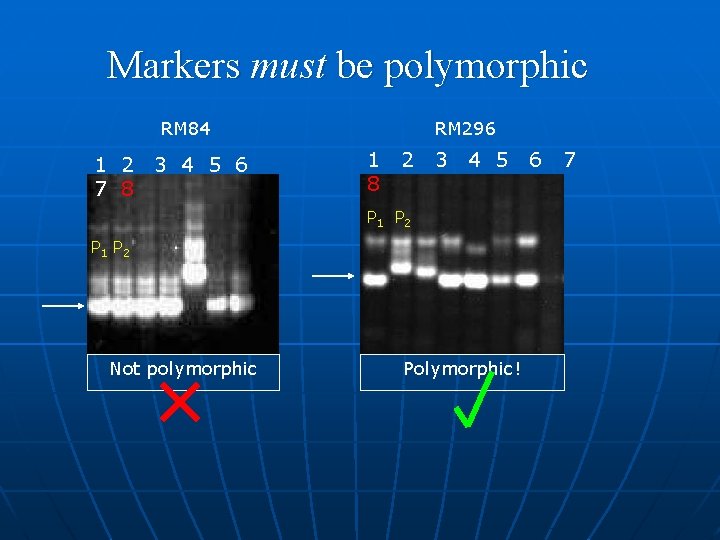
Markers must be polymorphic RM 84 1 2 7 8 3 4 5 6 RM 296 1 8 2 3 4 5 P 1 P 2 Not polymorphic Polymorphic! 6 7
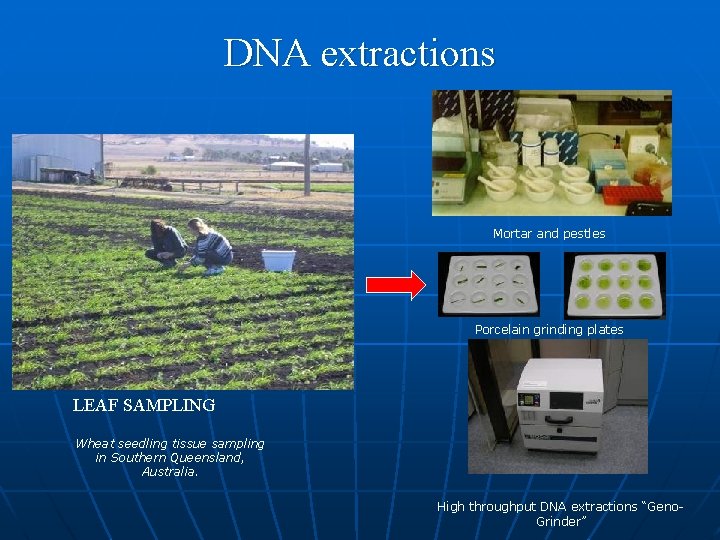
DNA extractions Mortar and pestles Porcelain grinding plates LEAF SAMPLING Wheat seedling tissue sampling in Southern Queensland, Australia. High throughput DNA extractions “Geno. Grinder”
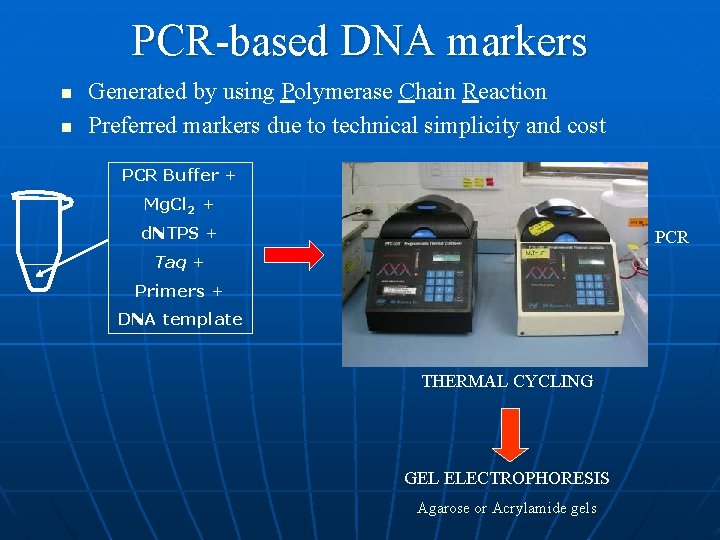
PCR-based DNA markers n n Generated by using Polymerase Chain Reaction Preferred markers due to technical simplicity and cost PCR Buffer + Mg. Cl 2 + d. NTPS + PCR Taq + Primers + DNA template THERMAL CYCLING GEL ELECTROPHORESIS Agarose or Acrylamide gels
Marker Assisted Selection Useful when the gene(s) of interest is difficult to select: 1. Recessive Genes 2. Multiple Genes for Disease Resistance 3. Quantitative traits 4. Large genotype x environment interaction
MARKER ASSISTED BREEDING SCHEMES 1. 2. 3. 4. Marker-assisted backcrossing Pyramiding Early generation selection ‘Combined’ approaches
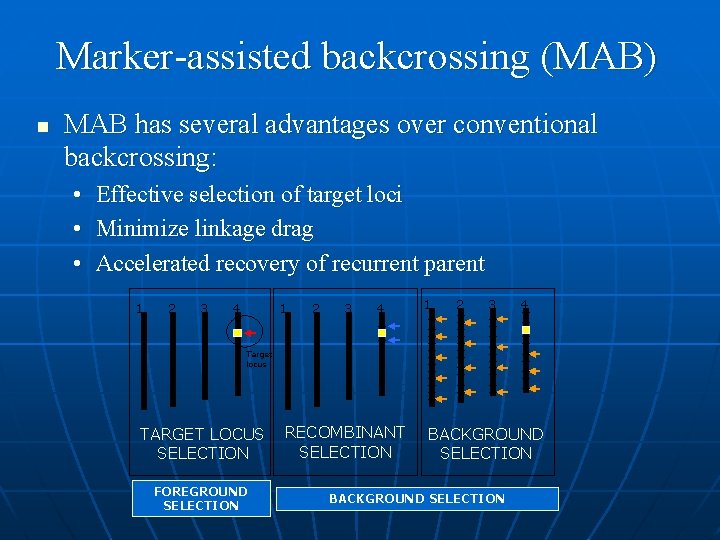
Marker-assisted backcrossing (MAB) n MAB has several advantages over conventional backcrossing: • Effective selection of target loci • Minimize linkage drag • Accelerated recovery of recurrent parent 1 2 3 4 Target locus TARGET LOCUS SELECTION FOREGROUND SELECTION RECOMBINANT SELECTION BACKGROUND SELECTION
Gene Pyramiding ü Widely used for combining multiple disease resistance genes for specific races of a pathogen ü Pyramiding is extremely difficult to achieve using conventional methods Consider: phenotyping a single plant for multiple forms of seedling resistance – almost impossible ü Important to develop ‘durable’ disease resistance against different races
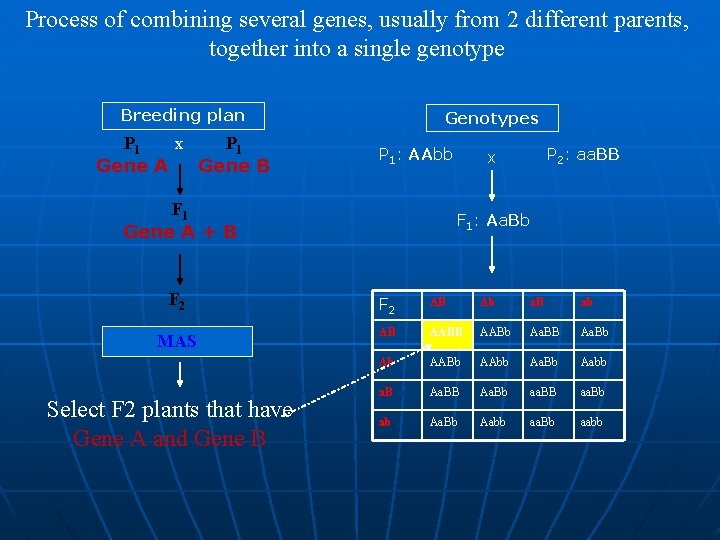
Process of combining several genes, usually from 2 different parents, together into a single genotype Breeding plan P 1 x P 1 Gene A Gene B Genotypes P 1: AAbb F 1 Gene A + B F 2 MAS Select F 2 plants that have Gene A and Gene B P 2: aa. BB x F 1: Aa. Bb F 2 AB Ab a. B ab AB AABb Aa. BB Aa. Bb Ab AABb AAbb Aa. Bb Aabb a. B Aa. Bb aa. BB aa. Bb ab Aa. Bb Aabb aa. Bb aabb
Early generation MAS n n MAS conducted at F 2 or F 3 stage Plants with desirable genes/QTLs are selected and alleles can be ‘fixed’ in the homozygous state • plants with undesirable gene combinations can be discarded n Advantage for later stages of breeding program because resources can be used to focus on fewer lines
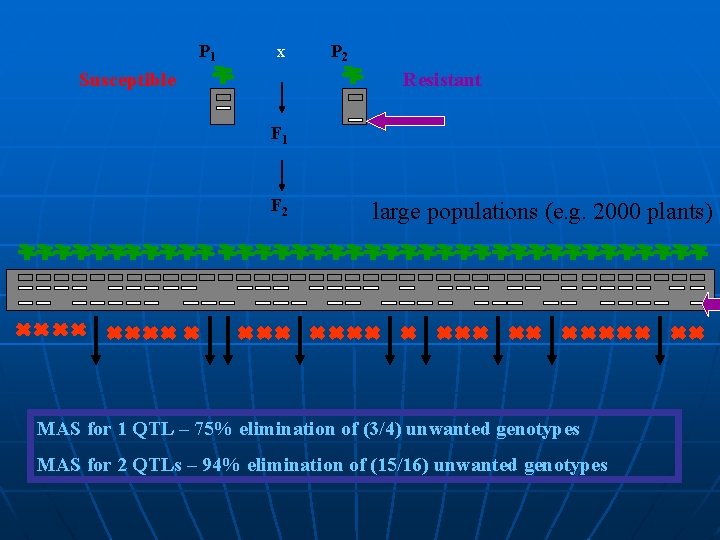
P 1 x Susceptible P 2 Resistant F 1 F 2 large populations (e. g. 2000 plants) MAS for 1 QTL – 75% elimination of (3/4) unwanted genotypes MAS for 2 QTLs – 94% elimination of (15/16) unwanted genotypes
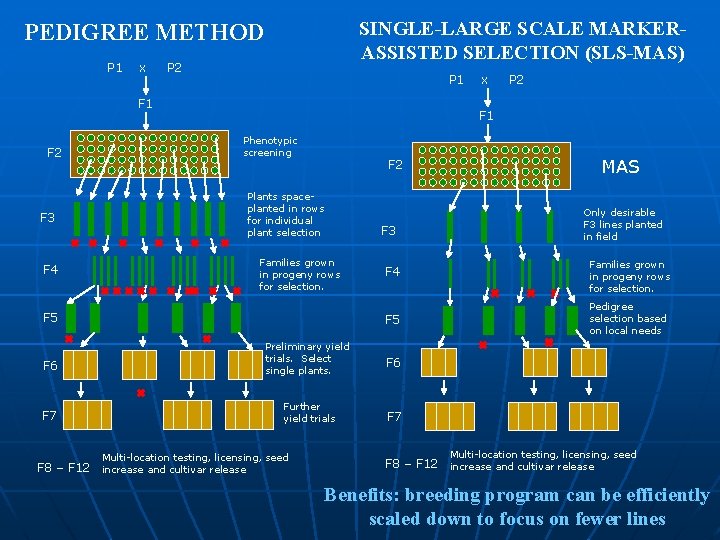
SINGLE-LARGE SCALE MARKERASSISTED SELECTION (SLS-MAS) PEDIGREE METHOD P 1 x P 2 P 1 F 2 x P 2 F 1 Phenotypic screening Plants spaceplanted in rows for individual plant selection F 3 Families grown in progeny rows for selection. F 4 F 5 Families grown in progeny rows for selection. F 5 Pedigree selection based on local needs F 6 F 7 Further yield trials F 7 Multi-location testing, licensing, seed Only desirable F 3 lines planted in field F 4 Preliminary yield trials. Select single plants. F 8 – F 12 increase and cultivar release MAS F 2 Multi-location testing, licensing, seed F 8 – F 12 increase and cultivar release Benefits: breeding program can be efficiently scaled down to focus on fewer lines
Combined approaches n In some cases, a combination of phenotypic screening and MAS approach may be useful 1. To maximize genetic gain (when some QTLs have been unidentified from QTL mapping) 2. Level of recombination between marker and QTL (in other words marker is not 100% accurate) 3. To reduce population sizes for traits where marker genotyping is cheaper or easier than phenotypic screening
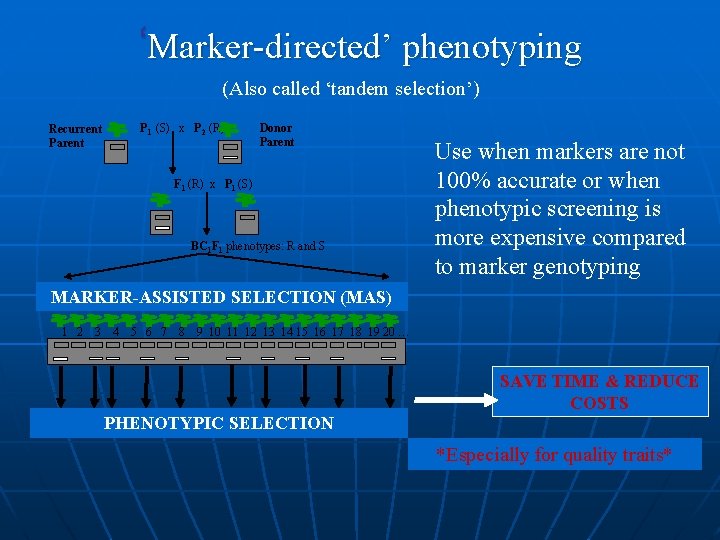
‘Marker-directed’ phenotyping (Also called ‘tandem selection’) P 1 (S) x P 2 (R) Recurrent Parent Donor Parent F 1 (R) x P 1 (S) BC 1 F 1 phenotypes: R and S Use when markers are not 100% accurate or when phenotypic screening is more expensive compared to marker genotyping MARKER-ASSISTED SELECTION (MAS) 1 2 3 4 5 6 7 8 9 10 11 12 13 14 15 16 17 18 19 20 … SAVE TIME & REDUCE COSTS PHENOTYPIC SELECTION *Especially for quality traits*
- Slides: 41