
The Urinary System Chapter 26 Functions of the
- Slides: 79
The Urinary System Chapter 26
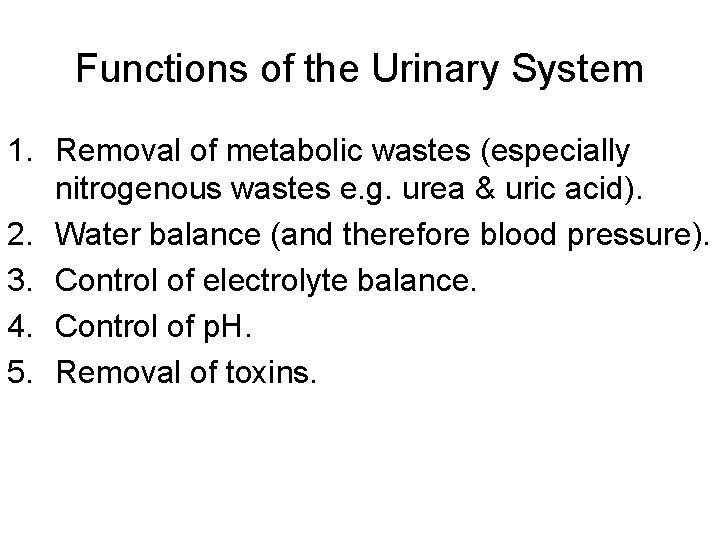
Functions of the Urinary System 1. Removal of metabolic wastes (especially nitrogenous wastes e. g. urea & uric acid). 2. Water balance (and therefore blood pressure). 3. Control of electrolyte balance. 4. Control of p. H. 5. Removal of toxins.
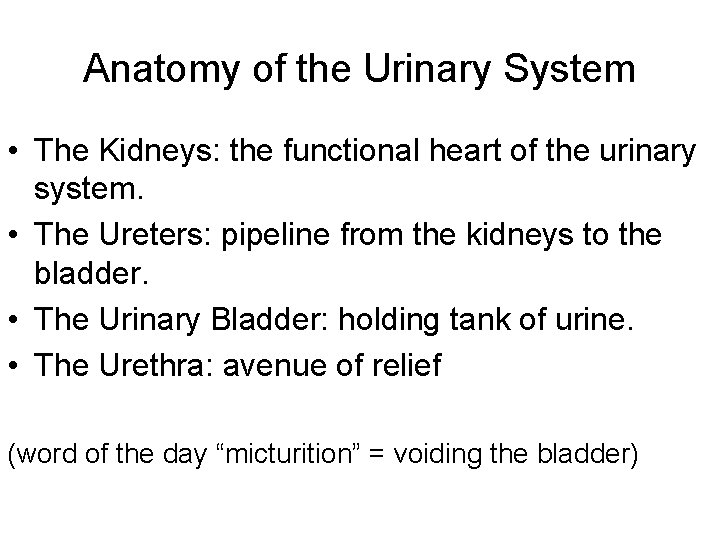
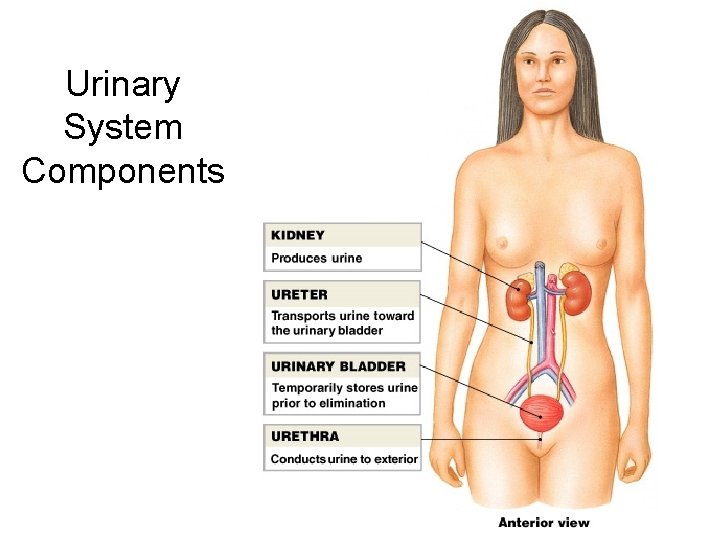
Anatomy of the Urinary System • The Kidneys: the functional heart of the urinary system. • The Ureters: pipeline from the kidneys to the bladder. • The Urinary Bladder: holding tank of urine. • The Urethra: avenue of relief (word of the day “micturition” = voiding the bladder)
Urinary System Components
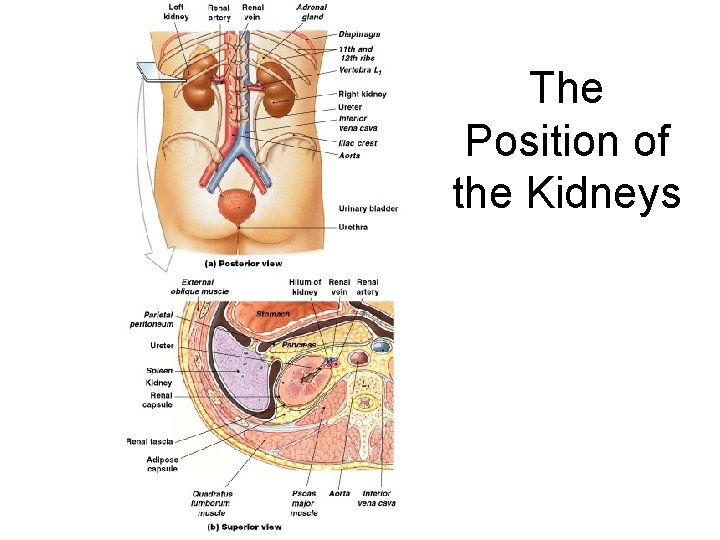
The Kidneys • Location: retroperitoneal against the dorsal wall of the abdominal cavity. The right kidney is slightly lower than the left. • Size & weight: approximately 150 grams (about 5 ounces) each and 12 cm x 10 cm x 4 cm. • Shaped like a bean (or are beans shaped like kidneys? )
The Position of the Kidneys Figure 26– 2
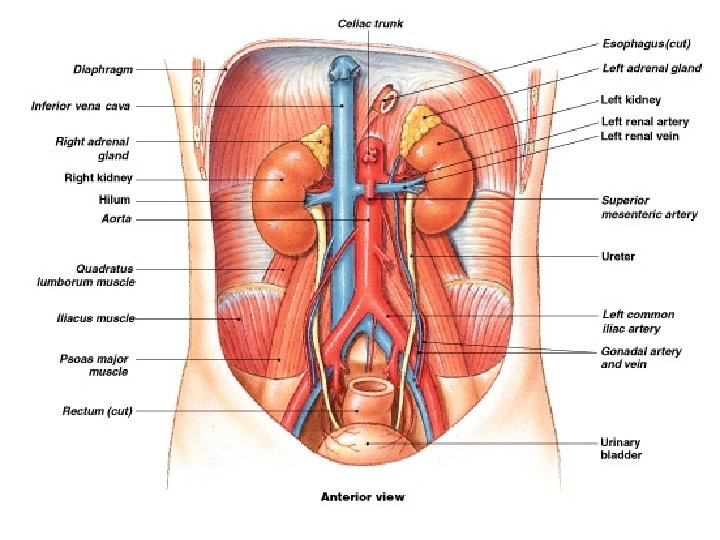
Gross Anatomy of the Urinary System Figure 26– 3
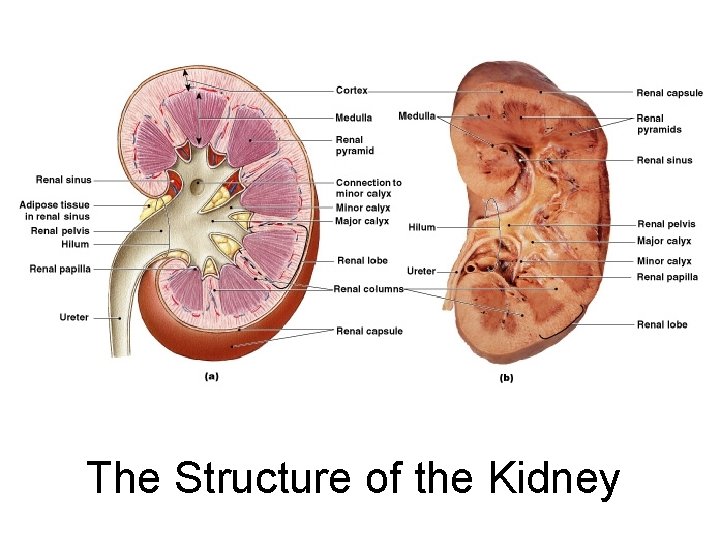
The Structure of the Kidney Figure 26– 4
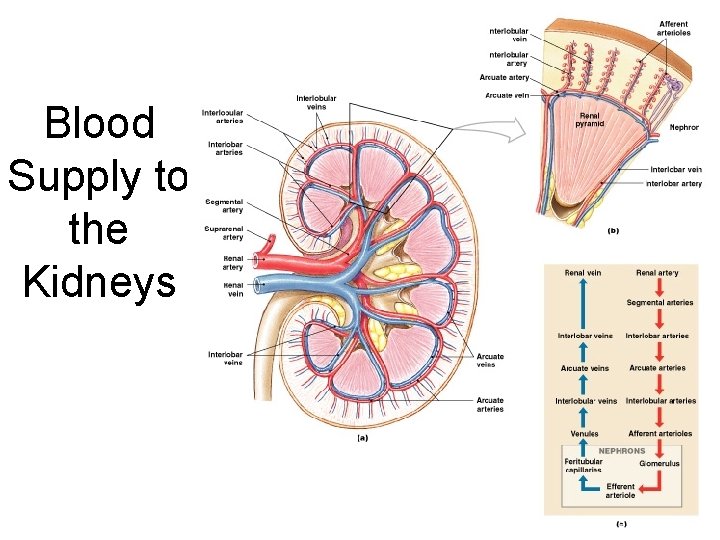
Blood Supply to Kidneys • Kidneys receive 20– 25% of total cardiac output • 1200 - 1500 ml of blood flows through kidneys each minute • Kidney receives blood through renal artery
Blood Supply to the Kidneys Figure 26– 5
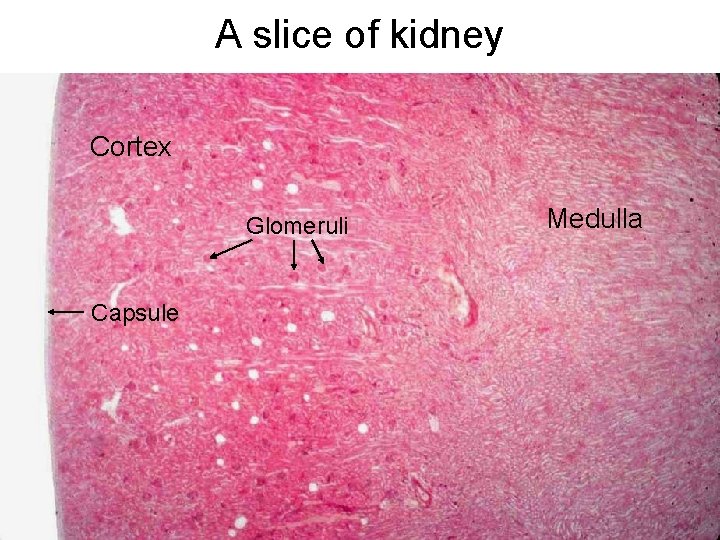
A slice of kidney Cortex Glomeruli Capsule Medulla
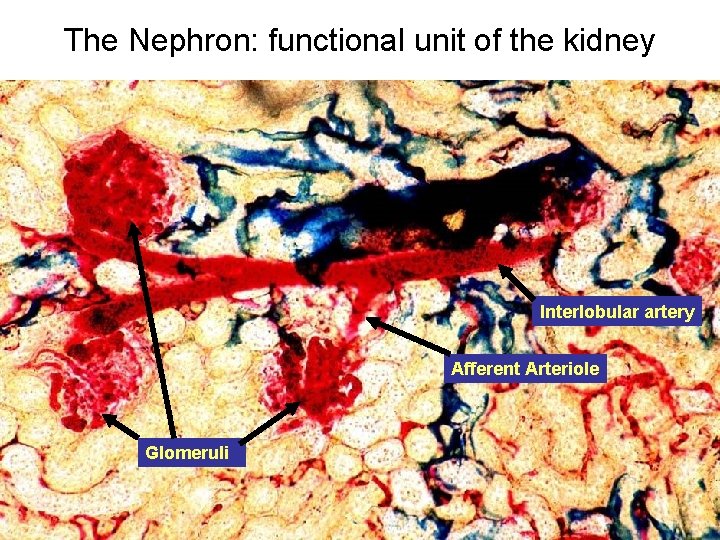
The Nephron: functional unit of the kidney Interlobular artery Afferent Arteriole Glomeruli
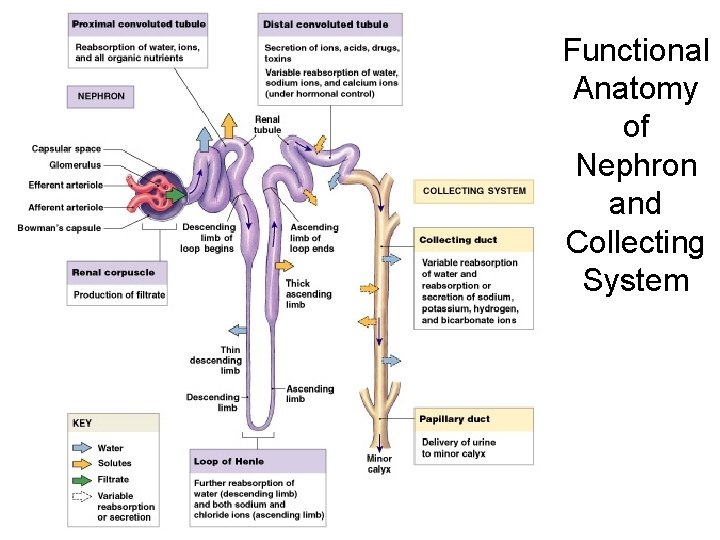
Functional Anatomy of Nephron and Collecting System Figure 26– 6
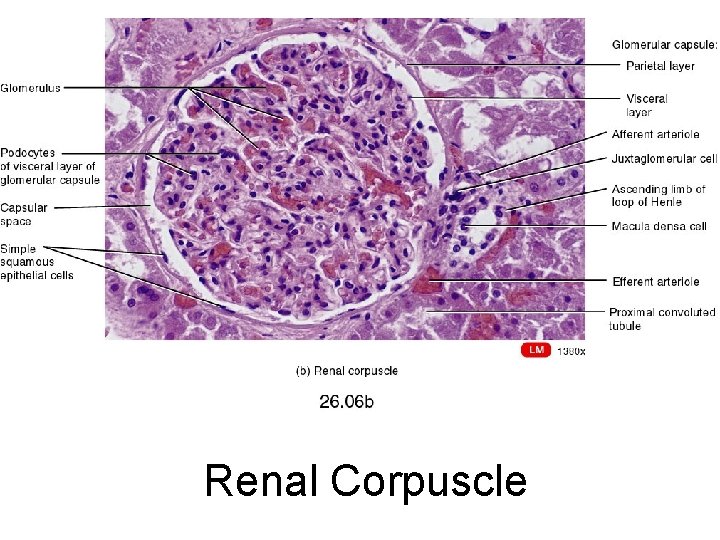
Renal Corpuscle
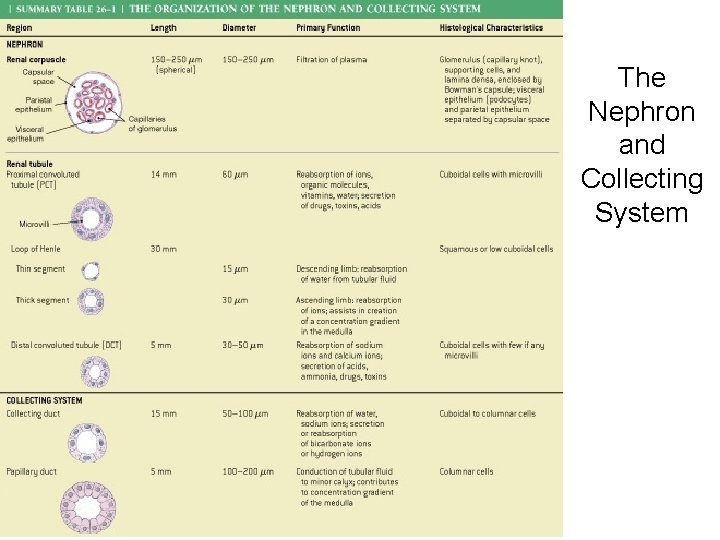
The Nephron and Collecting System Table 26– 1
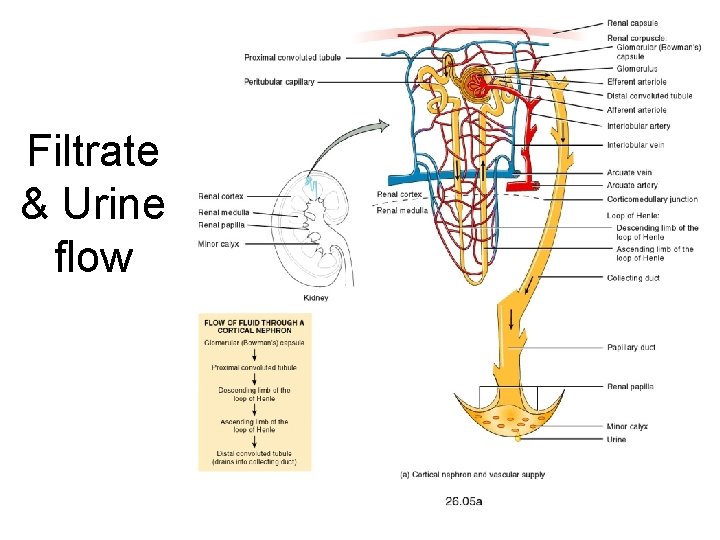
Filtrate & Urine flow
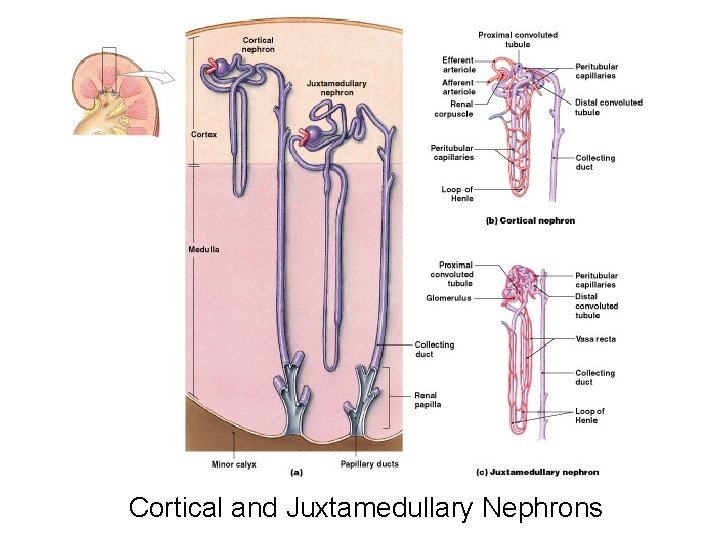
Cortical and Juxtamedullary Nephrons Figure 26– 7
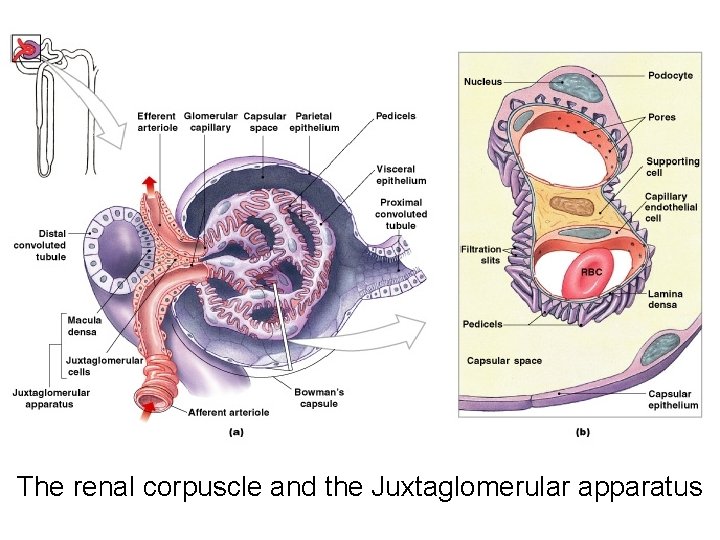
The renal corpuscle and the Juxtaglomerular apparatus
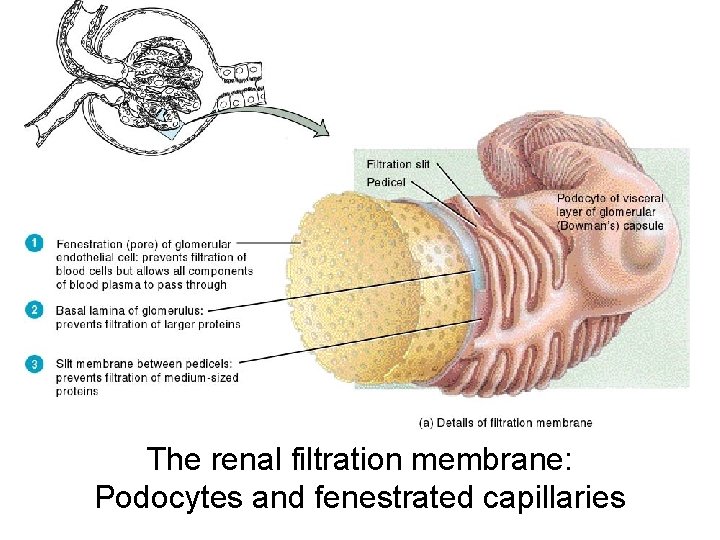
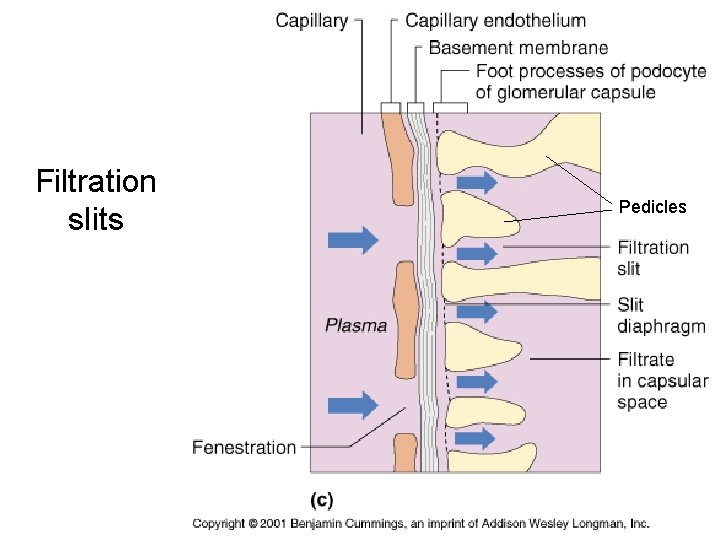
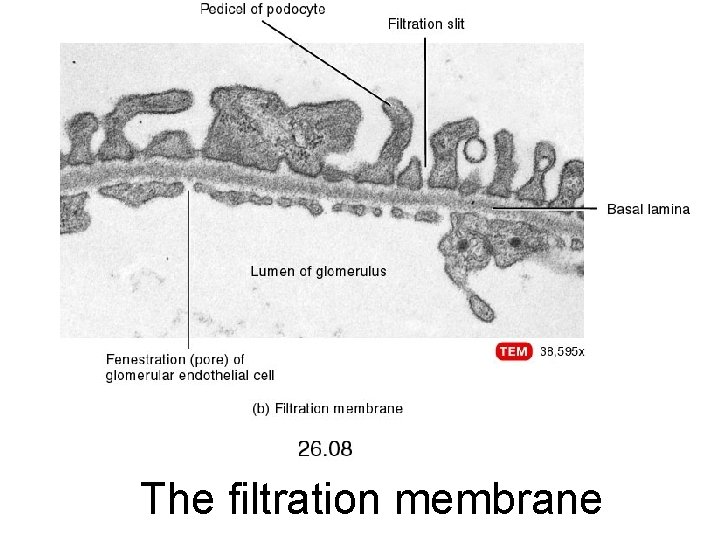
The renal filtration membrane: Podocytes and fenestrated capillaries
Filtration slits Pedicles
The filtration membrane
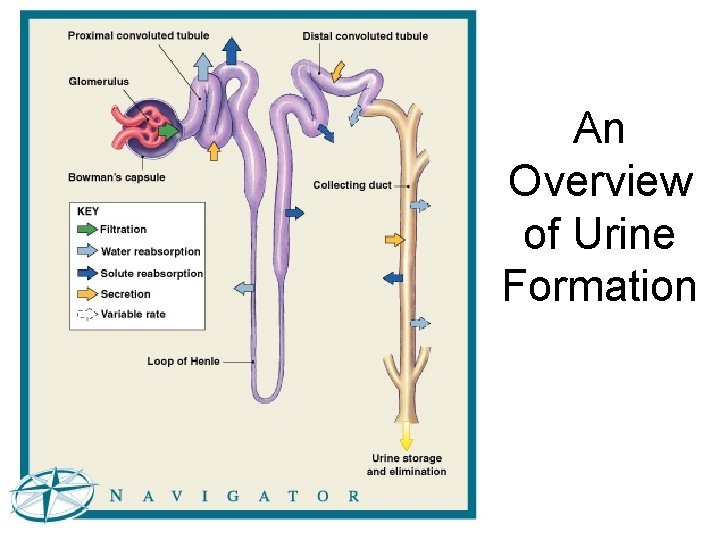
An Overview of Urine Formation Figure 26– 9 (Navigator)
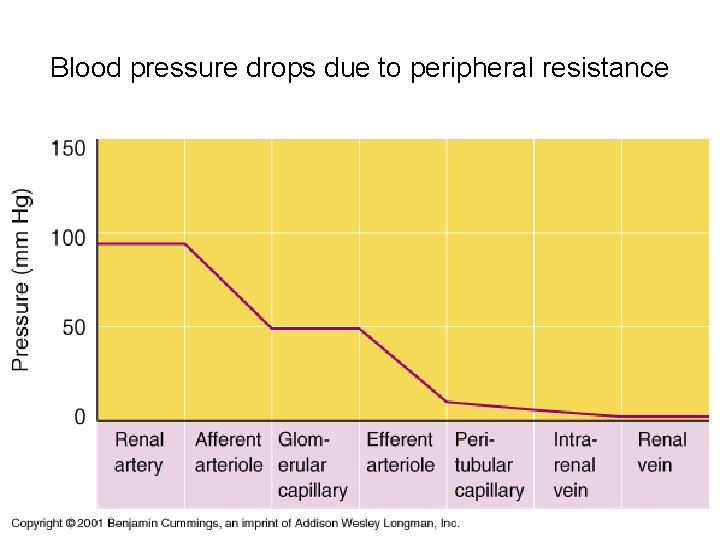
Blood pressure drops due to peripheral resistance
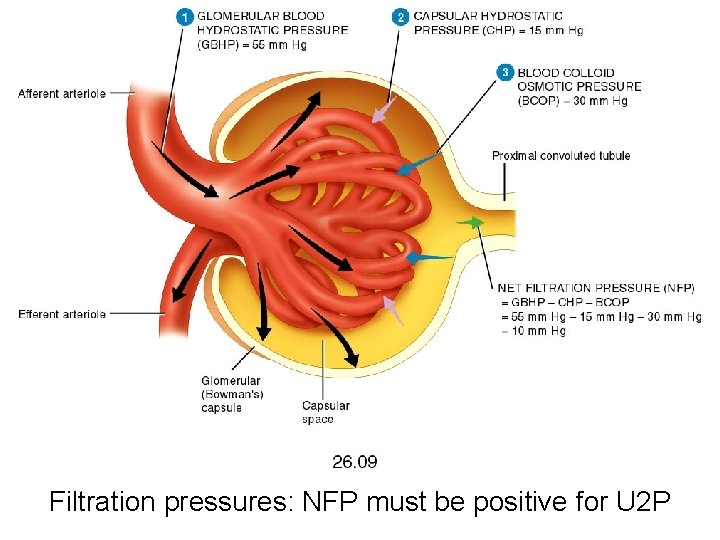
Filtration pressures: NFP must be positive for U 2 P
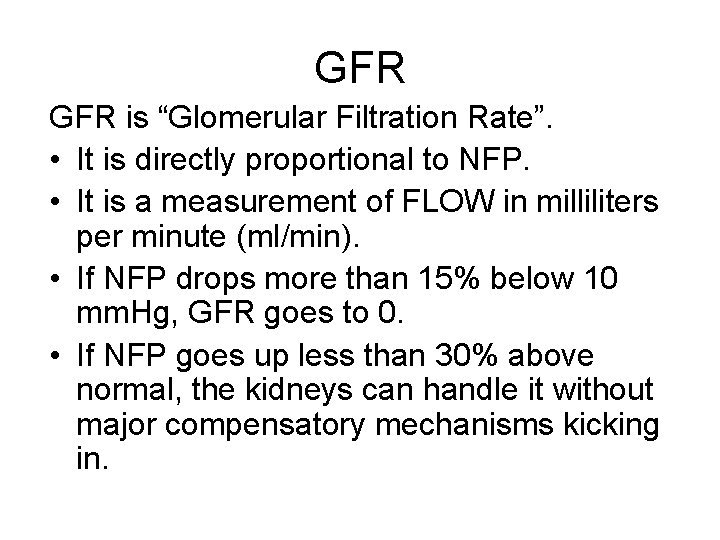
GFR is “Glomerular Filtration Rate”. • It is directly proportional to NFP. • It is a measurement of FLOW in milliliters per minute (ml/min). • If NFP drops more than 15% below 10 mm. Hg, GFR goes to 0. • If NFP goes up less than 30% above normal, the kidneys can handle it without major compensatory mechanisms kicking in.
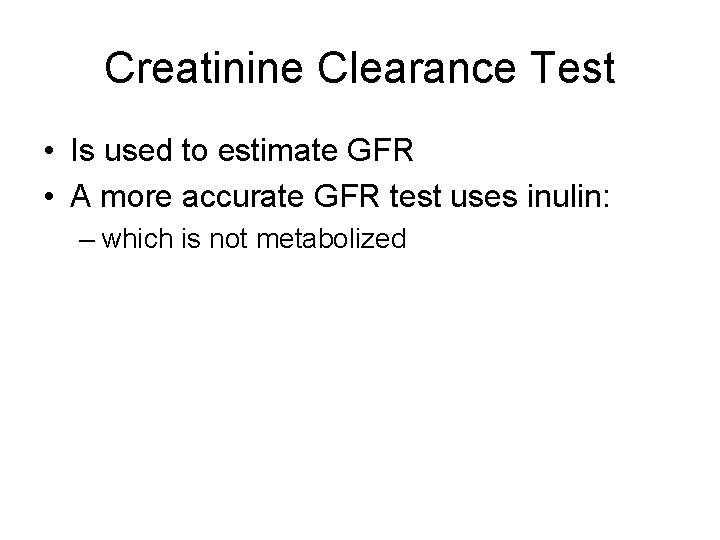
Creatinine Clearance Test • Is used to estimate GFR • A more accurate GFR test uses inulin: – which is not metabolized
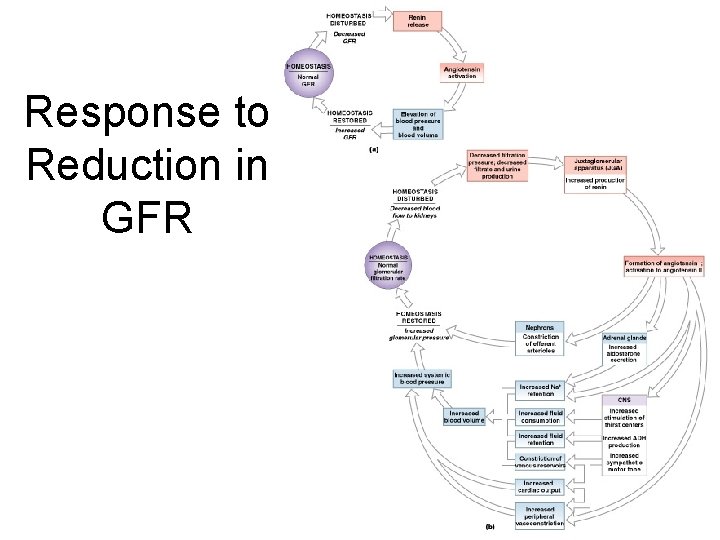
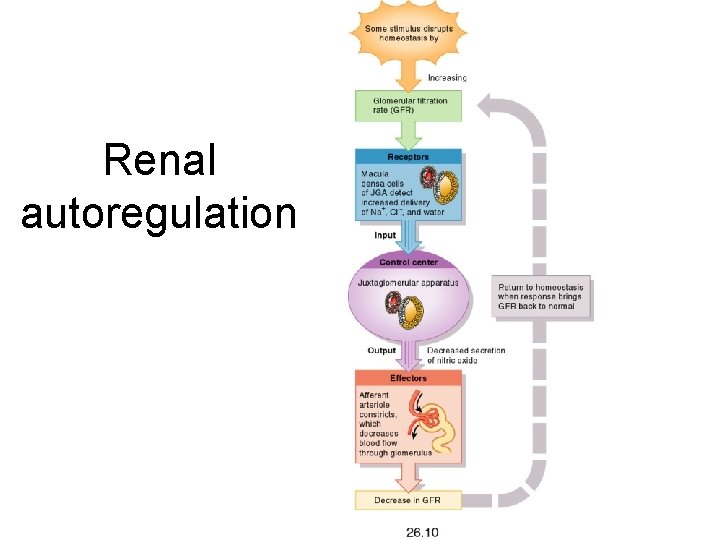
Response to Reduction in GFR Figure 26– 11
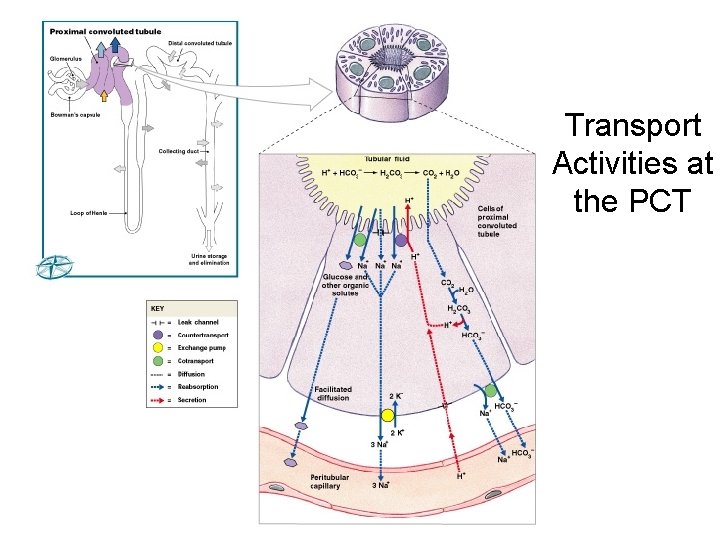
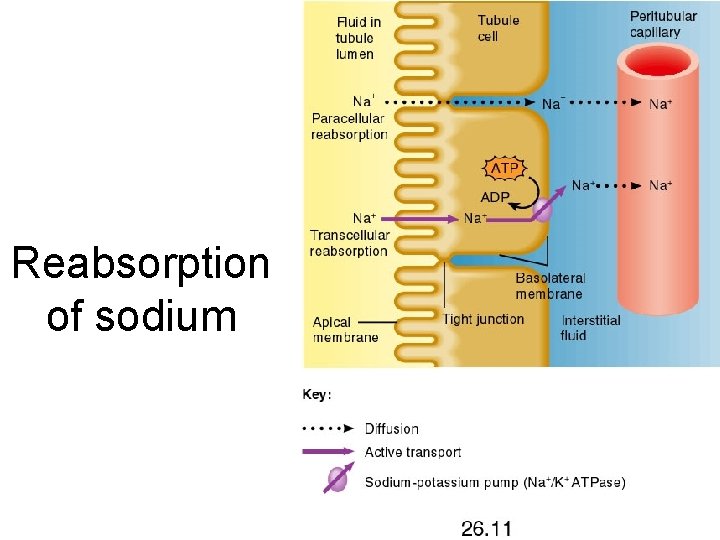
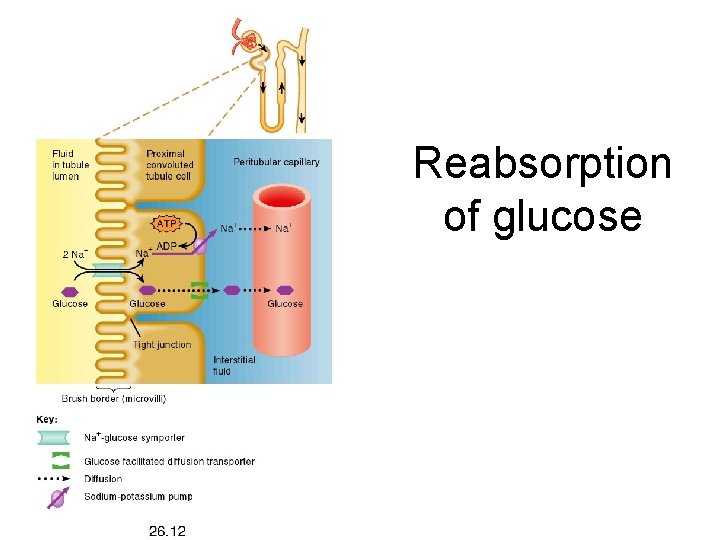
Tubular reabsorption • Reabsorption of filtered solutes occurs in the Proximal Convoluted Tubules. • Most solutes are reabsorbed by secondary active transport with Na+. Does this look familiar?
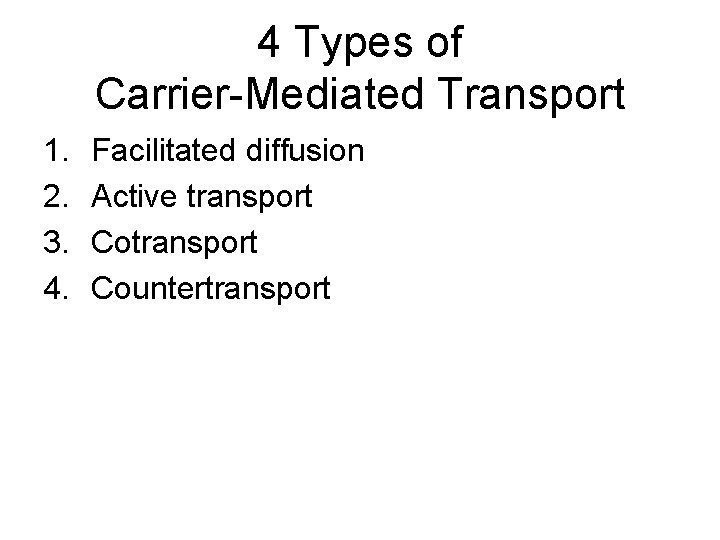
4 Types of Carrier-Mediated Transport 1. 2. 3. 4. Facilitated diffusion Active transport Countertransport
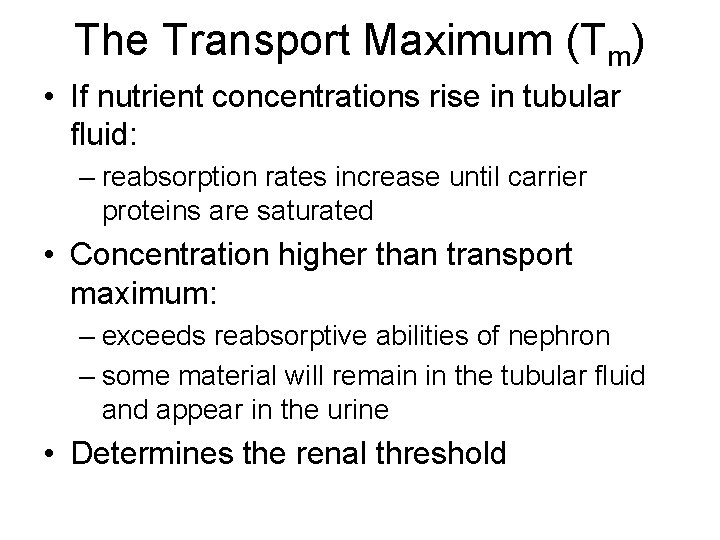
The Transport Maximum (Tm) • If nutrient concentrations rise in tubular fluid: – reabsorption rates increase until carrier proteins are saturated • Concentration higher than transport maximum: – exceeds reabsorptive abilities of nephron – some material will remain in the tubular fluid and appear in the urine • Determines the renal threshold
Transport Activities at the PCT Figure 26– 12 (Navigator)
Reabsorption of sodium
Reabsorption of glucose
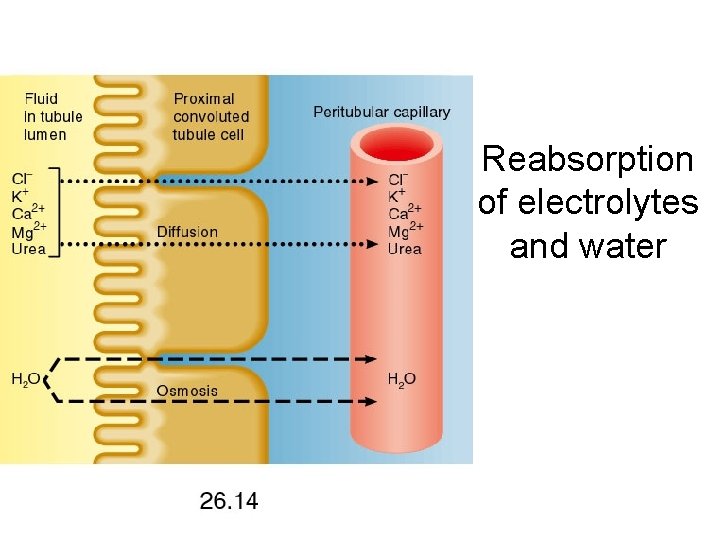
Reabsorption of electrolytes and water
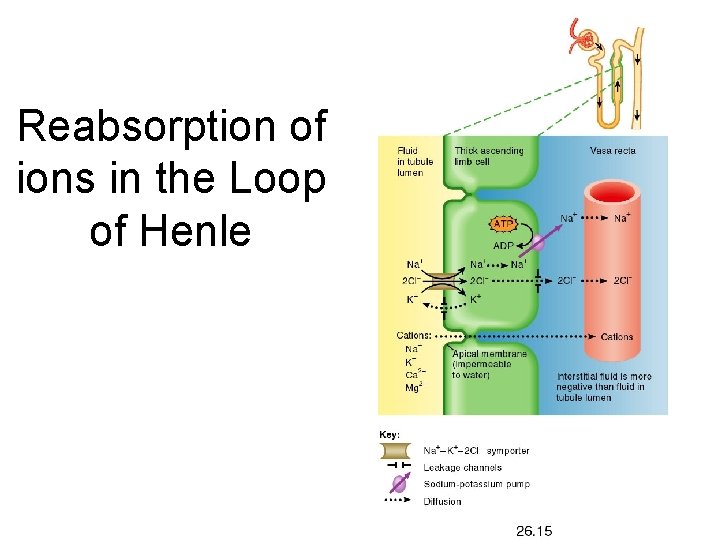
Reabsorption of ions in the Loop of Henle
Reabsorption • 60– 70% of filtrate volume produced at glomerulus: – is reabsorbed before tubular fluid reaches loop of Henle
The Loop of Henle • Reabsorbs about 1/2 of water, and 2/3 of sodium and chloride ions remaining in tubular fluid by the process of countercurrent exchange
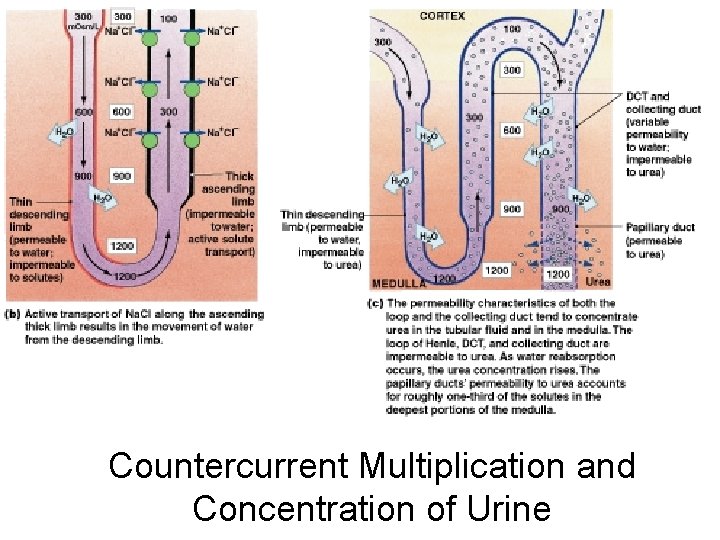
Countercurrent Multiplication • Is exchange that occurs between 2 parallel segments of loop of Henle: – the thin, descending limb – the thick, ascending limb
Countercurrent • Refers to exchange between tubular fluids moving in opposite directions: – fluid in descending limb flows toward renal pelvis – fluid in ascending limb flows toward cortex
Multiplication • Refers to effect of exchange: – increases as movement of fluid continues
Parallel Segments of Loop of Henle • Are very close together, separated only by peritubular fluid • Have very different permeability characteristics
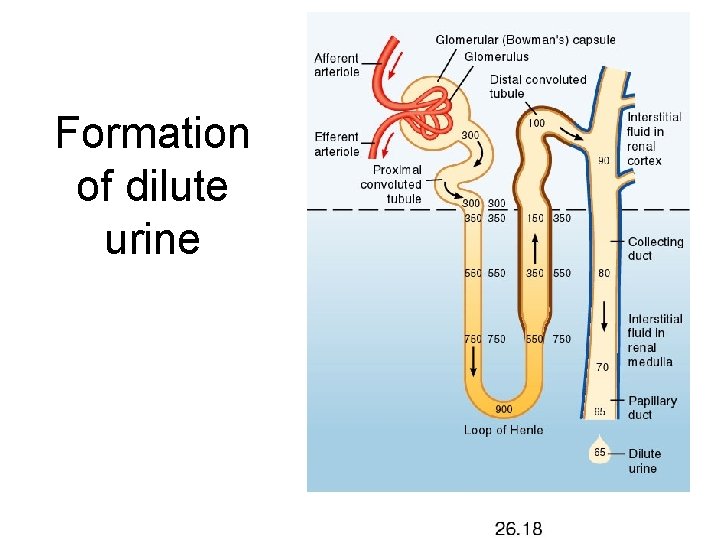
Formation of dilute urine
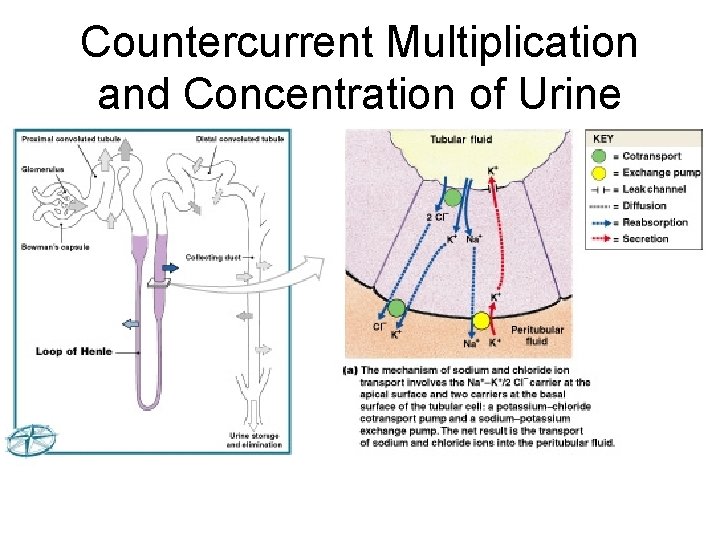
Countercurrent Multiplication and Concentration of Urine Figure 26– 13 a (Navigator)
Countercurrent Multiplication and Concentration of Urine Figure 26– 13 b, c
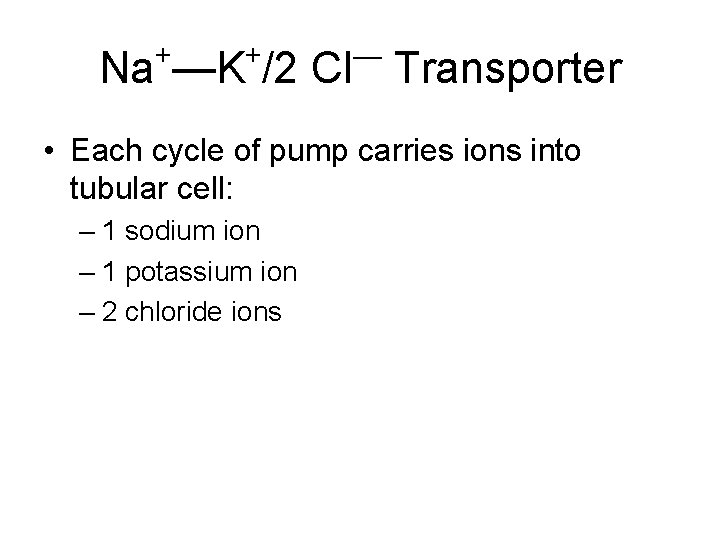
+ + — Na —K /2 Cl Transporter • Each cycle of pump carries ions into tubular cell: – 1 sodium ion – 1 potassium ion – 2 chloride ions
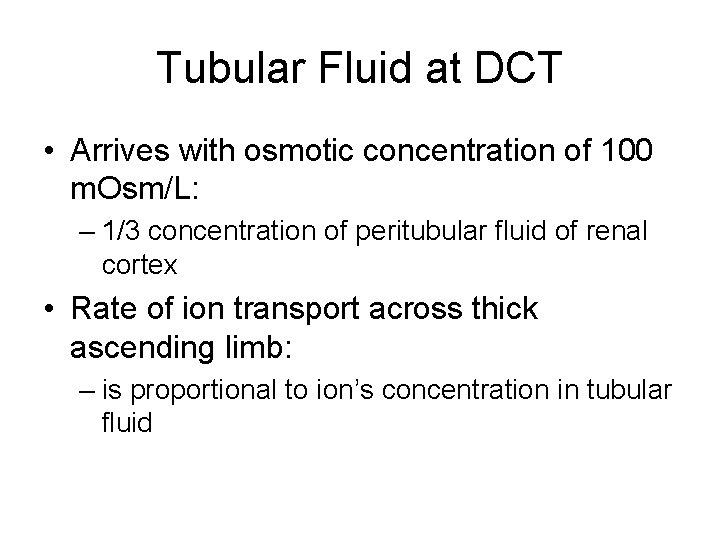
Tubular Fluid at DCT • Arrives with osmotic concentration of 100 m. Osm/L: – 1/3 concentration of peritubular fluid of renal cortex • Rate of ion transport across thick ascending limb: – is proportional to ion’s concentration in tubular fluid
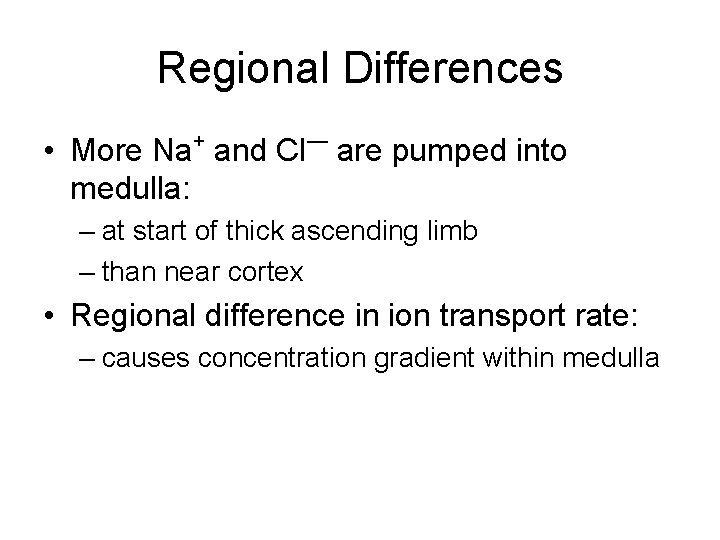
Regional Differences + — • More Na and Cl are pumped into medulla: – at start of thick ascending limb – than near cortex • Regional difference in ion transport rate: – causes concentration gradient within medulla
Normal Maximum Solute Concentration • Of peritubular fluid near turn of loop of Henle: – 1200 m. Osm/L
The Concentration Gradient of the Medulla + — • 2/3 (750 m. Osm/L) from Na and Cl : – pumped out of ascending limb • Remainder from urea
Urea and the Concentration Gradient (1 of 2) • Thick ascending limb of loop of Henle, DCT, and collecting ducts: – are impermeable to urea • As water is reabsorbed: – concentration of urea rises
Urea and the Concentration Gradient (2 of 2) • Tubular fluid reaching papillary duct: – contains 450 m. Osm/L urea • Papillary ducts are permeable to urea: – concentration in medulla averages 450 m. Osm/L
2 Benefits of Countercurrent Multiplication 1. Efficiently reabsorbs solutes and water: – before tubular fluid reaches DCT and collecting system 2. Establishes concentration gradient: – that permits passive reabsorption of water from tubular fluid in collecting system
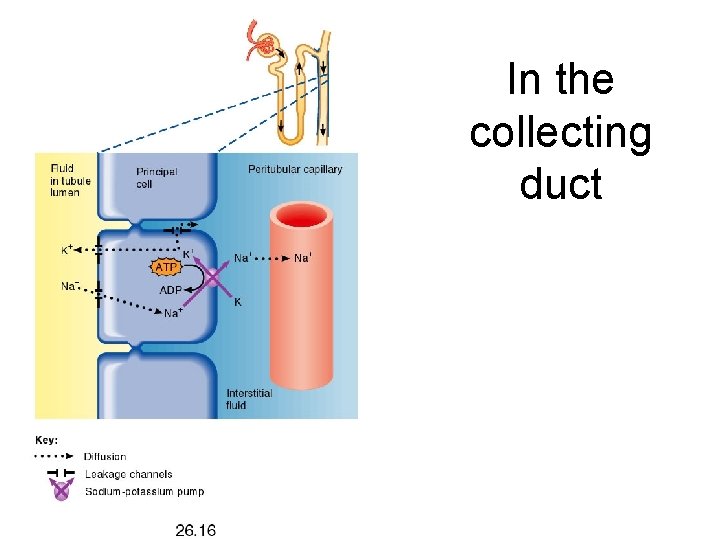
In the collecting duct
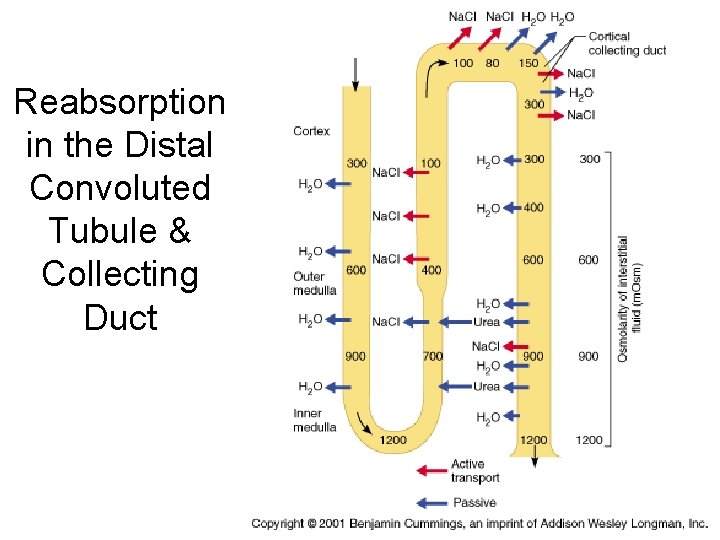
Reabsorption in the Distal Convoluted Tubule & Collecting Duct
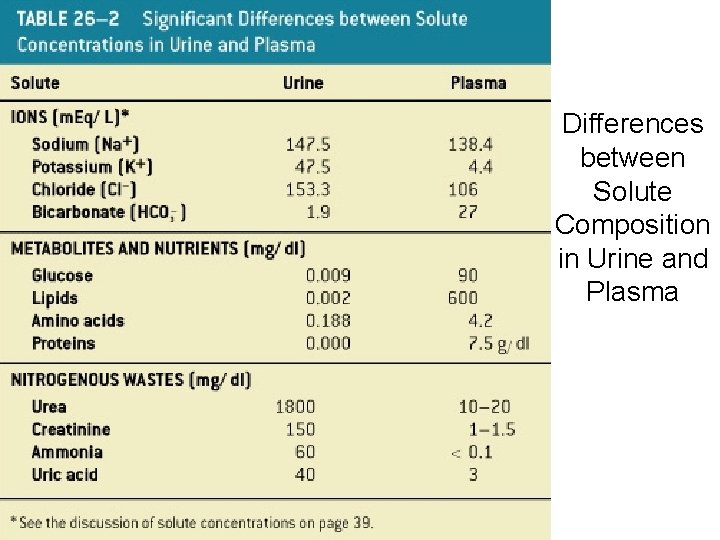
Differences between Solute Composition in Urine and Plasma Table 26– 2
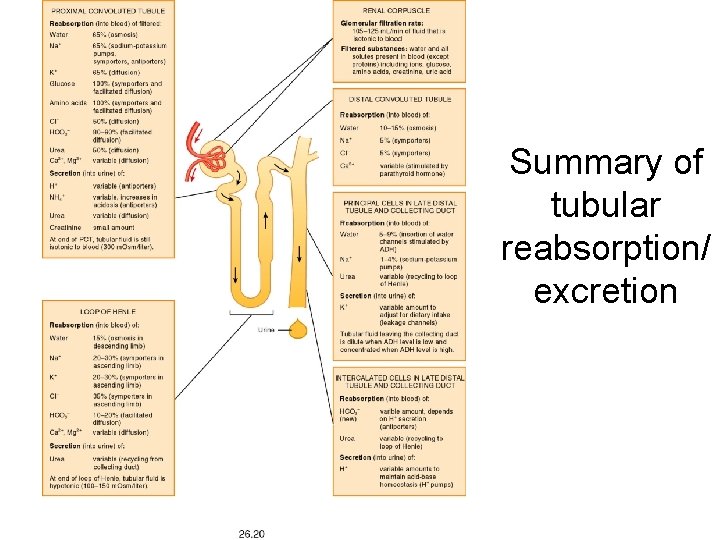
Summary of tubular reabsorption/ excretion
Renal autoregulation
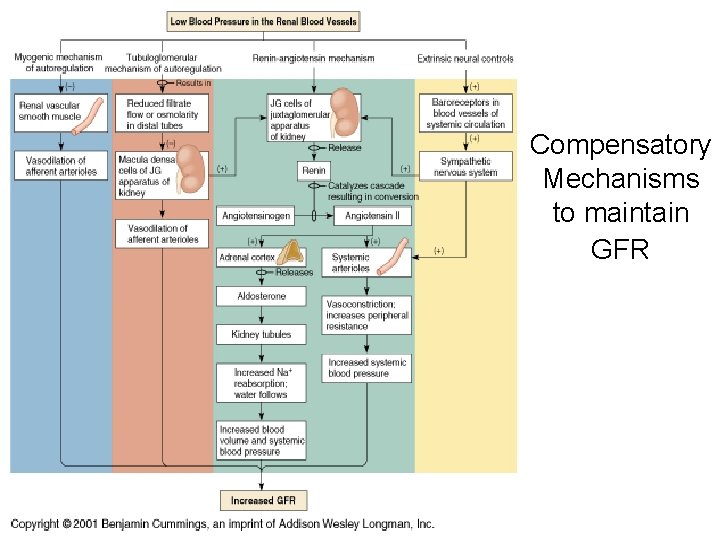
Compensatory Mechanisms to maintain GFR
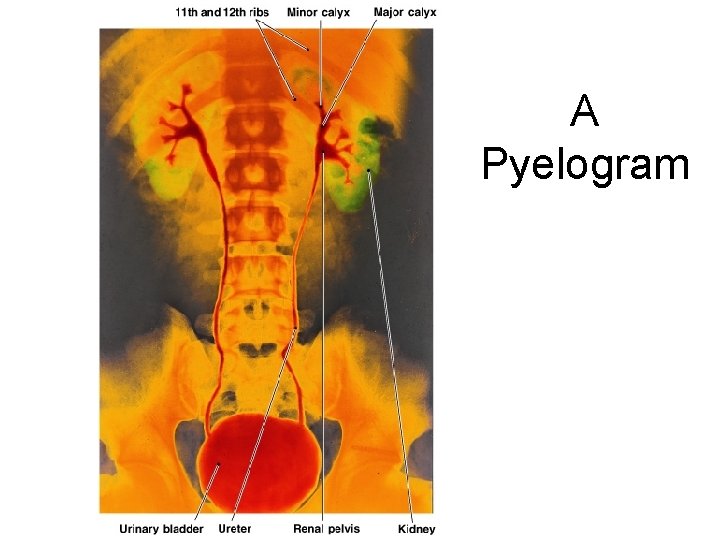
A Pyelogram Figure 26– 17
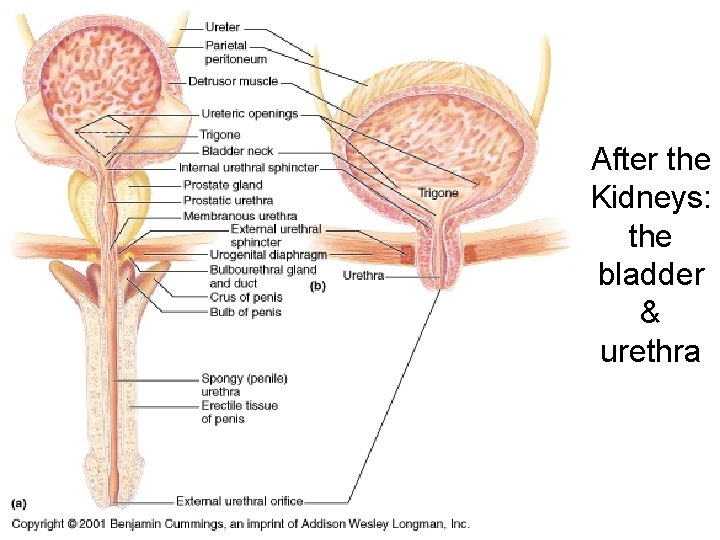
After the Kidneys: the bladder & urethra
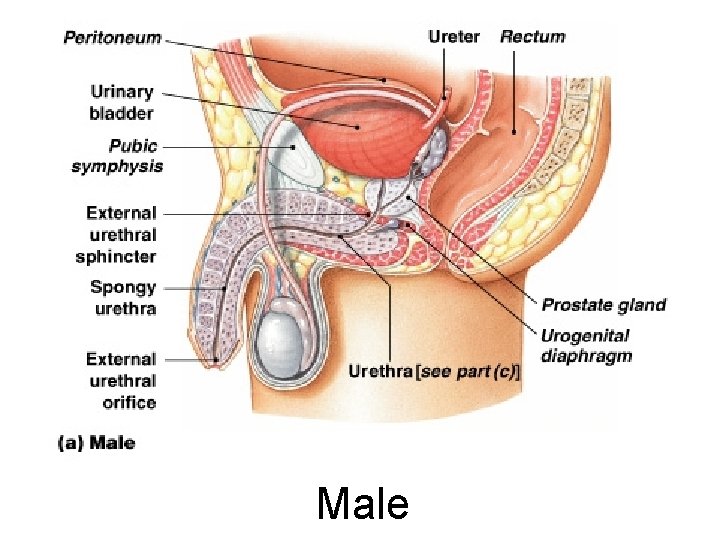
Male Figure 26– 18 a
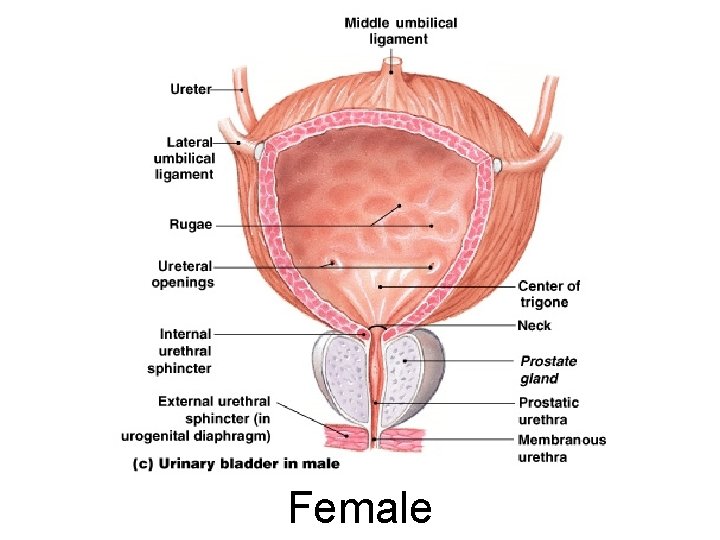
Female Figure 26– 18 c
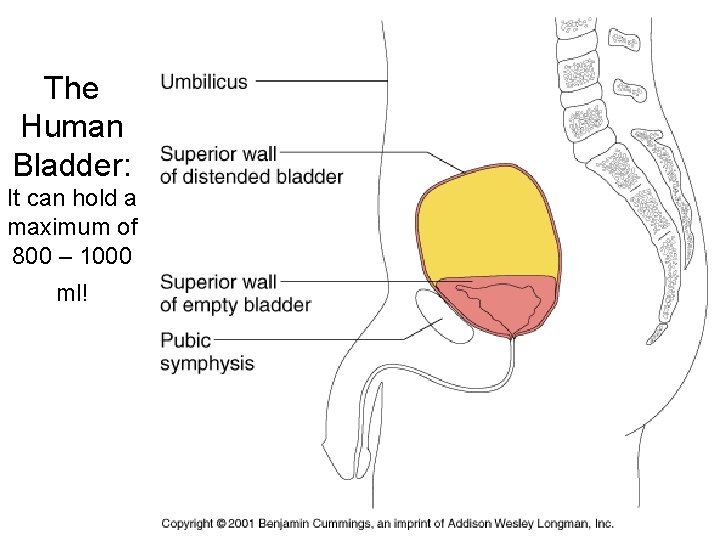
The Human Bladder: It can hold a maximum of 800 – 1000 ml!
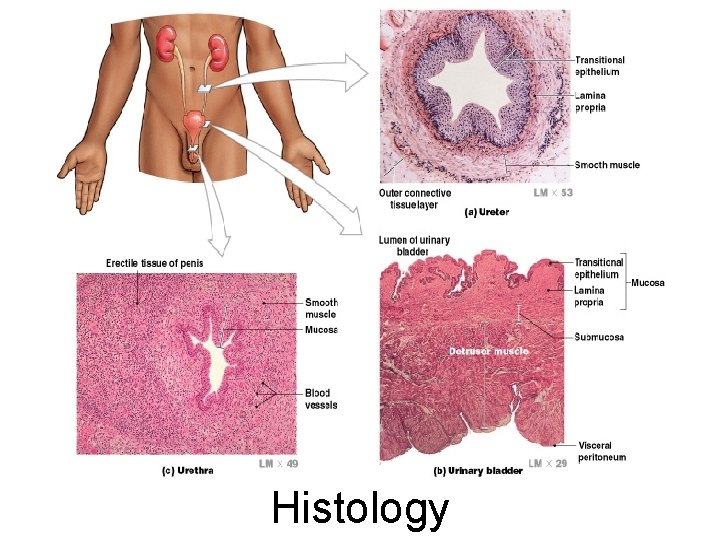
Histology
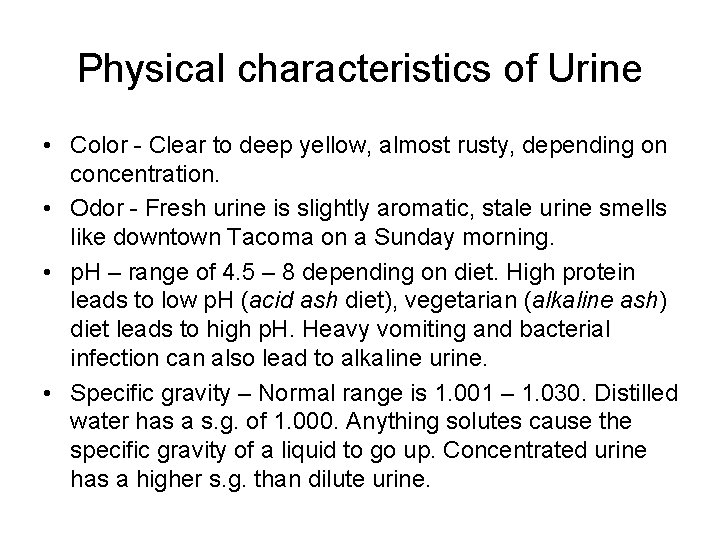
Physical characteristics of Urine • Color - Clear to deep yellow, almost rusty, depending on concentration. • Odor - Fresh urine is slightly aromatic, stale urine smells like downtown Tacoma on a Sunday morning. • p. H – range of 4. 5 – 8 depending on diet. High protein leads to low p. H (acid ash diet), vegetarian (alkaline ash) diet leads to high p. H. Heavy vomiting and bacterial infection can also lead to alkaline urine. • Specific gravity – Normal range is 1. 001 – 1. 030. Distilled water has a s. g. of 1. 000. Anything solutes cause the specific gravity of a liquid to go up. Concentrated urine has a higher s. g. than dilute urine.
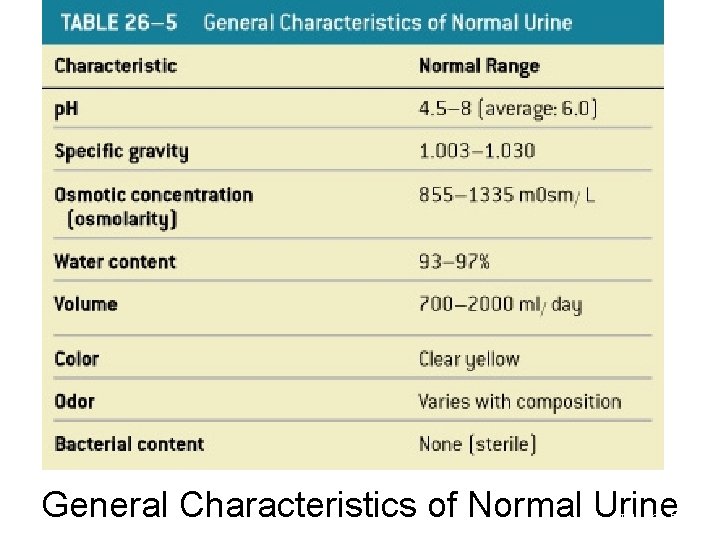
General Characteristics of Normal Urine Table 26– 5
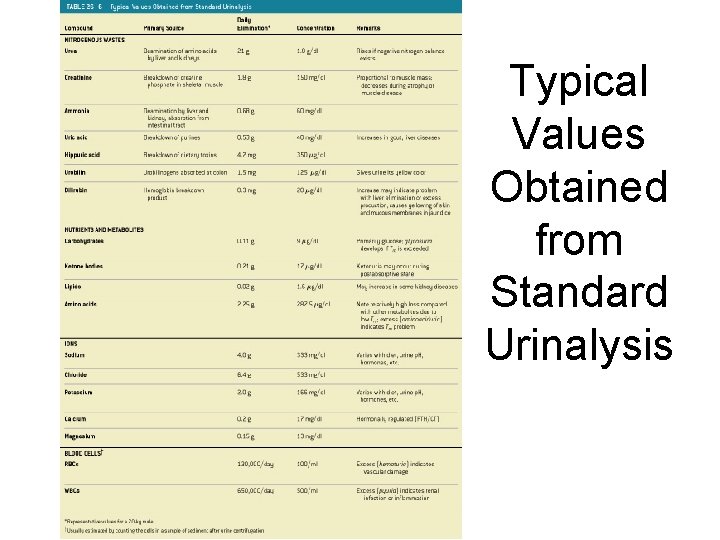
Typical Values Obtained from Standard Urinalysis Table 26– 6
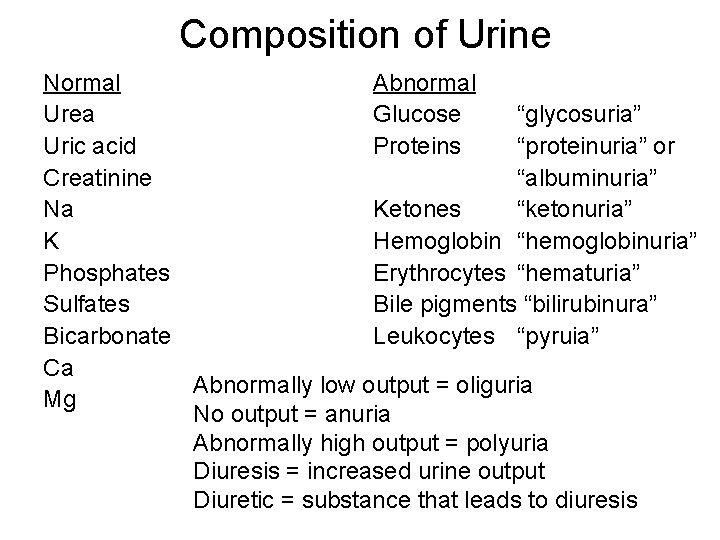
Composition of Urine Normal Abnormal Urea Glucose “glycosuria” Uric acid Proteins “proteinuria” or Creatinine “albuminuria” Na Ketones “ketonuria” K Hemoglobin “hemoglobinuria” Phosphates Erythrocytes “hematuria” Sulfates Bile pigments “bilirubinura” Bicarbonate Leukocytes “pyruia” Ca Abnormally low output = oliguria Mg No output = anuria Abnormally high output = polyuria Diuresis = increased urine output Diuretic = substance that leads to diuresis
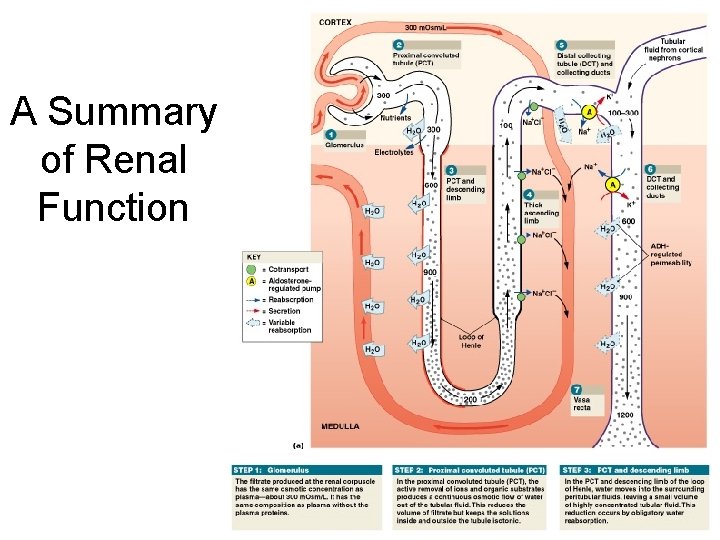
A Summary of Renal Function Figure 26– 16 a
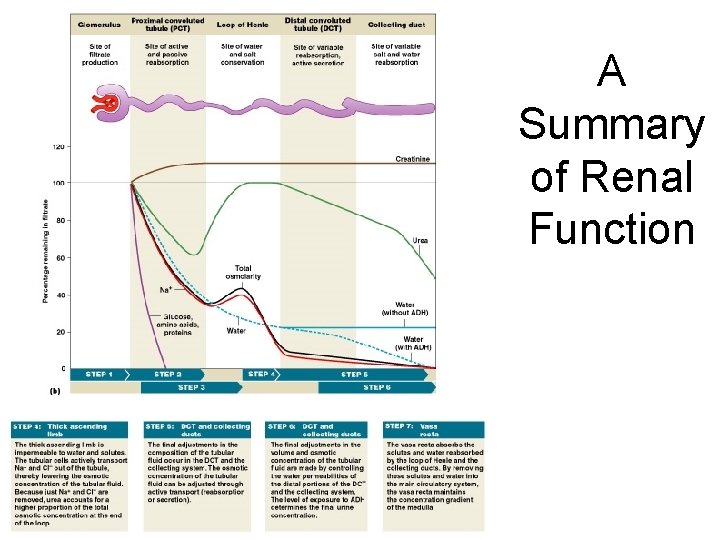
A Summary of Renal Function Figure 26– 16 b
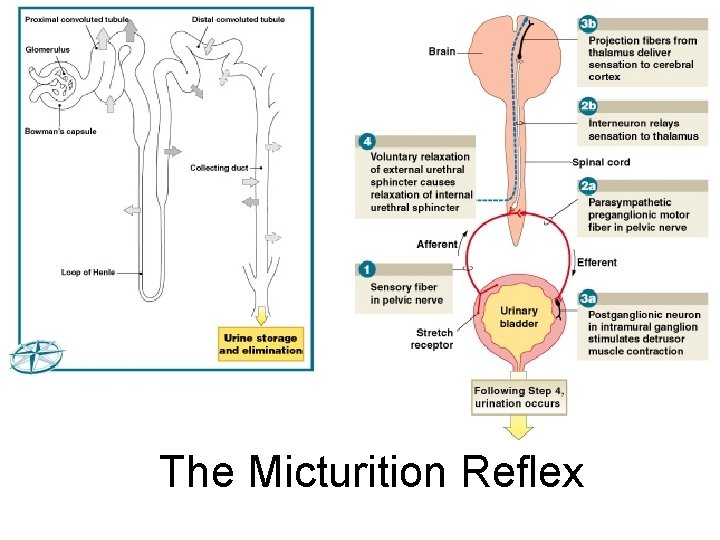
The Micturition Reflex Figure 26– 20 (Navigator)
Incontinence • Is the inability to control urination voluntarily • May be caused by trauma to internal or external urethral sphincter
Age-Related Changes in Urinary System • • Decline in number of functional nephrons Reduction in GFR Reduced sensitivity to ADH Problems with micturition reflex
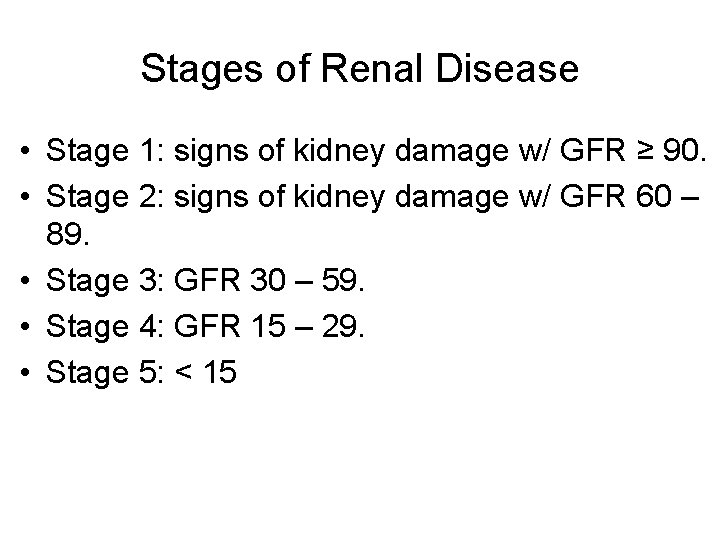
Stages of Renal Disease • Stage 1: signs of kidney damage w/ GFR ≥ 90. • Stage 2: signs of kidney damage w/ GFR 60 – 89. • Stage 3: GFR 30 – 59. • Stage 4: GFR 15 – 29. • Stage 5: < 15
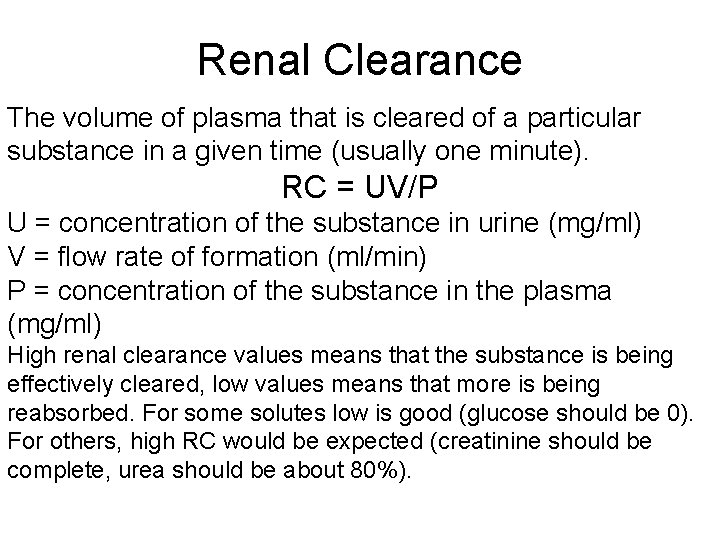
Renal Clearance The volume of plasma that is cleared of a particular substance in a given time (usually one minute). RC = UV/P U = concentration of the substance in urine (mg/ml) V = flow rate of formation (ml/min) P = concentration of the substance in the plasma (mg/ml) High renal clearance values means that the substance is being effectively cleared, low values means that more is being reabsorbed. For some solutes low is good (glucose should be 0). For others, high RC would be expected (creatinine should be complete, urea should be about 80%).
The Excretory System • Includes all systems with excretory functions that affect body fluids composition: – urinary system – integumentary system – respiratory system – digestive system
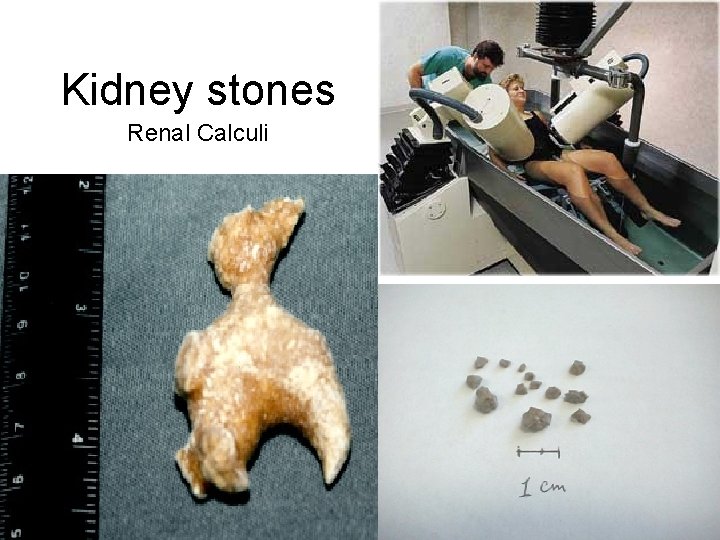
Kidney stones Renal Calculi
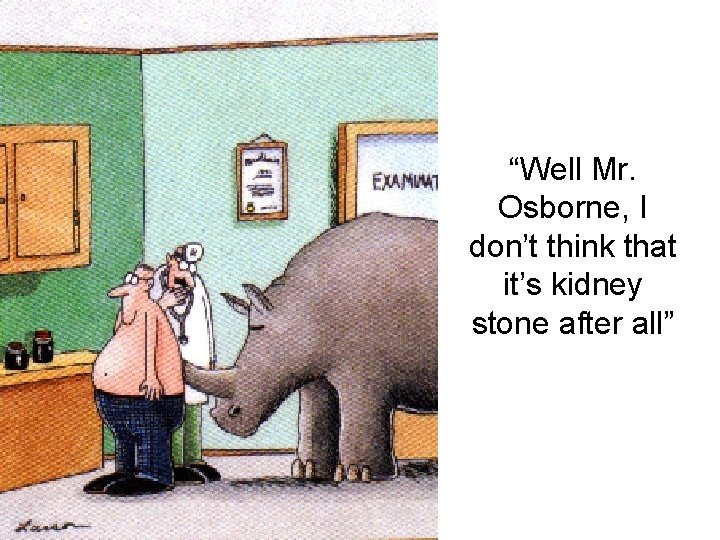
“Well Mr. Osborne, I don’t think that it’s kidney stone after all”