The Unusual Beginning and Ending of Rapid Intensification
 of Rapid Intensification in Hurricane Earl (2010) Kristen Corbosiero,")
The Unusual Beginning (and Ending) of Rapid Intensification in Hurricane Earl (2010) Kristen Corbosiero, John Molinari, Stephanie Stevenson and David Vollaro University at Albany
 •")
Three projects • Rapid intensification of Earl (Corbosiero and grad student Stephanie Stevenson) • End of rapid intensification in Earl (Molinari, Rogers, and Vollaro) • Tropical cyclone outflow layer in preparation for Global Hawk sondes (Molinari, graduate student Patrick Duran, Corbosiero, and Vollaro)

Hurricane Earl: Evolution of intensity & hourly lightning 160 140 0 -500 0 -100 km 8/29 0 Z 1020 1000 980 100 80 960 60 940 40 920 20 0 900 Z 8/ 0 24 Z 8/ 0 25 Z 8/ 0 26 Z Z 8/ 0 27 8/ 0 28 Z 8/ 0 29 Z 8/ 0 30 8/ Z Z Z 0 31 9 0 /2 Z 9 0 /3 Z Z 9 0 /4 9 0 /5 Z 9 0 /6 Pressure (h. Pa) Wind Speed (kt) 120

Hurricane Earl: Lightning Hovmöller 480 -500 H 1 H 2 H 3 H 4 H 3 H 2 440 -460 400 -420 Radial Bin (km) 360 -380 320 -340 280 -300 240 -260 200 -220 160 -180 120 -140 80 -100 40 -60 0 -20 00 12 00 00 12 12 27 Aug 28 Aug 31 Aug 1 Sep 29 Aug 30 Aug 2 Sep Time 00 3 Sep

Motivation: Radial & azimuthal distribution of lightning • Lightning is overwhelmingly downshear to downshear left in the inner core (r < 100 km), and downshear right in the rainbands (Corbosiero and Molinari 2003; Abarca et al. 2011)

Hurricane Earl: Lightning with respect to vertical wind shear • 100 -500 km: Flashes are overwhelmingly downshear right • 0 -100 km: Flashes are predominantly upshear left • Little difference between GFS (SHIPS) and ERA-Interim shears

Upshear Convective Burst: IR imagery 18 UTC 8/28

Upshear Convective Burst: IR imagery 00 UTC 8/29

Upshear Convective Burst: IR Imagery + Lightning One hour of lightning 00 UTC 8/29 50 km range rings

Questions regarding beginning of RI • Earl contained more flashes than any other storm. Why? 36 hours of RI, apparently little SST change (Shay) • Why continued rapid deepening when outer bands were so active? • Why was intense convection upshear? Could this relate to unusual vortex tilt vs the ambient shear direction? Could this have played a role in allowing RI in the presence of surprisingly large ambient shear?

Third project: outflow layer structure in preparation for Global Hawk sondes • Makes use of 2963 G-IV sondes interpolated to 100 m levels • Useful data begins about 175 h. Pa, thus might not capture entire outflow layer in strong storms (but Global Hawk sondes will!) • We will show bulk Richardson number

RB is calculated over 400 -m layers RB has no critical value, but turbulence is possible for RB < 1 and certain for RB < 0. 25 We will show percentage of sondes meeting above conditions as a function of height, and show separate contributions of the numerator and denominator
 and < 1 (red)")
Percentage of RB < 0. 25 (cyan) and < 1 (red)
,")
To examine the nature of these low-RB layers, we will look at Ivan (2004), which had nearly 400 G-IV sondes The frequency of the turbulence criterion (RB < 0. 25) being met is three times larger in Ivan than for the data set as a whole We will show sonde location on a satellite picture, a Skew T plot, and the vertical variation of the numerator and denominator in the RB definition

Sept 6, 2156 UTC Magenta “X”: drop Location blue: temperature red: dew point magenta band: RB < 0. 25 blue: stability term green: shear term

Sept 7, 2057 UTC Magenta “X”: drop location blue: temperature red: dew point magenta band: RB < 0. 25 blue: stability term green: shear term

Sept 9, 1926 UTC Magenta “X”: drop location blue: temperature red: dew point magenta band: RB < 0. 25 blue: stability term green: shear term
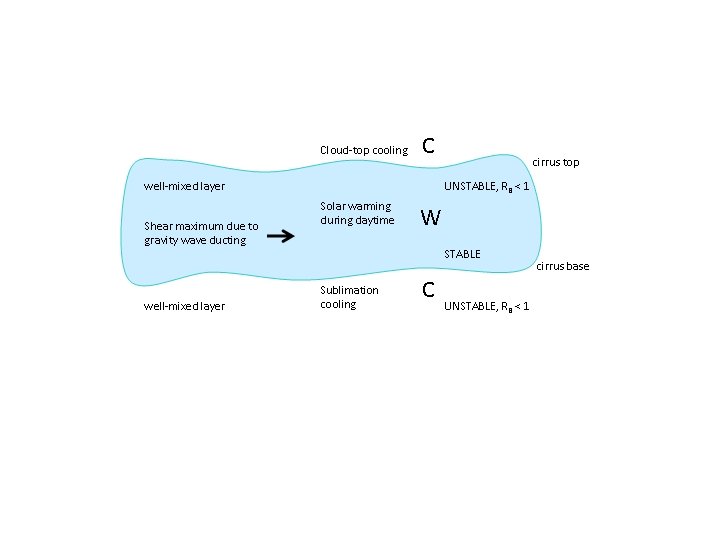

These three sets of plots show a frequent occurrence of low Richardson number: • Occurs when a well-defined cirrus base exists with relatively dry air underneath • A stable layer exists near cloud base • A near dry-neutral layer exists below the stable layer • A near dry neutral layer also occurs above cloud base. This might be near cloud top, but relative humidity measurements are not usually available to confirm cloud top

5. Low RB occurs within the low-stability layers 6. A sharp shear maximum, often exceeding 20 m s-1 km-1, occurs directly above the stable layer. We speculate this is due to gravity wave ducting in the stable layer

SUMMARY • The cirrus deck creates its own stability field as a result of cloud-top cooling, diabatic warming (during the day), and sublimation underneath • Gravity waves, which are almost always present in tropical cyclone simulations (F. Zhang, personal communication) and likely in nature as well, appear to be ducted by the existing stable layer. We hypothesize that this creates the shear maximum
 does not appear to be associated with")
• Turbulence (RB < 0. 25) does not appear to be associated with the large shear layers, but rather is found largely in the near dry adiabatic layers associated with instability and mixing driven by cirrus diabatic effects. The shear layers do have RB < 1 almost always • Global Hawk sondes will see the entire cirrus layer! • The Global Hawk is perfectly suited to observe the outflow layer because it covers so much area and can release multiple sondes
- Slides: 22