The University of the State of New York


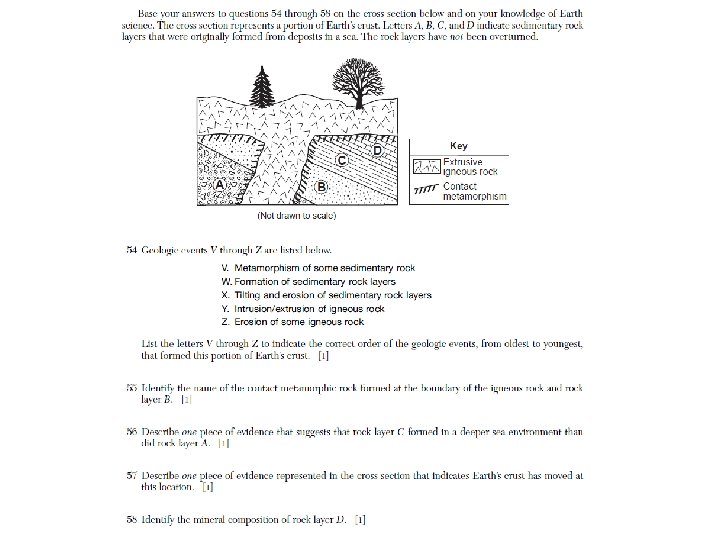
 of surface bedrock in a desert region is the")


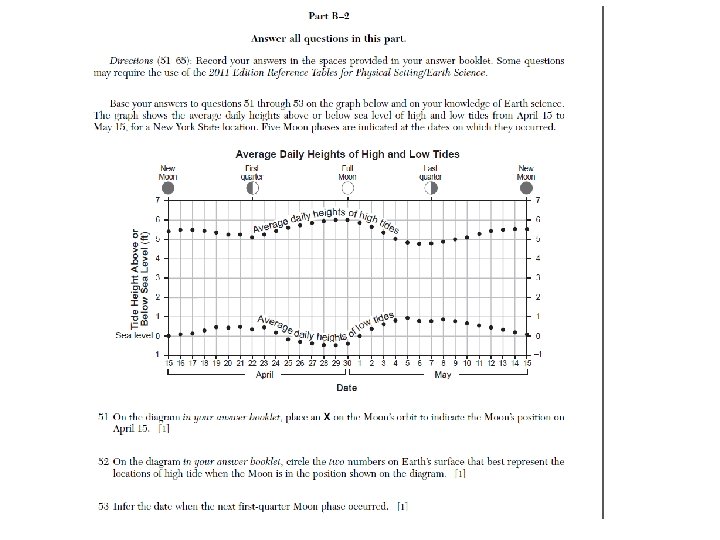
 does it take Earth to travel from position")


- Slides: 60
The University of the State of New York REGENTS HIGH SCHOOL EXAMINATION PHYSICAL SETTING EARTH SCIENCE Jan 2015
1 The theory that the universe is expanding is supported by data from the 1. nuclear decay of radioactive materials 2. nuclear fusion of radioactive materials 3. blue shift of light from distant galaxies 4. red shift of light from distant galaxies Table
2 The photograph below shows a feature of the universe as seen through a telescope. This feature is best identified as 1. 2. 3. 4. a galaxy a comet an asteroid a star Table
3 Fourteen billion years represents the approximate age of 1. 2. 3. 4. Earth’s Moon our solar system the universe Table
4 Which terms describe the motion of most objects in our solar system? 1. noncyclic and unpredictable 2. noncyclic and predictable 3. cyclic and unpredictable 4. cyclic and predictable Table
5 Which planet has completed less than one orbit of the Sun in the last 100 years? 1. 2. 3. 4. Mars Mercury Neptune Uranus Table
6 Compared to the size and density of Earth, the Moon has a 1. smaller diameter and lower density 2. smaller diameter and higher density 3. larger diameter and lower density 4. larger diameter and higher density Table
7 In the Northern Hemisphere, planetary winds are deflected to the right due to the 1. 2. 3. 4. Doppler effect Coriolis effect tilt of Earth’s axis uneven heating of Earth’s surface Table
8 Which event is inferred to have contributed to the significant global climate change that may have caused the mass extinctions of organisms at the end of the Late Cretaceous Epoch? 1. 2. 3. 4. the Big Bang an asteroid impact formation of Pangaea shifting of Earth’s magnetic poles Table
9 The diagram below represents the placoderm fish Bothriolepis, an index fossil found in New York State. The surface bedrock at which location is most likely to contain this fossil? 1. 2. 3. 4. Ithaca Old Forge Albany New York City Table
10 The geologic cross section below includes an unconformity and an igneous intrusion. Which two events produced the geologic unconformity in the rock record? 1. 2. 3. 4. intrusion of magma, followed by contact metamorphism intrusion of magma, followed by erosion of rock layers, followed by deposition of more sediments erosion of rock layers, followed by intrusion of magma Table
11 Which map best represents the surface wind pattern around Northern Hemisphere high-pressure and lowpressure centers? 1. 2. 3. 4. (1) (2) (3) (4) Table
12 What is the dewpoint when the dry-bulb temperature is 12°C and the wet-bulb temperature is 7°C? 1. 2. 3. 4. 1°C -5°C 28°C 48°C Table
13 The station model below shows some weather conditions at a location on Earth’s surface. Which present weather symbol represents the most likely type of precipitation occurring at this location? 1. 2. 3. 4. (1) (2) (3) (4) Table
14 In which atmospheric temperature zone does most precipitation occur? 1. 2. 3. 4. thermosphere mesosphere stratosphere troposphere Table
15 Which tectonic feature is associated with a complex or uncertain plate boundary? 1. 2. 3. 4. Southwest Indian Ridge East African Rift Mariana Trench Galapagos Hot Spot Table
16 Which types of surface bedrock are most likely found near Jamestown, New York? 1. 2. 3. 4. slate and marble quartzite and granite shale and sandstone schist and gneiss Table
17 The map of North America below shows the source region of an air mass forming mostly over Mexico. This air mass originating over Mexico is classified as 1. 2. 3. 4. continental polar continental tropical maritime polar maritime tropical Table
18 Which cross section best represents the valley shape where a rapidly flowing stream is cutting into the bedrock in a mountainous area? 1. 2. 3. 4. (1) (2) (3) (4) Table
19 The photograph below shows scratched and grooved bedrock with boulders on its surface. The scratches and grooves were most likely created when 1. alternating thawing and freezing of water cracked the bedrock 2. flooding from a nearby lake covered the bedrock 3. a glacier dragged rocks over the bedrock 4. rocks from a landslide slid along the bedrock Table
20 The natural sandblasting (abrasion) of surface bedrock in a desert region is the result of 1. 2. 3. 4. wind erosion wave erosion mass movement chemical precipitation Table
21 Which group of substances is arranged in order of decreasing specific heat values? 1. 2. 3. 4. iron, granite, basalt copper, lead, iron dry air, water vapor, ice liquid water, ice, water vapor Table
22 The minerals talc, muscovite mica, quartz, and olivine are similar because they 1. 2. 3. 4. have the same hardness are the same color contain silicon and oxygen break along cleavage planes Table
23 The photograph below shows Mt. Kilimanjaro, a volcano in Africa, located near the equator. Which climate factor is responsible for the snow seen on Mt. Kilimanjaro? 1. high latitude 2. high elevation 3. nearness to a cold ocean current 4. nearness to a high-pressure weather center Table
24 The photograph below shows a large outcrop of rock composed primarily of visible crystals of mica, quartz, and feldspar. Based on the composition and foliated texture, this rock can best be identified as 1. 2. 3. 4. marble schist slate anthracite coal Table
25 Which diagram best represents the regions of Earth in sunlight on June 21 and December 21? [NP indicates the North Pole and the shading represents Earth’s night side. Diagrams are not drawn to scale. ] 1. 2. 3. 4. (1) (2) (3) (4) Table
26 The diagram below represents three identical beakers, A, B, and C, each containing an equal volume of uniform-sized spherical beads. Water is poured into each beaker until all of the pore spaces are filled. 1. 2. 3. 4. (1) (2) (3) (4) Table
27 The timeline below represents time on Earth from the beginning of the Paleozoic Era (A) to the present (B). Which numbered position best represents the time when humans first appeared in the fossil record? 1. 2. 3. 4. (1) (2) (3) (4) Table
28 The cross sections below represent three outcrops, labeled I, II, and III, containing some New York State index fossils. The rock layers have not been overturned. When the rock layers in the three outcrops are correlated, the oldest layer is the 1. shale layer in outcrop I 2. siltstone layer in outcrop II 3. limestone layer in outcrop III 4. conglomerate layer in outcrop III Table
29 A bar graph of the radioactive decay of carbon-14 is shown below. The solid black sections of the bars on the graph represent the percentages of 1. carbon-14 from the original sample that has not decayed 2. uranium-238 from the original sample that has not decayed 3. nitrogen-14 decay product resulting from the radioactive decay 4. lead-206 decay product resulting from the radioactive decay Table
30 Which weather instrument is used to determine wind direction? 1. 2. 3. 4. (1) (2) (3) (4) Table
31 Which bar graph best shows the percent by volume of the elements that make up Earth’s hydrosphere? 1. 2. 3. 4. (1) (2) (3) (4) Table
32 Four locations, A, B, C, and D, are represented on the topographic map below. Which lettered location has the highest elevation? 1. 2. 3. 4. A B C D Table
33 Which cross section best represents how surface winds form by midafternoon near a shoreline on a hot summer day? [Diagrams are not drawn to scale. ] 1. 2. 3. 4. (1) (2) (3) (4) Table
34 The cross section below represents a prevailing wind flow that causes different climates on the windward and leeward sides of a mountain range. Compared to the temperature and moisture of the air rising on the windward side, the temperature and moisture of the air descending at the same altitude on the leeward side will be 1. 2. 3. 4. warmer and drier warmer and more moist cooler and drier cooler and more moist Table
35 The diagram of Bowen’s Reaction Series below indicates the relative temperatures at which specific minerals crystallize as magma cools. Which statement is best supported by Bowen’s Reaction Series? 1. Most minerals crystallize at the same temperature. 2. Most felsic minerals usually crystallize before most mafic minerals. 3. Muscovite mica and quartz are the last minerals to crystallize as magma cools. 4. Biotite mica is the first mineral to crystallize as magma cools. Table
36 Approximately how many days (d) does it take Earth to travel from position A to position C? 1. 2. 3. 4. 91 d 182 d 274 d 365 d Table
37 Since Earth has an elliptical orbit, the 1. distance between the Sun and Earth varies 2. distance between the Sun and the other focus varies 3. length of Earth’s major axis varies 4. length of Earth’s period of revolution varies Table
38 At positions A, B, C, and D, the north end of Earth’s axis of rotation is pointing toward 1. Betelgeuse 2. Polaris 3. the center of the Milky Way 4. the center of our solar system Table
39 The constellation Orion is visible at night in New York State when Earth is at position A, but not at position C because Earth’s 1. nighttime is shorter when Earth is at position A 2. period of rotation is shorter than its period of revolution 3. distance to Orion is too great for the constellation to be seen 4. (4) nighttime side is facing toward a different portion of space Table
40 At which two positions will an observer in New York State experience approximately 12 hours of daylight during one rotation of Earth? 1. 2. 3. 4. A and B A and C B and D Table
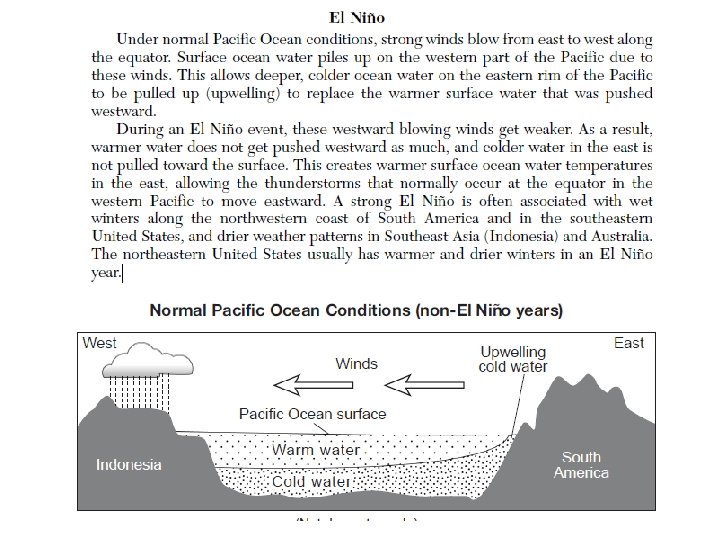
41 Which statement best describes the planetary wind belts that produce the winds represented in the cross section above? 1. Southwest and northwest winds diverge at the equator and blow toward the west. 2. Southwest and northwest winds diverge at the equator and blow toward the east. 3. Northeast and southeast winds converge at the equator and blow toward the west. 4. Northeast and southeast winds converge at the equator and blow toward the east. Table
42 Compared to non-El Niño years, which climatic conditions exist near the equator on the western and eastern sides of the Pacific Ocean during an El Niño event? 1. The western Pacific is drier and the eastern Pacific is wetter. 2. The western Pacific is wetter and the eastern Pacific is drier. 3. The western and the eastern Pacific are both wetter. 4. The western and the eastern Pacific are both drier. Table
43 Which cross section best represents the changed wind conditions and Pacific Ocean temperatures during an El Niño event? [Diagrams are not drawn to scale. ] 1. 2. 3. 4. (1) (2) (3) (4) Table
44 During an El Niño year, winter climatic conditions in New York State will most likely be 1. 2. 3. 4. colder and wetter colder and drier warmer and wetter warmer and drier Table
45 Which data best describe the depth below Earth’s surface and the density of Earth’s interior at location W? 1. Depth: 600 km Density: changes from 3. 4 g/cm 3 to 5. 6 g/cm 3 2. Depth: 1000 km Density: averages 4. 5 g/cm 3 3. Depth: 2900 km Density: changes from 5. 6 g/cm 3 to 9. 9 g/cm 3 4. Depth: 5100 km Density: averages 11. 1 g/cm 3 Table
46 Which statement best explains why no S-waves were received directly from this earthquake at some seismic stations? 1. An interior Earth layer absorbs S-waves. 2. Earth’s mantle reflects Swaves. 3. S-waves travel slower than Pwaves. 4. S-waves travel only on Earth’s surface. Table
47 The diagram below represents the seismograms of this earthquake recorded at seismic stations X, Y, and Z. 1. 2. 3. 4. (1) (2) (3) (4) Table
48 Organism A is a labyrinthodont and is most likely classified as: ? The drawing represents a swamp-forest environment that existed in North America at the base of the Acadian Mountains during the Carboniferous Period. Organism A lived in this swamp-forest. 1. 2. 3. 4. a mastodont an amphibian a dinosaur a mammal Table
49 The Acadian Mountains were formed as a result of the collision between North America and: ? The drawing represents a swamp-forest environment that existed in North America at the base of the Acadian Mountains during the Carboniferous Period. Organism A lived in this swamp-forest. 1. 2. 3. 4. Avalon South America Pangaea Queenston Delta Table
50 At the time represented by this drawing, the region now known as New York State was inferred to be located: ? The drawing represents a swamp-forest environment that existed in North America at the base of the Acadian Mountains during the Carboniferous Period. Organism A lived in this swamp-forest. 1. 2. 3. 4. at 45° S latitude at 45° N latitude near the equator near the North Pole Table