
The U S Food and Fiber Industry Chapter

The U. S. Food and Fiber Industry Chapter 2

CHAPTER 2: TOPICS OF DISCUSSION Indices and nominal versus real values What is the food and fiber Industry? Changing complexion of production agriculture Physical structure Productivity Profitability Financial structure Sectors within the Food and Fiber Industry Farm input suppliers Food processors, wholesalers and retailers Value added process
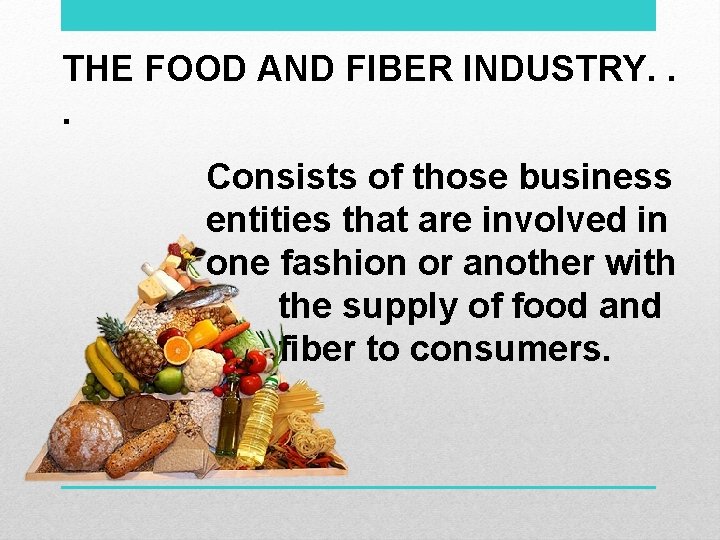
THE FOOD AND FIBER INDUSTRY. . . Consists of those business entities that are involved in one fashion or another with the supply of food and fiber to consumers.
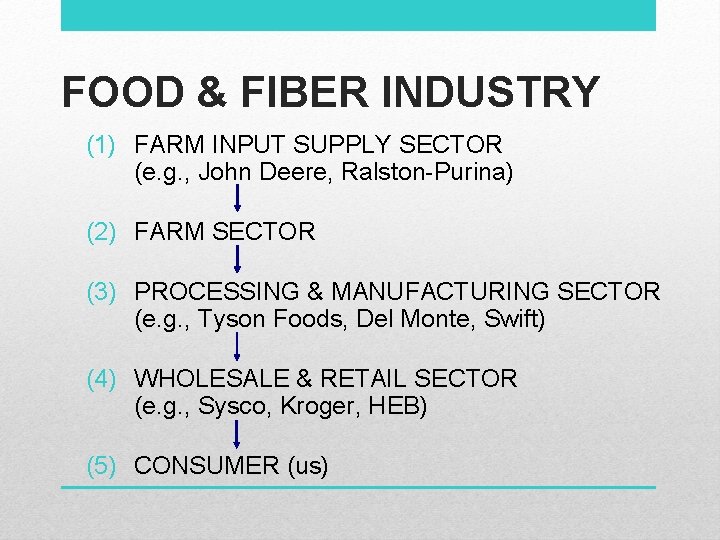
FOOD & FIBER INDUSTRY (1) FARM INPUT SUPPLY SECTOR (e. g. , John Deere, Ralston-Purina) (2) FARM SECTOR (3) PROCESSING & MANUFACTURING SECTOR (e. g. , Tyson Foods, Del Monte, Swift) (4) WHOLESALE & RETAIL SECTOR (e. g. , Sysco, Kroger, HEB) (5) CONSUMER (us)
1 out of every 6 jobs is tied to the food and fiber industry Responsible for roughly 12 to 15 percent of GDP
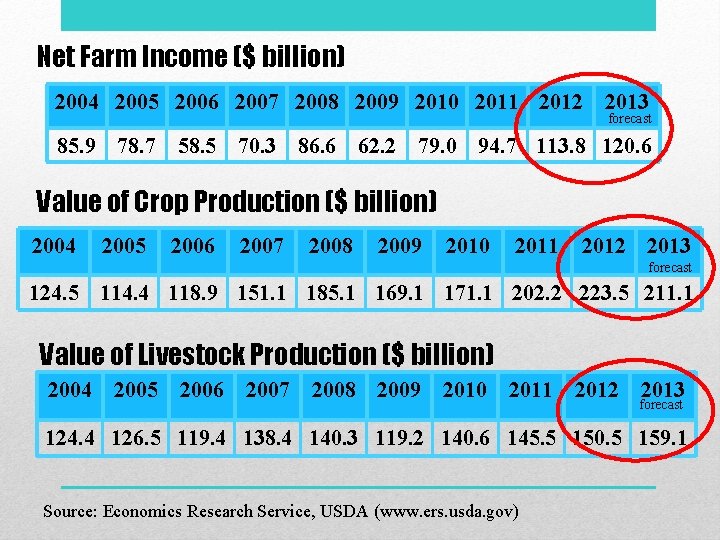
Net Farm Income ($ billion) 2004 2005 2006 2007 2008 2009 2010 2011 2012 2013 forecast 85. 9 78. 7 58. 5 70. 3 86. 6 62. 2 79. 0 94. 7 113. 8 120. 6 Value of Crop Production ($ billion) 2004 2005 2006 2007 2008 2009 2010 2011 2012 2013 forecast 124. 5 114. 4 118. 9 151. 1 185. 1 169. 1 171. 1 202. 2 223. 5 211. 1 Value of Livestock Production ($ billion) 2004 2005 2006 2007 2008 2009 2010 2011 2012 2013 forecast 124. 4 126. 5 119. 4 138. 4 140. 3 119. 2 140. 6 145. 5 150. 5 159. 1 Source: Economics Research Service, USDA (www. ers. usda. gov)
Some Key Measurement Topics Output and Price Indices Nominal and Real Expenditures
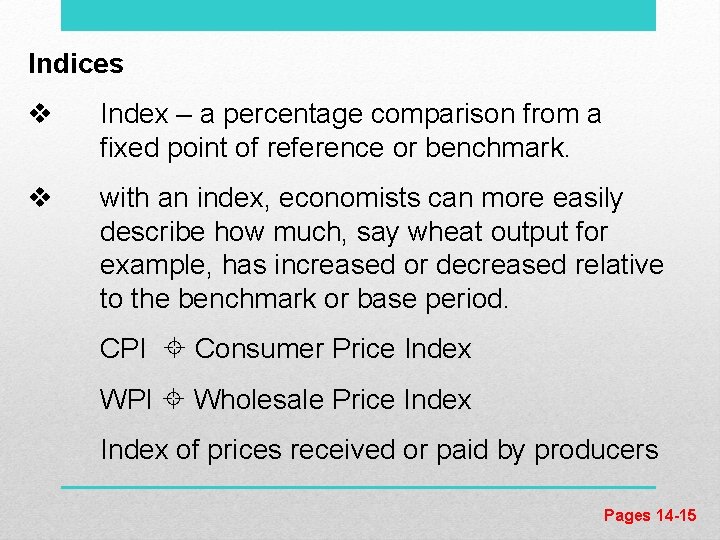
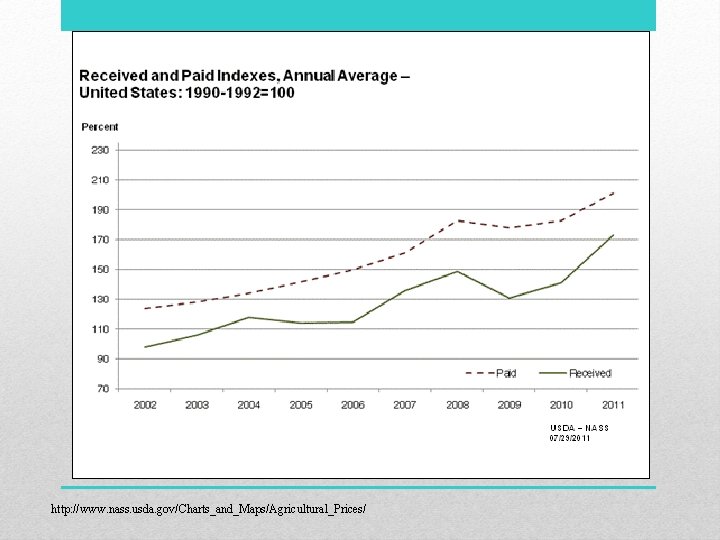
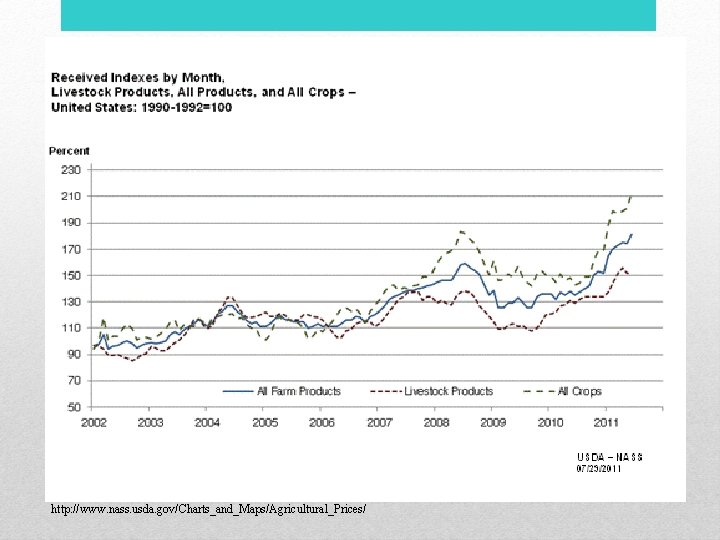
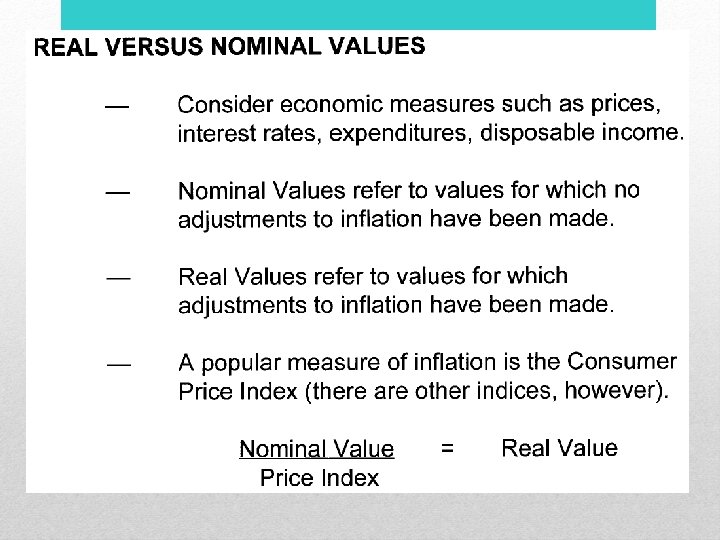
Indices v Index – a percentage comparison from a fixed point of reference or benchmark. v with an index, economists can more easily describe how much, say wheat output for example, has increased or decreased relative to the benchmark or base period. CPI Consumer Price Index WPI Wholesale Price Index of prices received or paid by producers Pages 14 -15
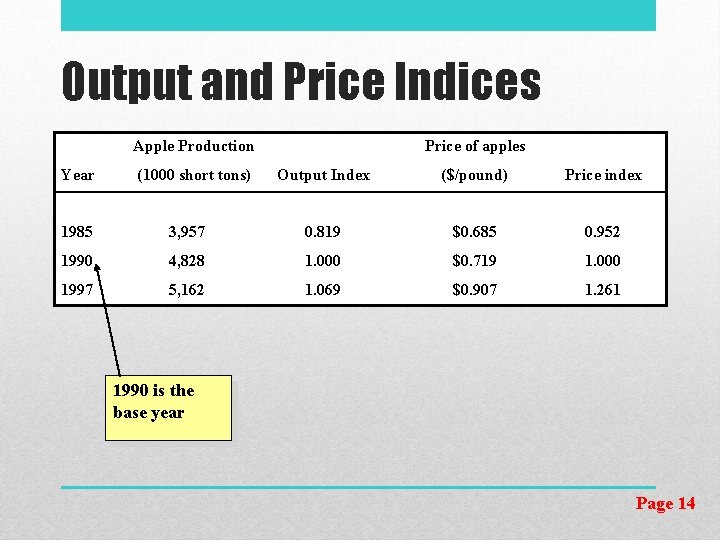
Output and Price Indices Apple Production Year (1000 short tons) Price of apples Output Index ($/pound) Price index 1985 3, 957 0. 819 $0. 685 0. 952 1990 4, 828 1. 000 $0. 719 1. 000 1997 5, 162 1. 069 $0. 907 1. 261 1990 is the base year Page 14
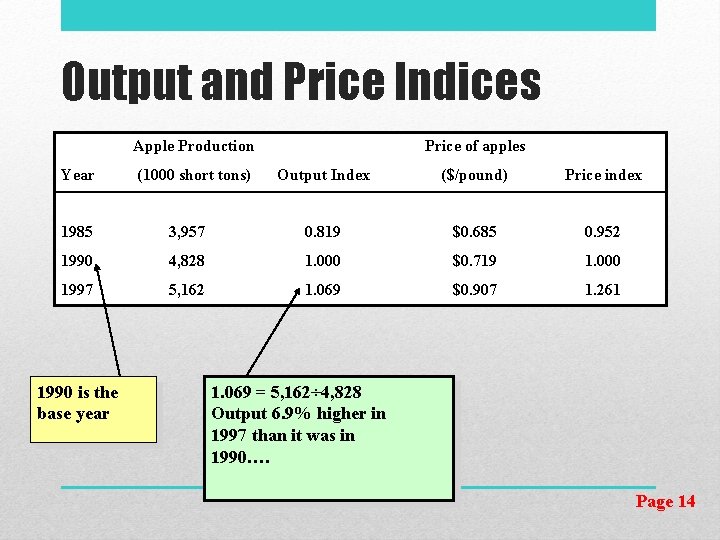
Output and Price Indices Apple Production Year (1000 short tons) Price of apples Output Index ($/pound) Price index 1985 3, 957 0. 819 $0. 685 0. 952 1990 4, 828 1. 000 $0. 719 1. 000 1997 5, 162 1. 069 $0. 907 1. 261 1990 is the base year 1. 069 = 5, 162÷ 4, 828 Output 6. 9% higher in 1997 than it was in 1990…. Page 14
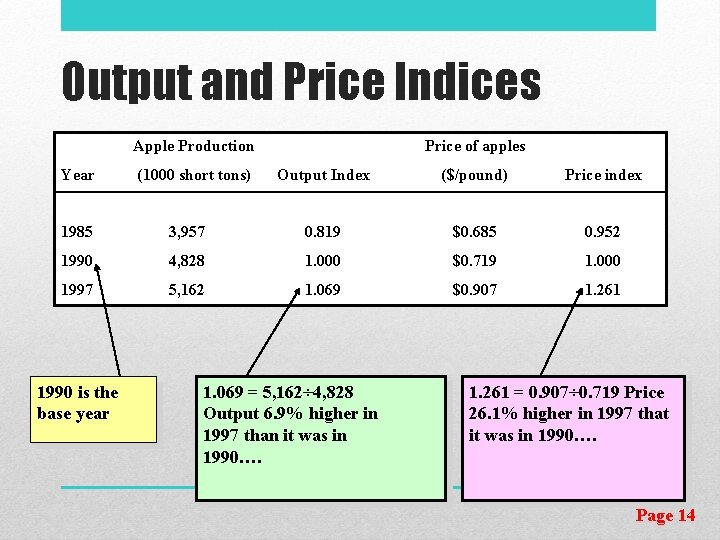
Output and Price Indices Apple Production Year (1000 short tons) Price of apples Output Index ($/pound) Price index 1985 3, 957 0. 819 $0. 685 0. 952 1990 4, 828 1. 000 $0. 719 1. 000 1997 5, 162 1. 069 $0. 907 1. 261 1990 is the base year 1. 069 1. 06 = 5, 823÷ 5, 512 5, 162÷ 4, 828 Output 6. 9% 6% higherin in 1997 thanititwas wasinin 1990…. 1. 261 = 0. 907÷ 0. 719 Price 26. 1% higher in 1997 that it was in 1990…. Page 14
http: //www. nass. usda. gov/Charts_and_Maps/Agricultural_Prices/
http: //www. nass. usda. gov/Charts_and_Maps/Agricultural_Prices/
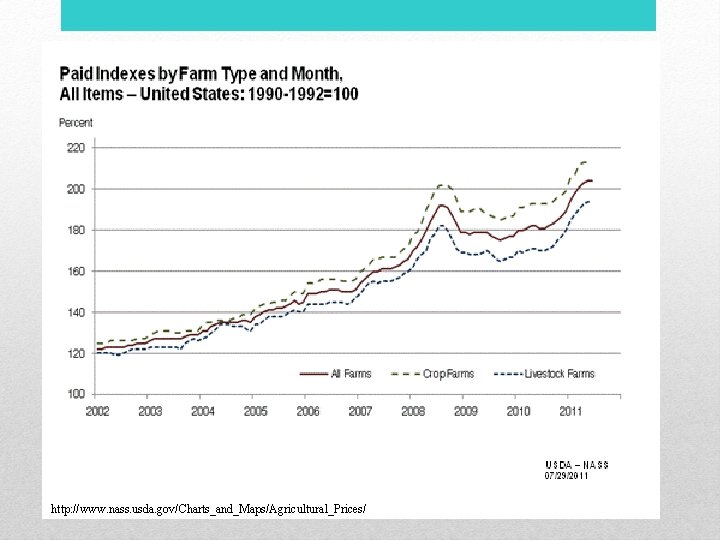
http: //www. nass. usda. gov/Charts_and_Maps/Agricultural_Prices/
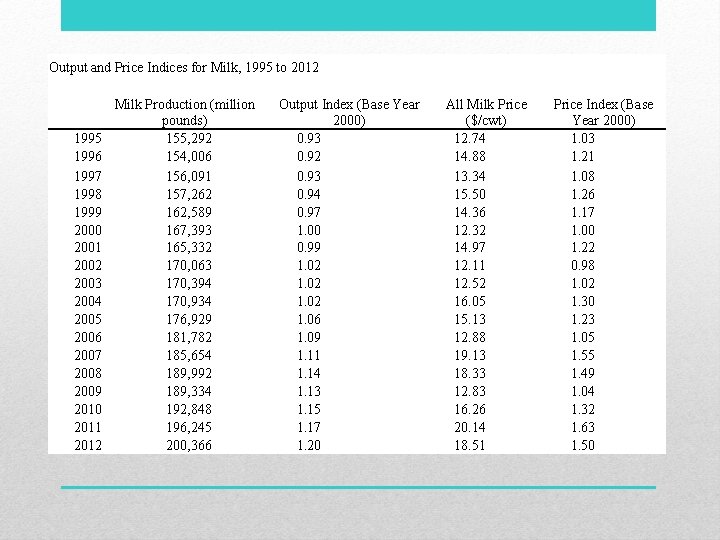
Output and Price Indices for Milk, 1995 to 2012 1995 1996 1997 1998 1999 2000 2001 2002 2003 2004 2005 2006 2007 2008 2009 2010 2011 2012 Milk Production (million pounds) 155, 292 154, 006 156, 091 157, 262 162, 589 167, 393 165, 332 170, 063 170, 394 170, 934 176, 929 181, 782 185, 654 189, 992 189, 334 192, 848 196, 245 200, 366 Output Index (Base Year 2000) 0. 93 0. 92 0. 93 0. 94 0. 97 1. 00 0. 99 1. 02 1. 06 1. 09 1. 11 1. 14 1. 13 1. 15 1. 17 1. 20 All Milk Price ($/cwt) 12. 74 14. 88 13. 34 15. 50 14. 36 12. 32 14. 97 12. 11 12. 52 16. 05 15. 13 12. 88 19. 13 18. 33 12. 83 16. 26 20. 14 18. 51 Price Index (Base Year 2000) 1. 03 1. 21 1. 08 1. 26 1. 17 1. 00 1. 22 0. 98 1. 02 1. 30 1. 23 1. 05 1. 55 1. 49 1. 04 1. 32 1. 63 1. 50
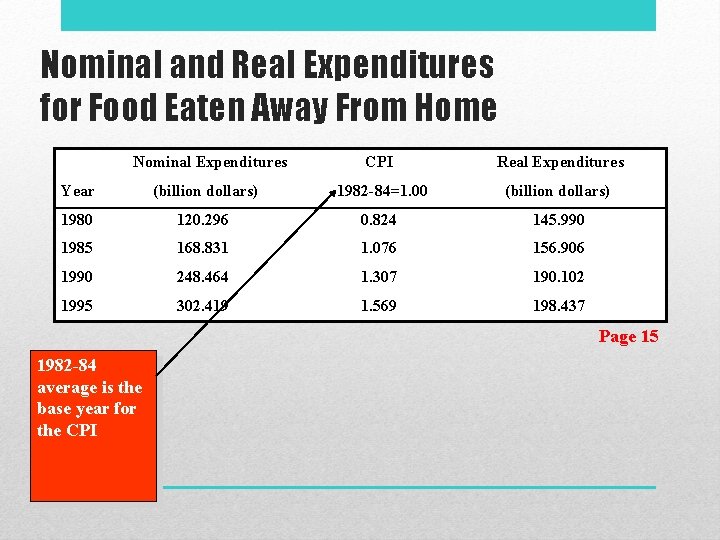
Nominal and Real Expenditures for Food Eaten Away From Home Nominal Expenditures CPI Real Expenditures Year (billion dollars) 1982 -84=1. 00 (billion dollars) 1980 120. 296 0. 824 145. 990 1985 168. 831 1. 076 156. 906 1990 248. 464 1. 307 190. 102 1995 302. 419 1. 569 198. 437 Page 15 1982 -84 average is the base year for the CPI
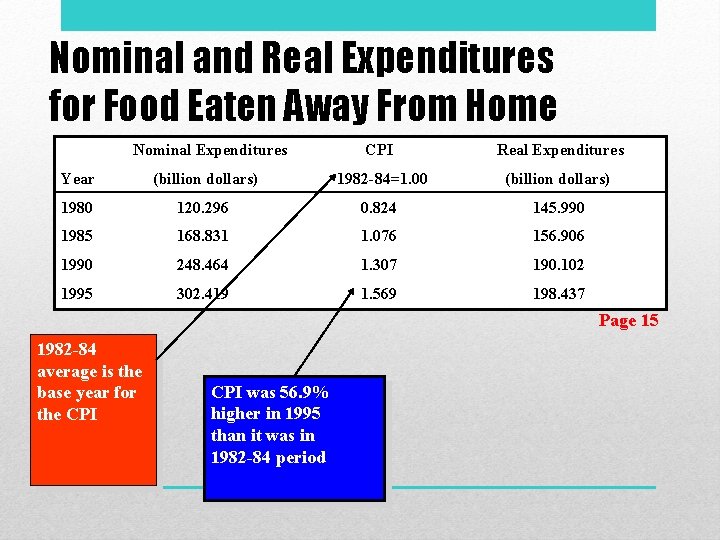
Nominal and Real Expenditures for Food Eaten Away From Home Nominal Expenditures CPI Real Expenditures Year (billion dollars) 1982 -84=1. 00 (billion dollars) 1980 120. 296 0. 824 145. 990 1985 168. 831 1. 076 156. 906 1990 248. 464 1. 307 190. 102 1995 302. 419 1. 569 198. 437 Page 15 1982 -84 average is the base year for the CPI was 56. 9% higher in 1995 than it was in 1982 -84 period
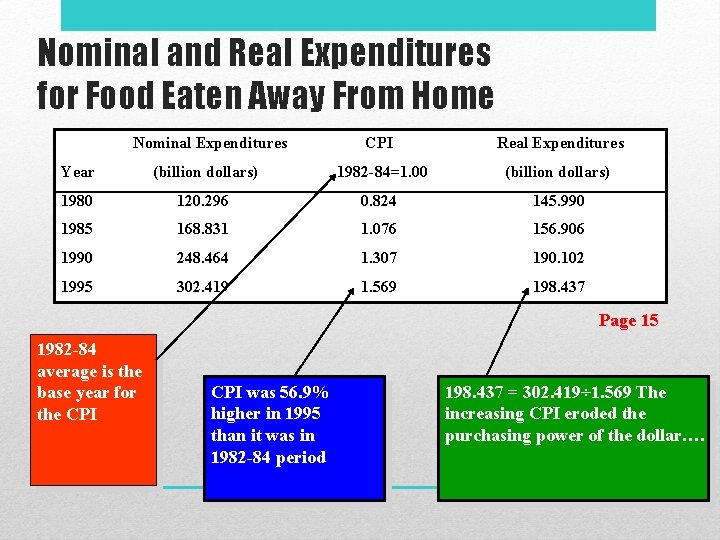
Nominal and Real Expenditures for Food Eaten Away From Home Nominal Expenditures CPI Real Expenditures Year (billion dollars) 1982 -84=1. 00 (billion dollars) 1980 120. 296 0. 824 145. 990 1985 168. 831 1. 076 156. 906 1990 248. 464 1. 307 190. 102 1995 302. 419 1. 569 198. 437 Page 15 1982 -84 average is the base year for the CPI was 56. 9% higher in 1995 than it was in 1982 -84 period 198. 437 = 302. 419÷ 1. 569 The increasing CPI eroded the purchasing power of the dollar….
Characteristics of the Food and Fiber System
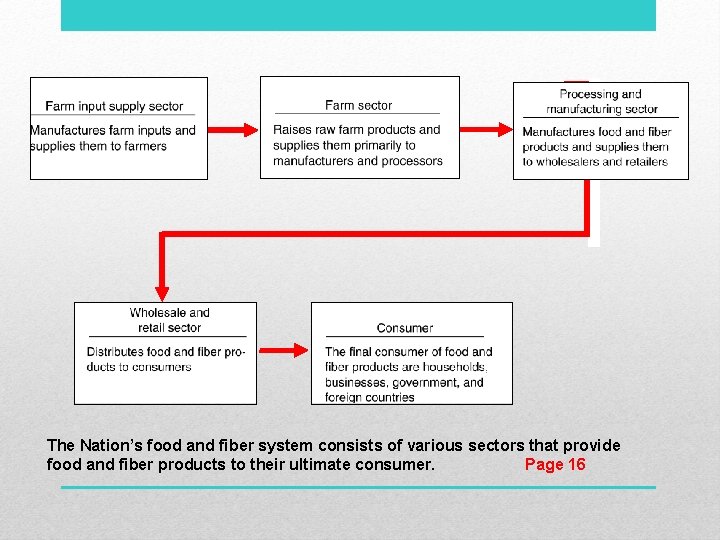
The Nation’s food and fiber system consists of various sectors that provide food and fiber products to their ultimate consumer. Page 16
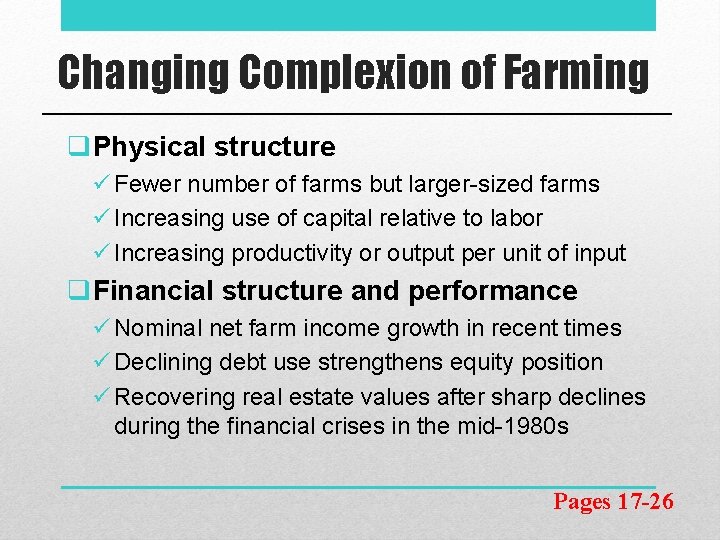
Changing Complexion of Farming q. Physical structure ü Fewer number of farms but larger-sized farms ü Increasing use of capital relative to labor ü Increasing productivity or output per unit of input q. Financial structure and performance ü Nominal net farm income growth in recent times ü Declining debt use strengthens equity position ü Recovering real estate values after sharp declines during the financial crises in the mid-1980 s Pages 17 -26
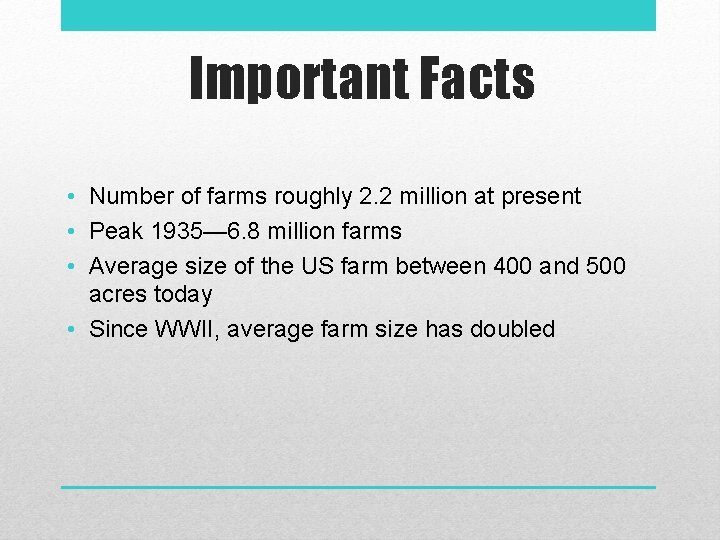
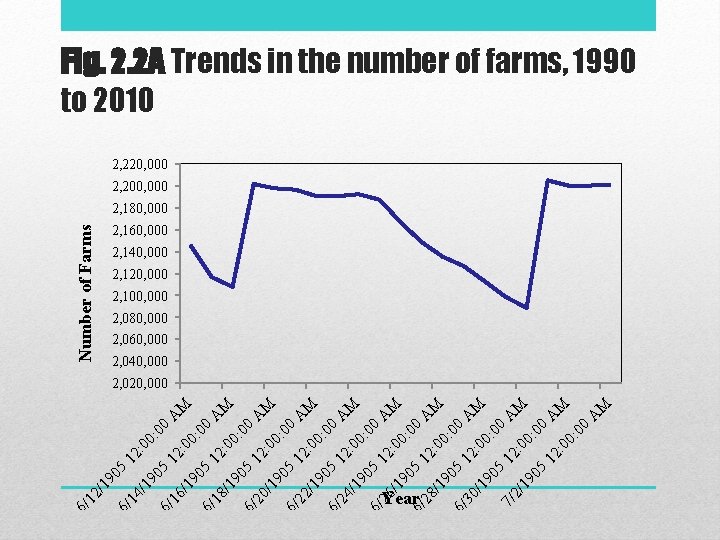
Important Facts • Number of farms roughly 2. 2 million at present • Peak 1935— 6. 8 million farms • Average size of the US farm between 400 and 500 acres today • Since WWII, average farm size has doubled
2/ 19 05 6/ 12 14 : /1 90 00: 0 5 6/ 12 0 A 16 M : /1 90 00: 0 5 6/ 12 0 A 18 M : /1 90 00: 0 5 6/ 12 0 A 20 M : /1 90 00: 0 5 6/ 12 0 A 22 M : /1 90 00: 0 5 6/ 12 0 A 24 M : /1 90 00: 0 5 6/ 12 0 A 26 M : /1 90 00: 0 5 6/ 12 0 A 28 M : /1 90 00: 0 5 6/ 12 0 A 30 M : /1 90 00: 0 5 0 7/ 1 A 2 2/ M : 0 19 0 : 0 05 12 0 A M : 0 0: 00 A M 6/ 1 Number of Farms Fig. 2. 2 A Trends in the number of farms, 1990 to 2010 2, 220, 000 2, 200, 000 2, 180, 000 2, 160, 000 2, 140, 000 2, 120, 000 2, 100, 000 2, 080, 000 2, 060, 000 2, 040, 000 2, 020, 000 Year
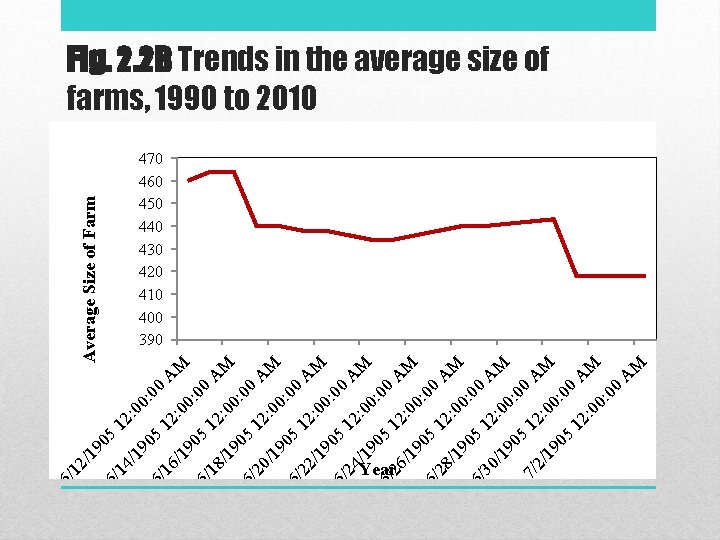
0: 00 19 05 0: 00 00 : 0 0: 12 12 : 0 90 5 2/ 1 7/ 0: 00 12 : 0 19 05 30 / 6/ 28 / 6/ 26 / Year 6/ 12 : 0 19 05 24 / 6/ 0: 00 12 : 0 : 0 0 00 12 : 0: 00 12 : 0 19 05 22 / 6/ 19 05 20 / 6/ 5 19 05 18 / 6/ /1 90 6/ 16 19 05 14 / 6/ 19 05 12 / 6/ M A M A M A Average Size of Farm Fig. 2. 2 B Trends in the average size of farms, 1990 to 2010 470 460 450 440 430 420 410 400 390
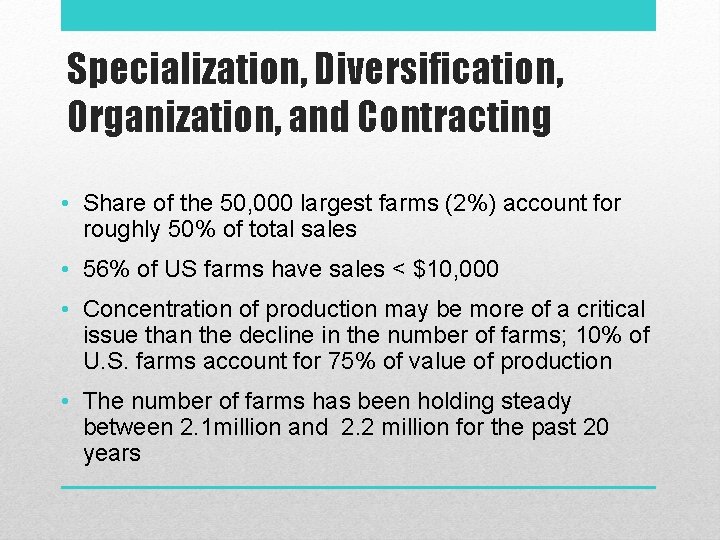
Specialization, Diversification, Organization, and Contracting • Share of the 50, 000 largest farms (2%) account for roughly 50% of total sales • 56% of US farms have sales < $10, 000 • Concentration of production may be more of a critical issue than the decline in the number of farms; 10% of U. S. farms account for 75% of value of production • The number of farms has been holding steady between 2. 1 million and 2. 2 million for the past 20 years
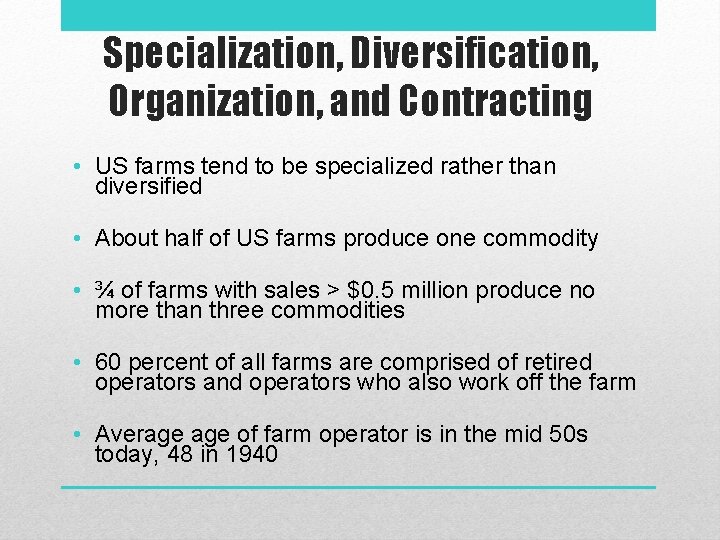
Specialization, Diversification, Organization, and Contracting • US farms tend to be specialized rather than diversified • About half of US farms produce one commodity • ¾ of farms with sales > $0. 5 million produce no more than three commodities • 60 percent of all farms are comprised of retired operators and operators who also work off the farm • Average of farm operator is in the mid 50 s today, 48 in 1940
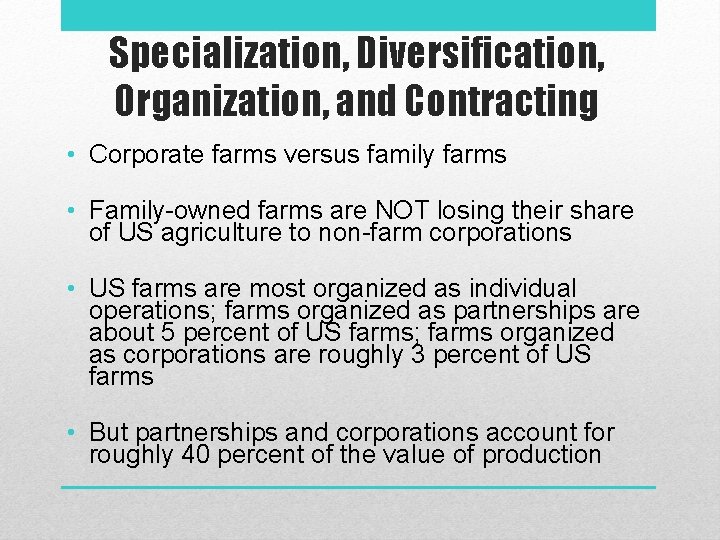
Specialization, Diversification, Organization, and Contracting • Corporate farms versus family farms • Family-owned farms are NOT losing their share of US agriculture to non-farm corporations • US farms are most organized as individual operations; farms organized as partnerships are about 5 percent of US farms; farms organized as corporations are roughly 3 percent of US farms • But partnerships and corporations account for roughly 40 percent of the value of production
Specialization, Diversification, Organization, and Contracting • Over the past 40 years, farmers have become LESS dependent on terminal markets and spot pricing • Roughly 10 percent of farms today rely on production and marketing contracts, and these farms account for 52 percent of agricultural production • 90 percent of US farms today have no production and marketing contracts
A Note on Farm Inputs • • Land, Labor, Capital, Materials Capital refers to durable equipment and structures Labor—Hired and Self-Employed Materials—Energy, chemicals, and purchased services
A Note on Farm Inputs • Total farm input, in the aggregate, has remained relatively stable since WWII • Labor on the decline, materials on the rise • Capital substituted for labor; use of capital inputs peaked around 1980 and then declined from 1981 to 1995; since 1996 capital has leveled off
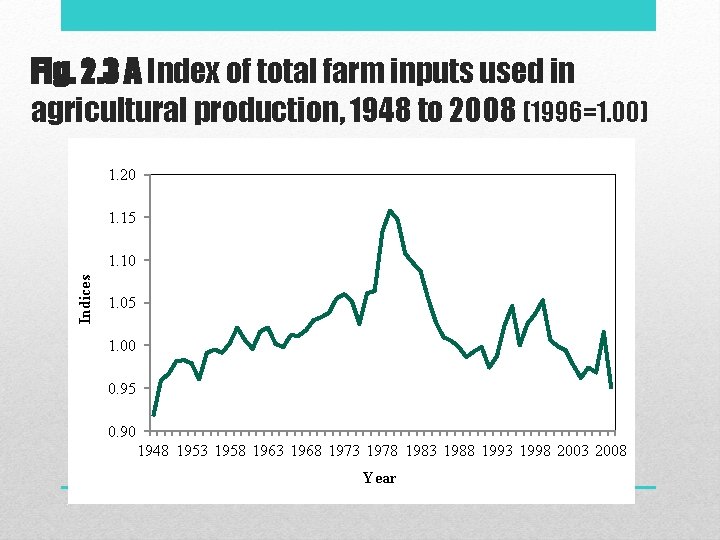
Fig. 2. 3 A Index of total farm inputs used in agricultural production, 1948 to 2008 (1996=1. 00) 1. 20 1. 15 Indices 1. 10 1. 05 1. 00 0. 95 0. 90 1948 1953 1958 1963 1968 1973 1978 1983 1988 1993 1998 2003 2008 Year
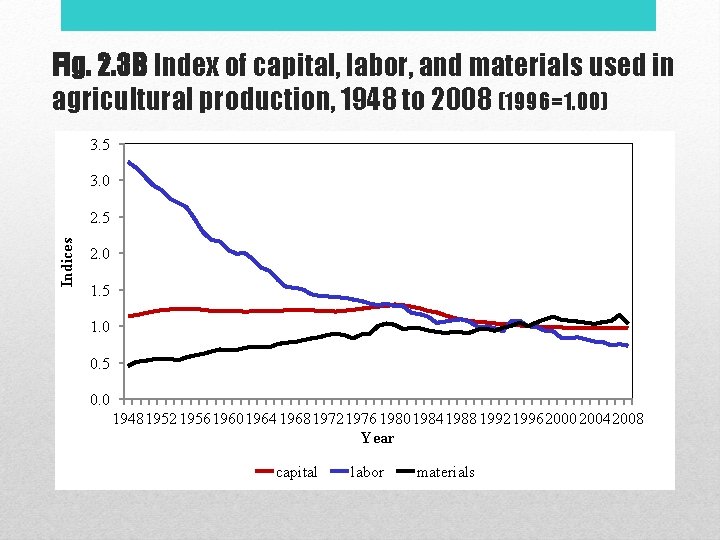
Fig. 2. 3 B Index of capital, labor, and materials used in agricultural production, 1948 to 2008 (1996=1. 00) 3. 5 3. 0 Indices 2. 5 2. 0 1. 5 1. 0 0. 5 0. 0 1948195219561960196419681972197619801984198819921996200020042008 Year capital labor materials
A Note on Productivity • Productivity defined as output per unit of input • Productivity has increased dramatically since WWII • Output has been on the rise due primarily to development and use of technology and biotechnology (e. g. BST) • Growth rates in livestock and crop output have been about the same; average growth rate is 2 percent per year
A Note on Productivity • US farmers have adopted widely geneticallyengineered (GE) crops since their introduction in 1996 • Examples—soybeans and cotton geneticallyengineered with herbicide-tolerant traits; cotton and corn with insect-resistant traits
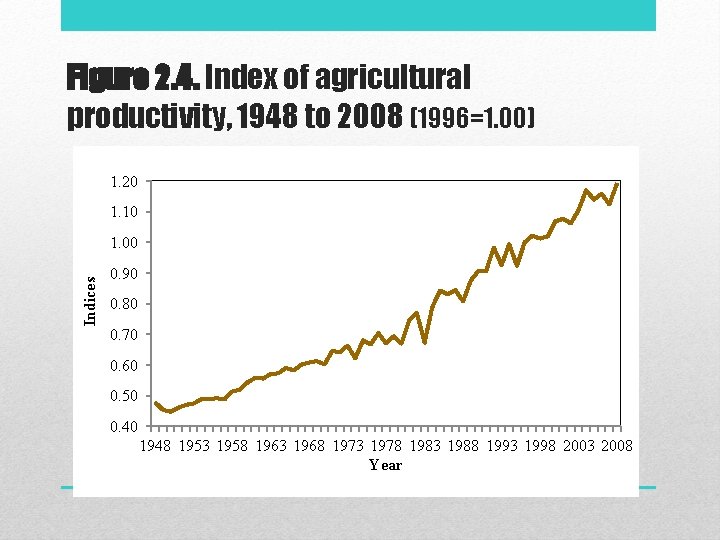
Figure 2. 4. Index of agricultural productivity, 1948 to 2008 (1996=1. 00) 1. 20 1. 10 Indices 1. 00 0. 90 0. 80 0. 70 0. 60 0. 50 0. 40 1948 1953 1958 1963 1968 1973 1978 1983 1988 1993 1998 2003 2008 Year
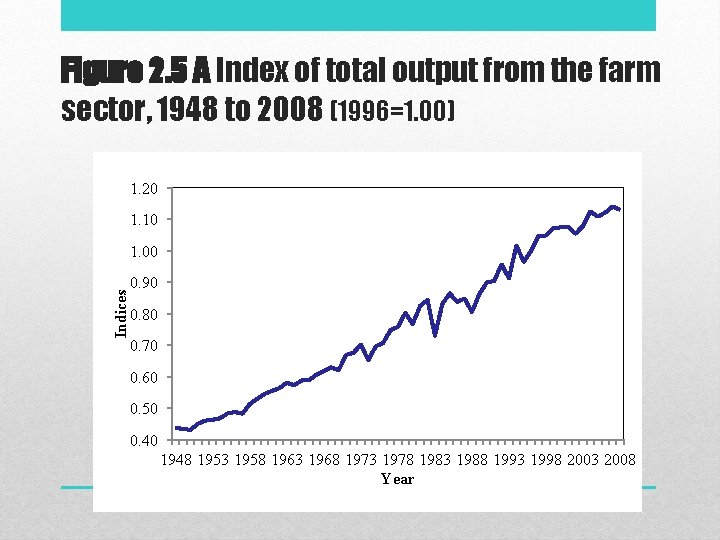
Figure 2. 5 A Index of total output from the farm sector, 1948 to 2008 (1996=1. 00) 1. 20 1. 10 Indices 1. 00 0. 90 0. 80 0. 70 0. 60 0. 50 0. 40 1948 1953 1958 1963 1968 1973 1978 1983 1988 1993 1998 2003 2008 Year
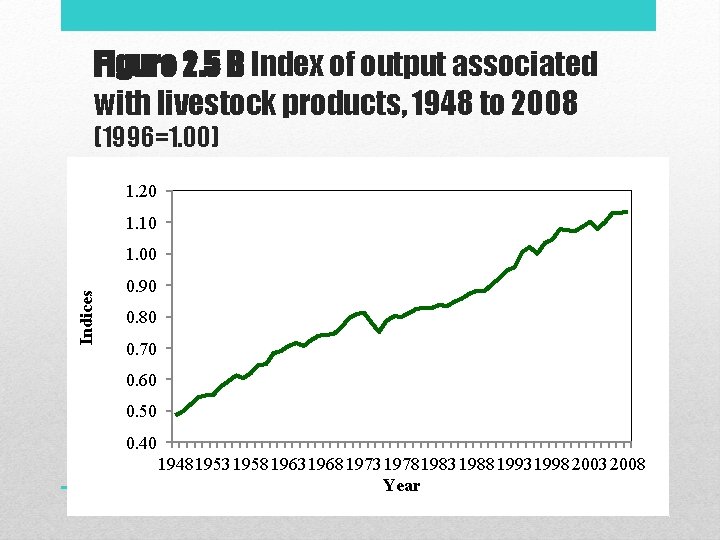
Figure 2. 5 B Index of output associated with livestock products, 1948 to 2008 (1996=1. 00) 1. 20 1. 10 Indices 1. 00 0. 90 0. 80 0. 70 0. 60 0. 50 0. 40 1948195319581963196819731978198319881993199820032008 Year
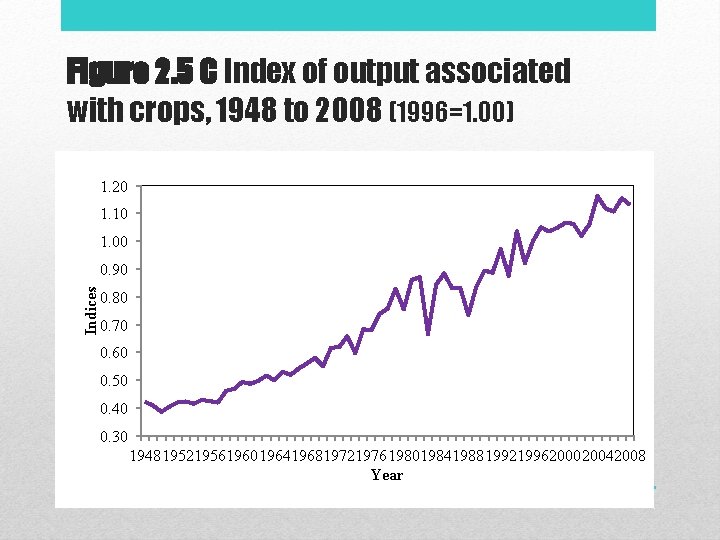
Figure 2. 5 C Index of output associated with crops, 1948 to 2008 (1996=1. 00) 1. 20 1. 10 1. 00 Indices 0. 90 0. 80 0. 70 0. 60 0. 50 0. 40 0. 30 1948195219561960196419681972197619801984198819921996200020042008 Year
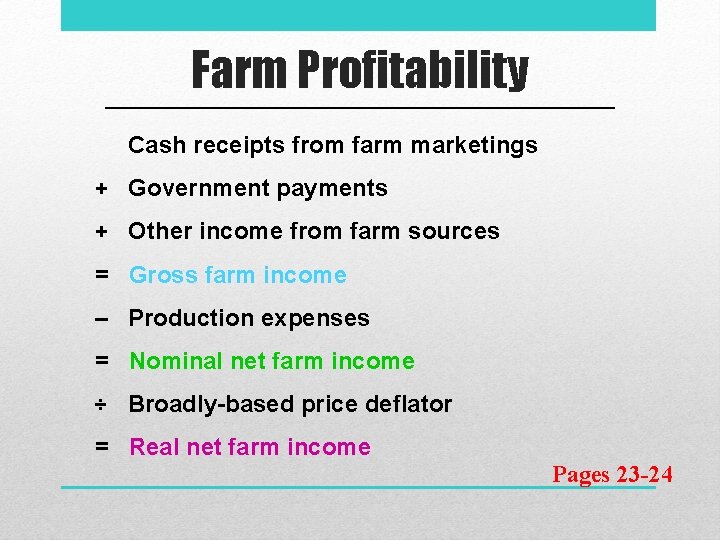
Farm Profitability Cash receipts from farm marketings + Government payments + Other income from farm sources = Gross farm income – Production expenses = Nominal net farm income ÷ Broadly-based price deflator = Real net farm income Pages 23 -24
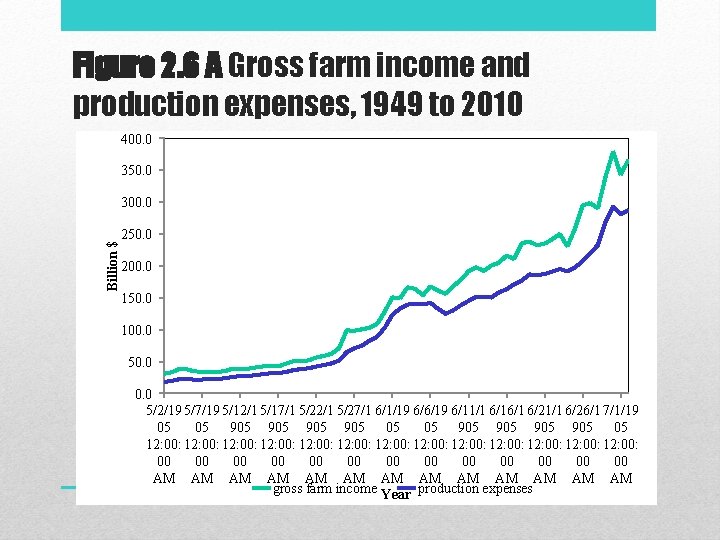
Figure 2. 6 A Gross farm income and production expenses, 1949 to 2010 400. 0 350. 0 Billion $ 300. 0 250. 0 200. 0 150. 0 100. 0 50. 0 5/2/19 5/7/19 5/12/1 5/17/1 5/22/1 5/27/1 6/1/19 6/6/19 6/11/1 6/16/1 6/21/1 6/26/1 7/1/19 05 05 905 905 05 12: 00: 12: 00: 12: 00: 12: 00 00 00 00 AM AM AM AM gross farm income Year production expenses
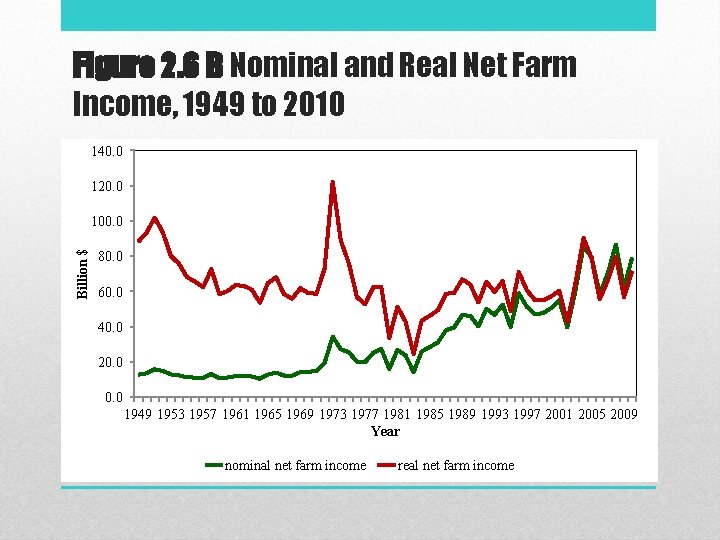
Figure 2. 6 B Nominal and Real Net Farm Income, 1949 to 2010 140. 0 120. 0 Billion $ 100. 0 80. 0 60. 0 40. 0 20. 0 1949 1953 1957 1961 1965 1969 1973 1977 1981 1985 1989 1993 1997 2001 2005 2009 Year nominal net farm income real net farm income
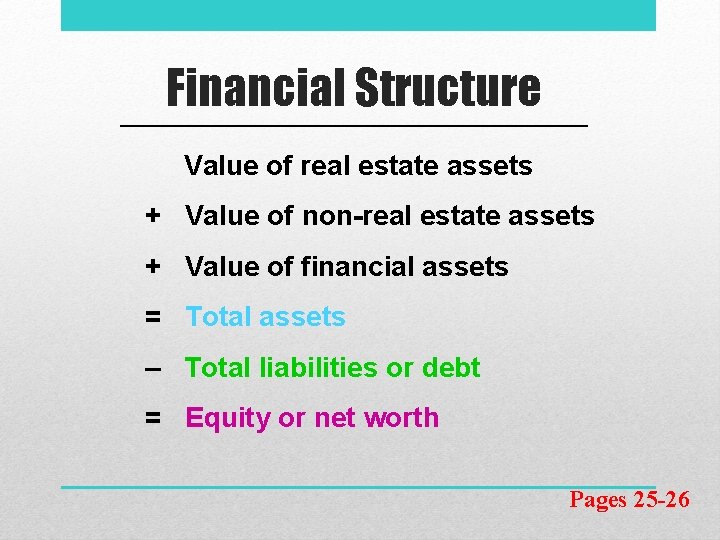
Financial Structure Value of real estate assets + Value of non-real estate assets + Value of financial assets = Total assets – Total liabilities or debt = Equity or net worth Pages 25 -26
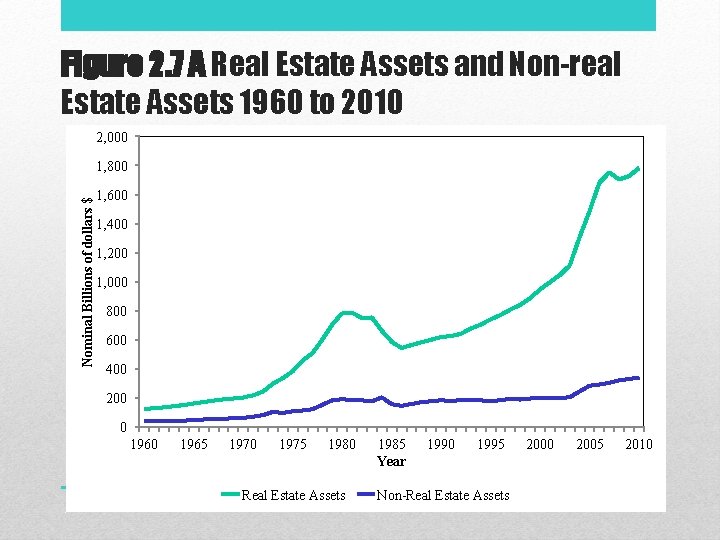
Figure 2. 7 A Real Estate Assets and Non-real Estate Assets 1960 to 2010 2, 000 Nominal Billions of dollars $ 1, 800 1, 600 1, 400 1, 200 1, 000 800 600 400 200 0 1965 1970 1975 1980 Real Estate Assets 1985 Year 1990 1995 Non-Real Estate Assets 2000 2005 2010
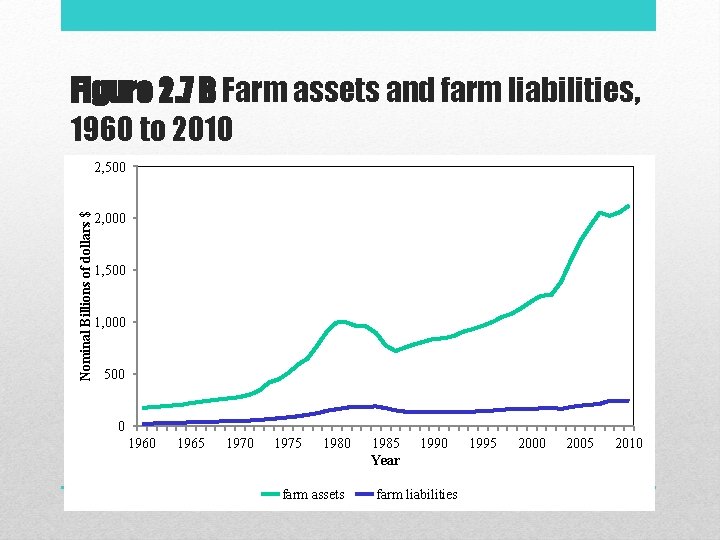
Figure 2. 7 B Farm assets and farm liabilities, 1960 to 2010 Nominal Billions of dollars $ 2, 500 2, 000 1, 500 1, 000 500 0 1965 1970 1975 1980 farm assets 1985 Year 1990 farm liabilities 1995 2000 2005 2010
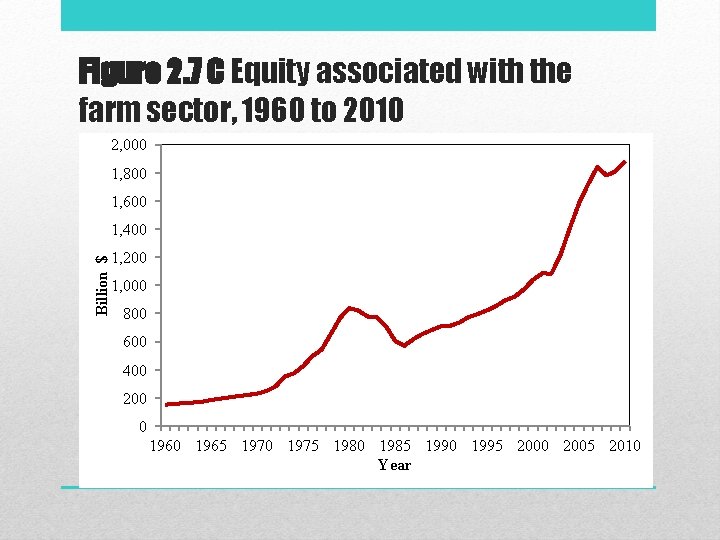
Figure 2. 7 C Equity associated with the farm sector, 1960 to 2010 2, 000 1, 800 1, 600 Billion $ 1, 400 1, 200 1, 000 800 600 400 200 0 1965 1970 1975 1980 1985 1990 1995 2000 2005 2010 Year
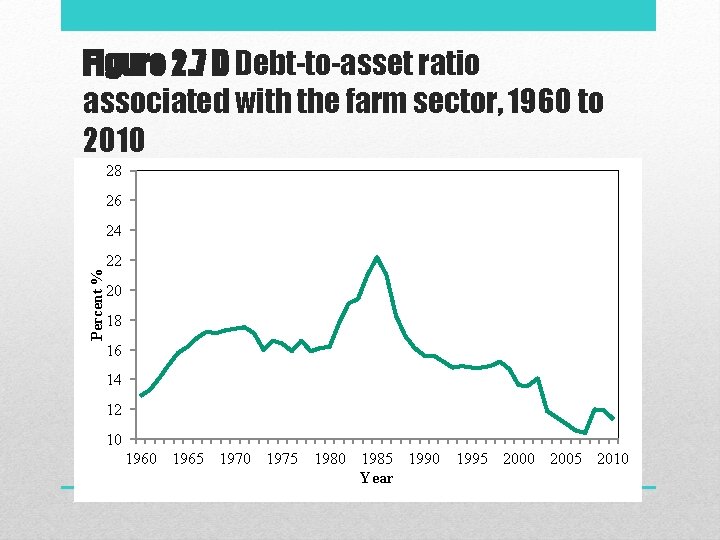
Figure 2. 7 D Debt-to-asset ratio associated with the farm sector, 1960 to 2010 28 26 Percent % 24 22 20 18 16 14 12 10 1965 1970 1975 1980 1985 1990 1995 2000 2005 2010 Year
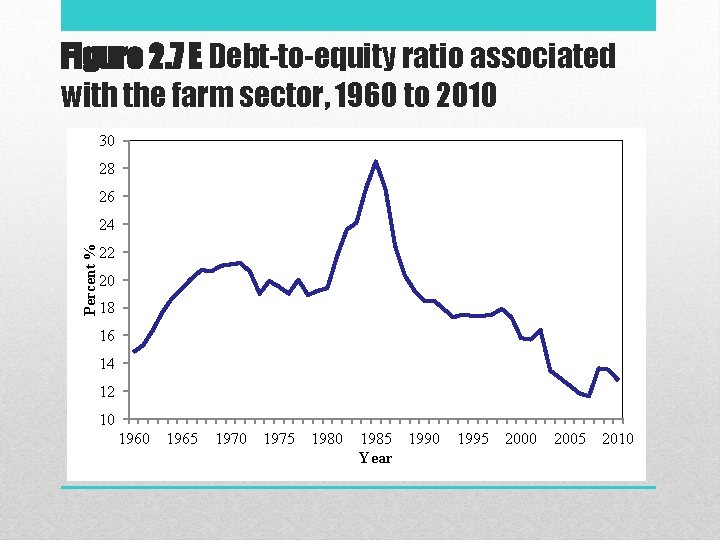
Figure 2. 7 E Debt-to-equity ratio associated with the farm sector, 1960 to 2010 30 28 26 Percent % 24 22 20 18 16 14 12 10 1965 1970 1975 1980 1985 1990 Year 1995 2000 2005 2010
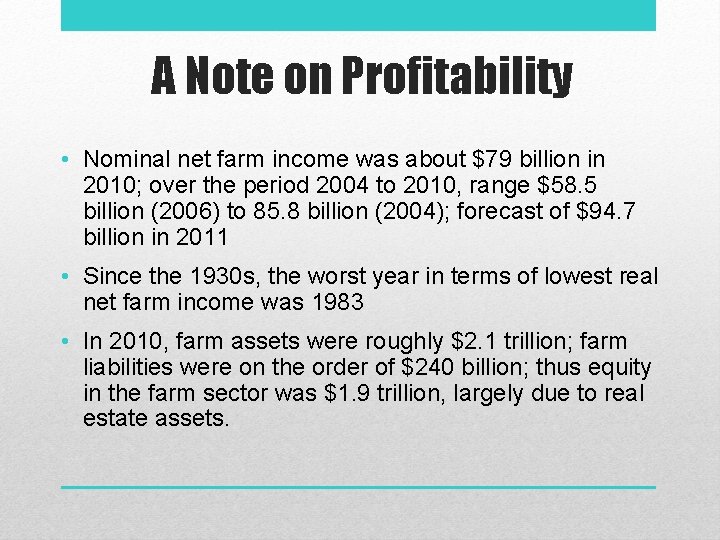
A Note on Profitability • Nominal net farm income was about $79 billion in 2010; over the period 2004 to 2010, range $58. 5 billion (2006) to 85. 8 billion (2004); forecast of $94. 7 billion in 2011 • Since the 1930 s, the worst year in terms of lowest real net farm income was 1983 • In 2010, farm assets were roughly $2. 1 trillion; farm liabilities were on the order of $240 billion; thus equity in the farm sector was $1. 9 trillion, largely due to real estate assets.
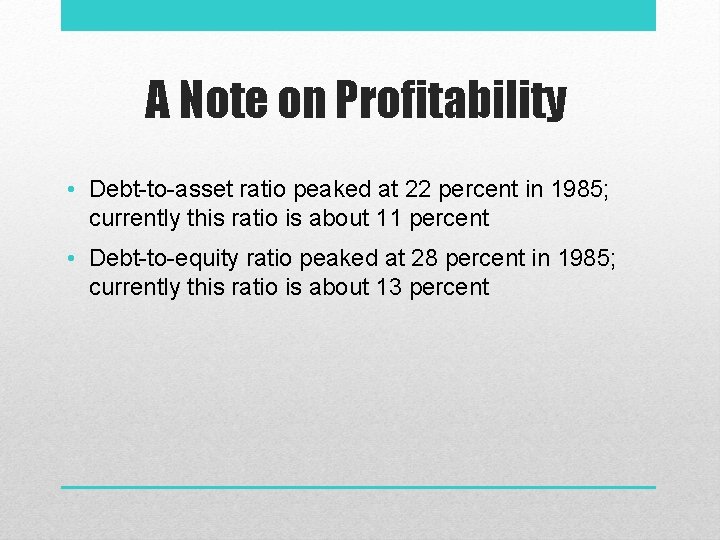
A Note on Profitability • Debt-to-asset ratio peaked at 22 percent in 1985; currently this ratio is about 11 percent • Debt-to-equity ratio peaked at 28 percent in 1985; currently this ratio is about 13 percent
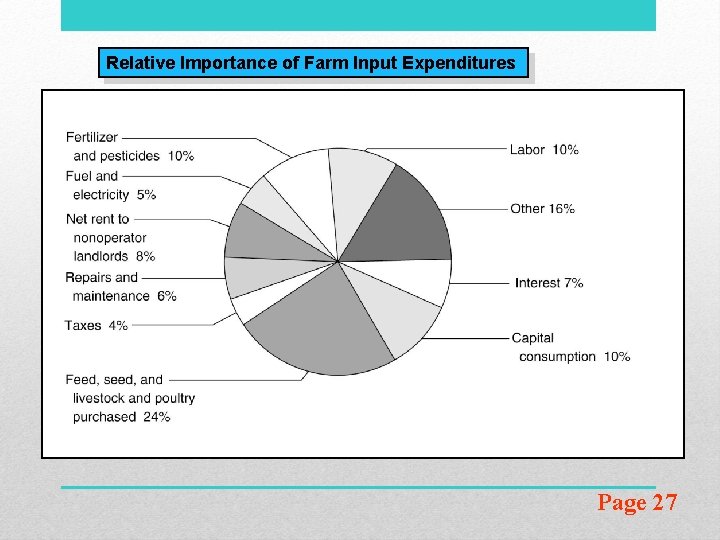
Relative Importance of Farm Input Expenditures Page 27

Beyond the Farm Gate
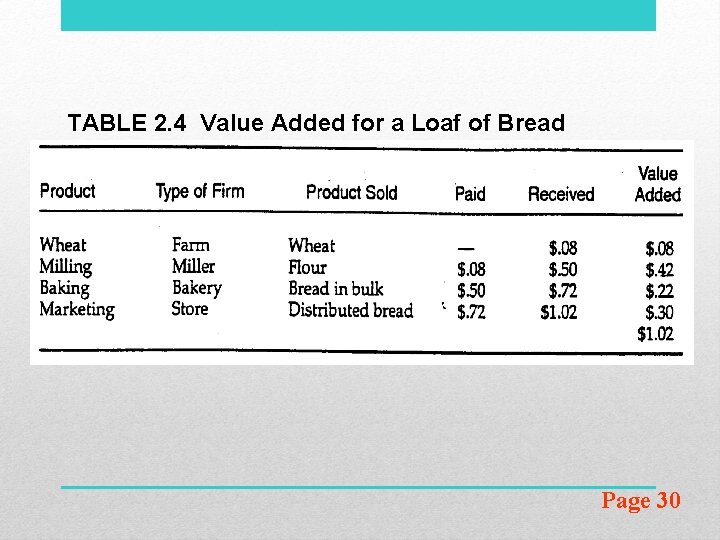
TABLE 2. 4 Value Added for a Loaf of Bread Page 30
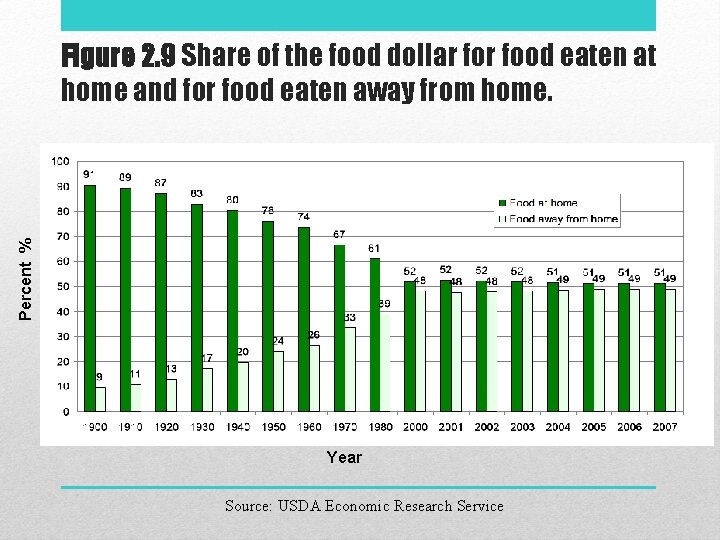
Percent % Figure 2. 9 Share of the food dollar food eaten at home and for food eaten away from home. Year Source: USDA Economic Research Service
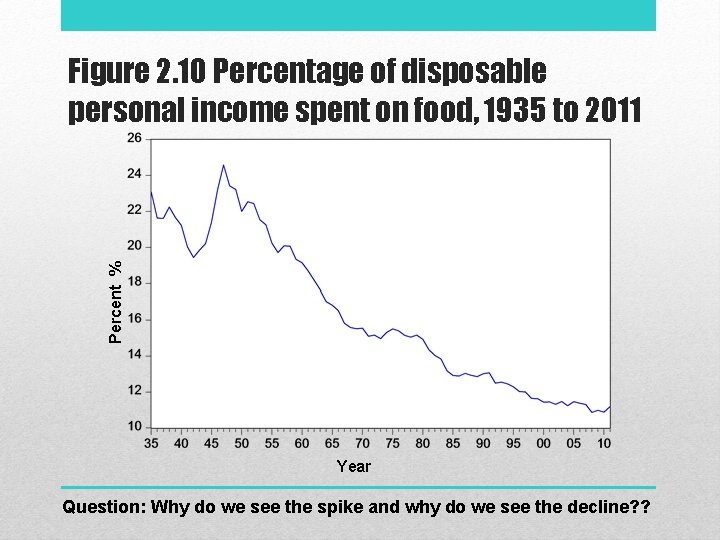
Percent % Figure 2. 10 Percentage of disposable personal income spent on food, 1935 to 2011 Year Question: Why do we see the spike and why do we see the decline? ?
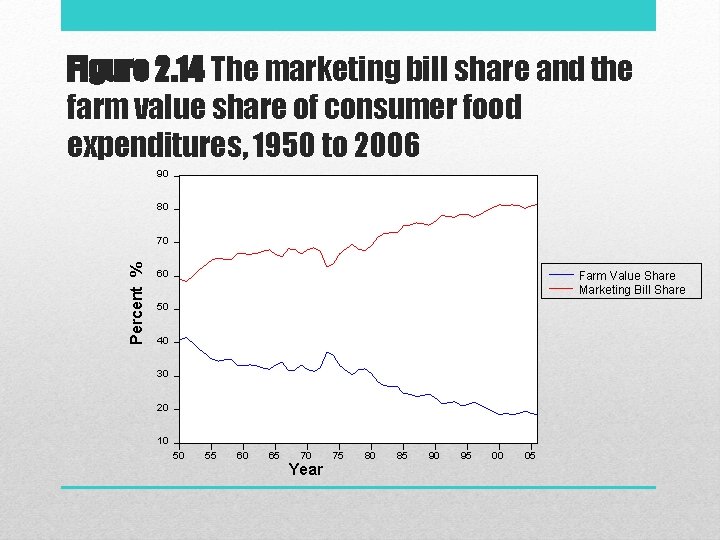
Figure 2. 14 The marketing bill share and the farm value share of consumer food expenditures, 1950 to 2006 90 80 Percent % 70 60 Farm Value Share Marketing Bill Share 50 40 30 20 10 50 55 60 65 70 Year 75 80 85 90 95 00 05
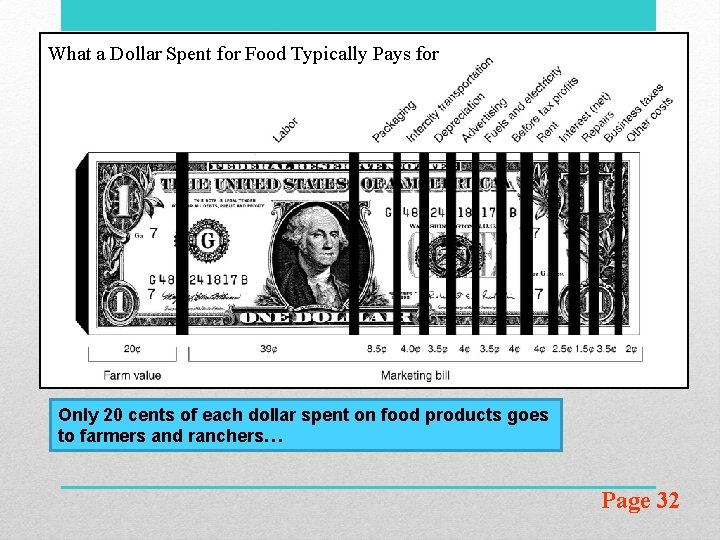
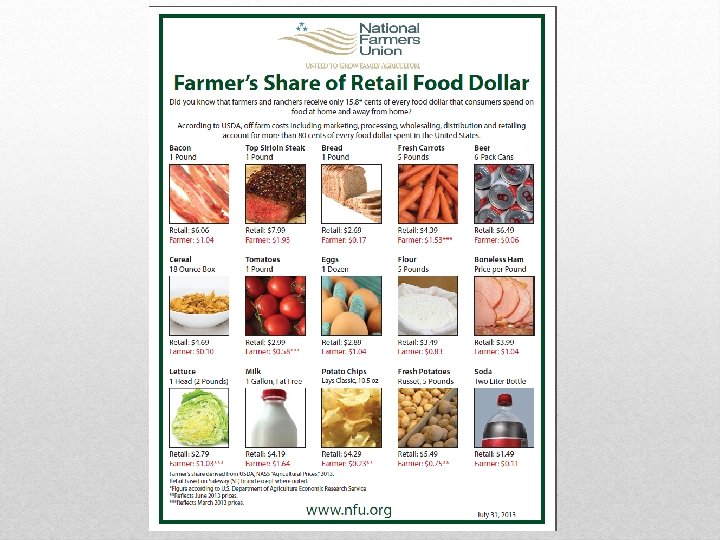
What a Dollar Spent for Food Typically Pays for Only 20 cents of each dollar spent on food products goes to farmers and ranchers… Page 32

Assignment • Please do ALL problems in Chapter 2 • (see pg 36 -37).
- Slides: 61