The Threedimensional Potential Energy Surface of ArCO Yoshihiro


 L. H. Coudert, et al. , J.")


 lower (v. CO, vvd. W, j, K)")
 -F")


 : 1.")

-F 12/ AV 5 Z CCSD(T)/ AVQZ(33211) Rmin(q) R/Å Re =")
 fitted CCSD(T)-F 12/ AV 5 Z CCSD(T)/")
 (1, 0, 6,")

 J = 1(-) (1, 1, 1) R/Å Bending")
, MW(Ar-12 CO, Ar-13 CO), mm. W,")

- Slides: 24
The Three-dimensional Potential Energy Surface of Ar-CO Yoshihiro Sumiyoshi 1, Yasuki Endo 2 1. Faculty of Science and Technology, Gunma University 2. Graduate School of Arts and Sciences, University of Tokyo
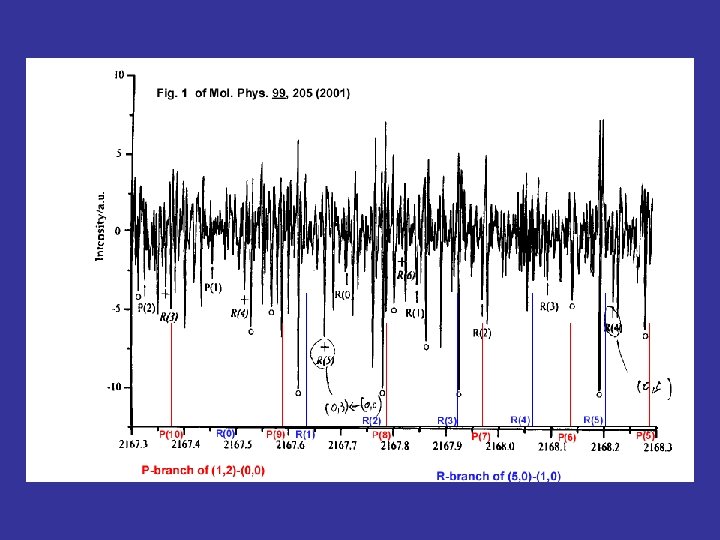
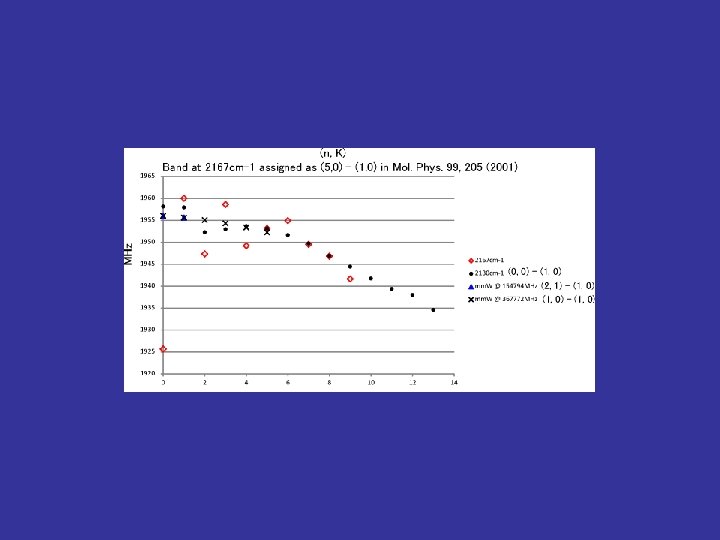
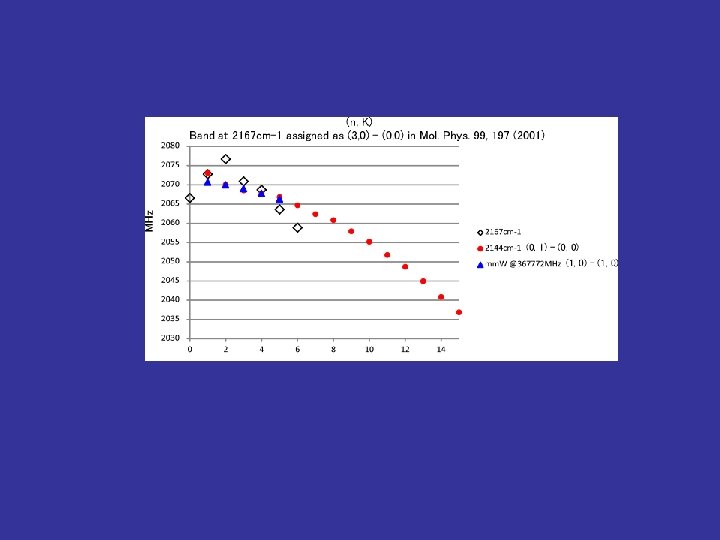
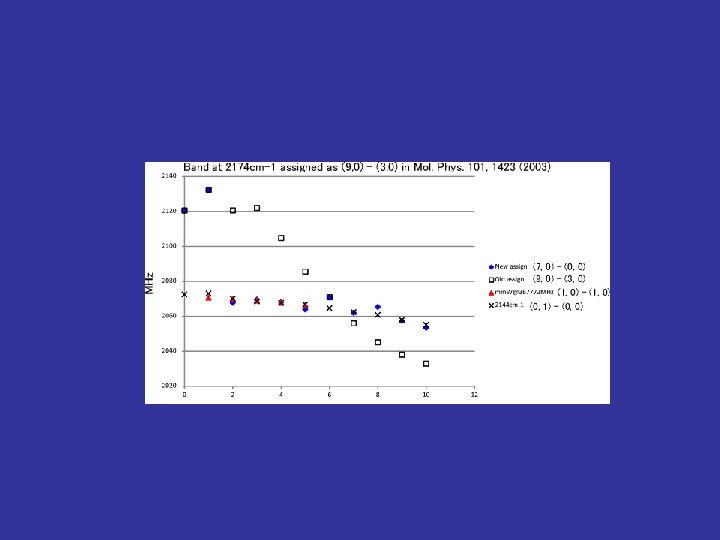
Previous studies on Ar-CO MW & mm. W IR Ab initio T. Ogata, et al. , J. Chem. Phys. 98, 9399 (1993) W. Jaeger, et al. , J. Chem. Phys. 102, 3578 (1995) V. N. Markov, et al. , Rev. Sci. Inst. 69, 4061 (1998) M. Hepp, et al. , J. Mol. Spectrosc. 176, 58 (1996) M. Hepp, et al. , Mol. Phys. 92, 229 (1997) M. Hepp, et al. , J. Mol. Spectrosc. 183, 295 (1997) R. Gendriesch, et al. , J. Mol. Spectrosc. 196, 139 (1999) L. A. Surin, et al. , Rev. Sci. Inst. 72, 2535 (2001) D. G. Melnik, et al. , J. Chem. Phys. 114, 6100 (2001) A. R. W. Mc. Kellar, Y. Xu, et al. , S. Koenig, et al. , A. R. W. Mc. Kellar, I. Scheele, et al. , J. Mol. Spectrosc. 153, 475 (1992) Mol. Phys. 88, 859 (1996) Mol. Phys. 87, 1071 (1996) Mol. Phys. 91, 265 (1997) Mol. Phys. 98, 111 (2000) Mol. Phys. 99, 197 (2001) Mol. Phys. 99, 205 (2001) Mol. Phys. 101, 1423 (2003) R. R. Toczylowski , et al. , J. Chem. Phys. 112, 4604 (2000) CCSD(T) / aug-cc-p. VTZ T. B. Pederson, et al. , J. Chem. Phys. 117, 6562 (2002) CCSD(T) / aug-cc-p. VQZ
Previous studies on Ar-CO 2 D-IPES (fitting) L. H. Coudert, et al. , J. Chem. Phys. 121, 4691 (2004) M. Havenith and G. W. Schwaab, Z. Phys. Chem. 219, 1053 (2005) Attacking a Small Beast: Ar-CO, a Prototype for Intermolecular Forces “No satisfactory analysis has been carried out. ” Intermolecular potential energy surface (3 D-IPES) by directly fitting all available transition frequencies
Coupling Scheme C r G O q K R j L J G R r q : The center of mass of CO : Distance between G and Rg. : CO bond length. : Angle between R and r. Ar
Observed ro-vibrational levels MW & mm. W : ~ 200 lines IR : ~ 830 lines Energy / cm-1 80 60 40 (0, 6, 6)* (vvd. W, j, K) (3, 1, 0)* (0, 5, 5) (0, 4, 4) (0, 3, 2)* 20 0 (0, 3, 3) (0, 2, 2) (0, 1, 1)** (0, 0, 0)** (0, 2, 1) (0, 1, 0) (1, 2, 0)* (1, 1, 1)* (1, 0, 0) (vvd. W, j, K)** vco = 0, 1, 2
upper (v. CO, vvd. W, j, K) lower (v. CO, vvd. W, j, K) n 0 N weight Ar-12 CO mm. W: 5 * * IR: 25 Ar-13 CO * Pederson, et al. , J. J. Chem. Phys. 117, 6562 (2002)
Ab initio calculations An initial 3 -D potential by ab initio calculations CCSD(T) -F 12 b/ aug-cc-p. V 5 Z 2450 points R : 3. 3 ~ 15. 0 Å r : 1. 00 ~ 1. 35 Å q : 0 ~ 180 ° Molpro 2010. 1
Total Hamiltonian ~ 3 D analysis ~ Htotal = HAr. CO + HCO
Potential terms ~ 3 D IPES ~ Short range term Asymptotic term Legendre polynomial A total of 46 parameters are used to fit the ab initio potential surfaces s : 0. 32 cm-1
3 Dimensional Potential IR data 12 C /13 C r G’ G O q r’ q’ MW data R’ R Ar-12 CO Ar-13 CO Rg V(R, r, q ) 12 CO 13 CO r’ r V(R’, r’, q ’) 3 D potential surfaces
Eigenvalue calculation Total function: 1. Rotation: Rotation matrix jmax = 18 2. Vibration: anharmonic/harmonic oscillator vd. W stretching vibration vmax = 15/40 CO vibration vsmax = 7/35 Hamiltonian matrices to be diagonalized: ≈ 20000 Discrete variable representation(DVR)
Least-squares fitting Direct fit of observed transition frequencies MW data (12 lines) : 1. 0 mm. W data (195 lines) : 1. 0 x 10 -2 ~ 1. 0 x 10 -4 IR data (831 lines) : 1. 0 x 10 -6 ~ 1. 0 x 10 -8 Total : 1038 lines: 20 potential parameters were optimized rms(MW) : 32 k. Hz (Ar-12 CO / 13 CO) rms(mm. W) : 970 k. Hz rms(IR) : 0. 0026 cm-1
PES of Ar-CO Ar O C C O R/Å Ar q /deg. Ar C O
Potential curve fitted CCSD(T)-F 12/ AV 5 Z CCSD(T)/ AVQZ(33211) Rmin(q) R/Å Re = 3. 72 Å Dn (J = 2 -1) 0. 9% Re = 3. 68 Å at = 85° Ar O C q /deg. Ar C O The present ab initio PES predicts transition frequency for J = 2 -1 at 8284 MHz within 0. 026%.
Potential curve V(Re, q, q = 0) fitted CCSD(T)-F 12/ AV 5 Z CCSD(T)/ AVQZ(33211) E / cm-1 De = 102 cm-1 D 0 = 83 cm-1 q /deg. De = 107 cm-1 De = 108 cm-1
Observed ro-vibrational levels IR transition (v. CO, vvd. W, j, K) (1, 0, 6, 6) (0, 0, 5, 5) Rotational state with J’ = 14 has been observed Present: 84. 5 cm-1 D 0 (v. CO = 1) CCSD(T) / AVQZ(33211): 79 cm-1 J’ 85 14 13 80 9 6
Comparison of Energy levels in VCO = 1
Y 2 > 5% (4% step) J = 1(-) (1, 1, 1) R/Å Bending excited states with v. CO = 1 E / cm-1 +40 (0, 3, 2) R/Å (1, 1, 0) +20 3141. 6 q /deg. (0, 2, 1) (0, 1, 0) (vvd. W, j, K) (1, 2, 0) (1, 1, 1)
Summary 1. All the spectroscopic data (1038 lines), MW(Ar-12 CO, Ar-13 CO), mm. W, and IR(v. CO=1, 2), have been fitted simultaneously, and the 3 D-IPES has been determined. 2. Unobserved states have been predicted. (v. CO, vvd. W, j, K) (1, 1, 2, 1) (1, 1, 2, 2) Higher by 35 cm-1 than the state (1, 0, 0, 0)