The Texas Shoreline Change Project Combining Lidar Historical

The Texas Shoreline Change Project: Combining Lidar, Historical Photography, and Ground Surveys to Measure Shoreline Change Rates along Bay and Gulf of Mexico Shorelines James C. Gibeaut, William A. White, Roberto Gutierrez, Rachel Waldinger, John R. Andrews, Tiffany L. Hepner, Rebecca C. Smyth, and Thomas A. Tremblay Bureau of Economic Geology John A. and Katherine G. Jackson School of Geosciences The University of Texas at Austin

Shoreline Length Gulf = 600 km Bays = 9, 400 km

Project Components • • Mapping past and current shorelines – Aerial photography – Ground kinematic GPS – Airborne lidar – shoreline plus beach and dune topographic mapping Calculating “average annual rate of change” and projecting future shoreline position – GIS-based Shoreline Shape and Projection Program (SSAPP) Beach profile ground surveys Data availability and public awareness – Online reports – Web-based GIS using Arc. IMS software

Data Sources Before 1930: Maps from the mid to late 1800’s produced by the U. S. Coast Survey – “high-water line mapped. ” Generally not used: Engineering structures altered sediment budget since 1900.
")
Sand Trapped by Jetty, Southwest end of Bolivar Peninsula (08/07/98)

Data Sources 1930’s to 1990’s - Vertical Aerial Photographs

Digital Photo Rectification 1995 Digital Orthophoto Quarter Quads Serve as Base Maps • USGS/Tx Orthophoto Program • Scanned color IR film, 1 -m resolution • Meet 1: 12, 000 map accuracy standards (90% of test points within 10 m) • Our tests show typically within 5 m

Shoreline Interpretation Wet/Dry Line Matagorda Bay Gulf of Mexico

Shoreline Interpretation Shoreline and Vegetation Line

Project Components • • Mapping shorelines – Aerial photography – Ground kinematic GPS – Airborne lidar – shoreline plus beach and dune topographic mapping Calculating “average annual rate of change” and projecting future shoreline position – GIS-based Shoreline Shape and Projection Program (SSAPP) Beach profile ground surveys Data availability and public awareness – Online reports – Web-based GIS using Arc. IMS software

Data Sources 1990’s – Kinematic GPS Surveys

Project Components • • Mapping shorelines – Aerial photography – Ground kinematic GPS – Airborne lidar – shoreline plus beach and dune topographic mapping Calculating “average annual rate of change” and projecting future shoreline position – GIS-based Shoreline Shape and Projection Program (SSAPP) Beach profile ground surveys Data availability and public awareness – Online reports – Web-based GIS using Arc. IMS software

Airborne Topographic Lidar • • • Mirror sweeps laser beam across the ground. Range to target is determined by measuring time interval between outgoing and return of reflected laser pulse. Aircraft position is determined using GPS phase differencing techniques. Pointing direction of laser determined with Inertial Measuring Unit (IMU) and recording of mirror position. Data streams recorded and synchronized for post processing.

GPS Coastal Network

Lidar Instrument in Cessna 206 Optech ALTM 1225

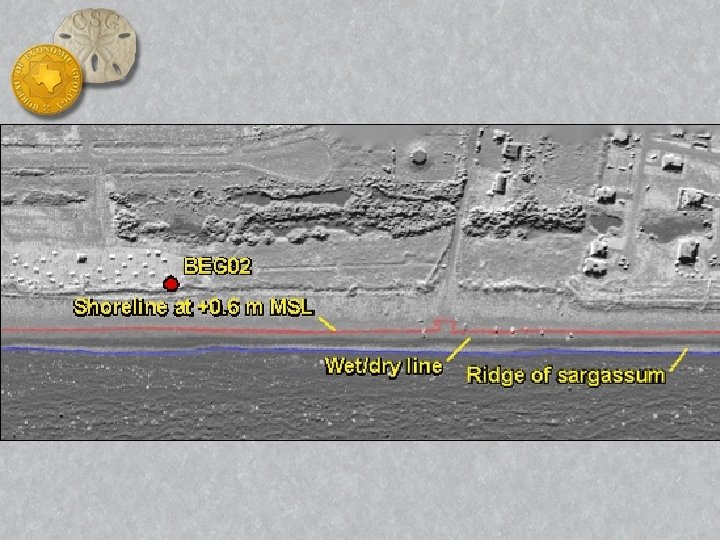
Lidar Digital Elevation Model 1 - m grid BEG-02 Beach profile MHHW +0. 6 m msl • • Gibeaut_CCC_Jan 31_2002 Landward boundary Geotube Ellipsoidal heights converted to orthometric heights (NAVD 88) using GEOID 99 gravity model. Local mean sea level (MSL) correction applied. QAd 496

Calibration Target

Calibration Flight Lines

Lidar Survey Video

Galveston Beach Wet/Dry Line

Galveston Island Profile
 0. 6 m along Upper Tx")
Representative Wet/Dry Elevation Height relative to MSL (m) 0. 6 m along Upper Tx Gulf Coast 3 vegetation line 2 upper berm crest 1 0. 6 0 MHHW -1 -2 0 50 Distance (m) 100

Why Use a Wet/Dry Elevation? • Consistent with historical photography. • Consistent with 2 d ground GPS surveys. • Lidar can measure reliably even during elevated water levels. • Geomorphologically significant elevation not as susceptible to short-term erosion/depositional cycles compared to lower elevations.

Hand-Smoothed Shoreline

Project Components • • Mapping shorelines – Aerial photography – Ground kinematic GPS – Airborne lidar – shoreline plus beach and dune topographic mapping Calculating “average annual rate of change” and projecting future shoreline position – GIS-based Shoreline Shape and Projection Program (SSAPP) Beach profile ground surveys Data availability and public awareness – Online reports – Web-based GIS using Arc. IMS software

Shoreline Shape and Projection Program Arc. View Interface

Shoreline Change Rate 200 150 Mid-term/linear regression rate 100 50 0 Shoreline -50 -100 Long-term end point rate -150 -200 -250 1840 1860 1880 1900 1920 1940 1960 1980 2000 2020 2040 2060 Bureau of Economic Geology Year QAb 5370 c

Projected Shoreline Galveston Island

Project Components • • Mapping shorelines – Aerial photography – Ground kinematic GPS – Airborne lidar – shoreline plus beach and dune topographic mapping Calculating “average annual rate of change” and projecting future shoreline position – GIS-based Shoreline Shape and Projection Program (SSAPP) Beach profile ground surveys Data availability and public awareness – Online reports – Web-based GIS using Arc. IMS software

Ground Survey

Beach Profile Annotated

Project Components • • Mapping shorelines – Aerial photography – Ground kinematic GPS – Airborne lidar – shoreline plus beach and dune topographic mapping Calculating “average annual rate of change” and projecting future shoreline position – GIS-based Shoreline Shape and Projection Program (SSAPP) Beach profile ground surveys Data availability and public awareness – Online reports – Web-based GIS using Arc. IMS software

www. beg. utexas. edu/coastal
- Slides: 34