The t distribution aka Students tdistribution is a
 is a probability distribution that is used to")
The t distribution (aka, Student’s tdistribution) is a probability distribution that is used to estimate population parameters when the sample size is small and/or when the population variance is unknown.

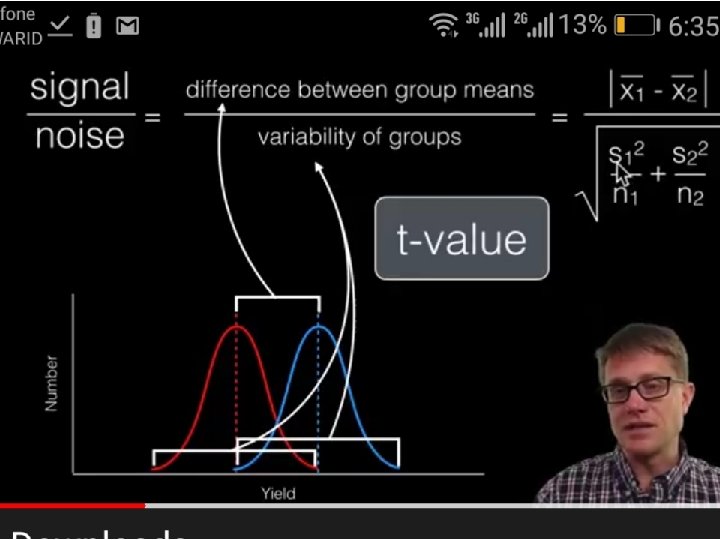
Why Use the t Distribution? According to the central limit theorem, the sampling distribution of a statistic (like a sample mean) will follow a normal distribution, as long as the sample size is sufficiently large. Therefore, when we know the standard deviation of the population, we can compute a z-score, and use the normal distribution to evaluate probabilities with the sample mean. But sample sizes are sometimes small, and often we do not know the standard deviation of the population. When either of these problems occur, statisticians rely on the distribution of the t statistic (also known as the t score), whose values are given by:
![t = [ x - μ ] / [ s / sqrt( n )](http://slidetodoc.com/presentation_image_h/28caf6d4504eba8a09f8d3bfb2561926/image-3.jpg "t = [ x - μ ] / [ s / sqrt( n )")
t = [ x - μ ] / [ s / sqrt( n ) ] where x is the sample mean, μ is the population mean, s is the standard deviation of the sample, and n is the sample size. The distribution of the t statistic is called the t distribution or the Student t distribution.

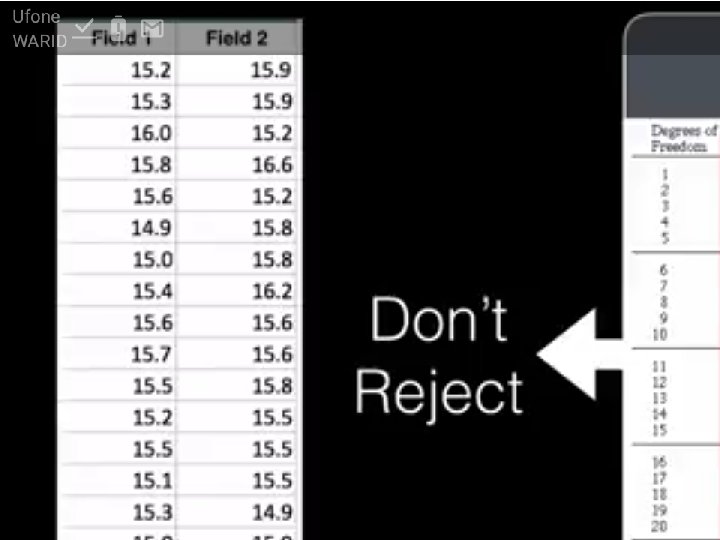
When to Use the t Distribution The t distribution can be used with any statistic if The population distribution is normal. • The population distribution is symmetric, unimodal, without outliers, and the sample size is at least 30. • The population distribution is moderately skewed, unimodal, without outliers, and the sample size is at least 40. • The sample size is greater than 40, without outliers. • The t distribution should not be used with small samples from populations that are not approximately normal.

Acme Corporation manufactures light bulbs. The CEO claims that an average Acme light bulb lasts 300 days. A researcher randomly selects 15 bulbs for testing. The sampled bulbs last an average of 290 days, with a standard deviation of 50 days. If the CEO's claim were true, what is the probability that 15 randomly selected bulbs would have an average life of no more than 290 days?

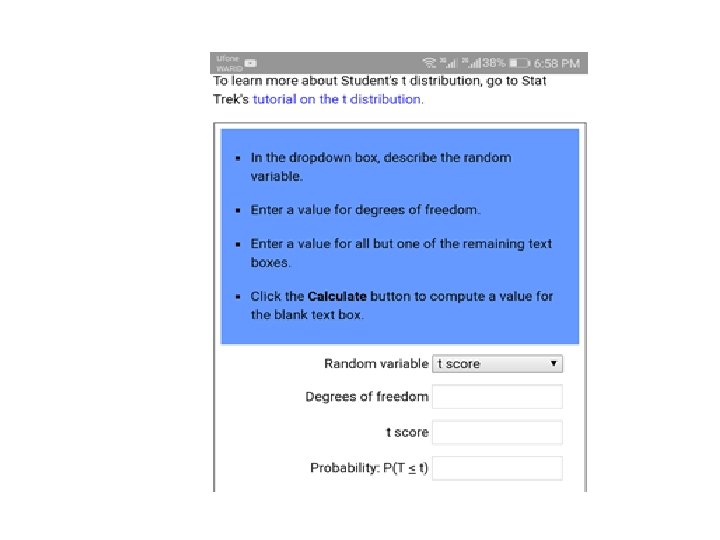
. here are two ways to solve this problem, using the T Distribution Calculator. Both approaches are presented below. Solution A is the traditional approach. It requires you to compute the t statistic, based on data presented in the problem description. Then, you use the T Distribution Calculator to find the probability. Solution B is easier. You simply enter the problem data into the T Distribution Calculator. The calculator computes a t statistic "behind the scenes", and displays the probability. Both approaches come up with exactly the same answer Solution A

The first thing we need to do is compute the t statistic, based on the following equation: t = [ x - μ ] / [ s / sqrt( n ) ] t = ( 290 - 300 ) / [ 50 / sqrt( 15) ] t = -10 / 12. 909945 = - 0. 7745966

where x is the sample mean, μ is the population mean, s is the standard deviation of the sample, and n is the sample size. Now, we are ready to use the T Distribution Calculator. Since we know the t statistic, we select "T score" from the Random Variable dropdown box. Then, we enter the following data: The degrees of freedom are equal to 15 - 1 = 14. The t statistic is equal to - 0. 7745966. The calculator displays the cumulative probability: 0. 226. Hence, if the true bulb life were 300 days, there is a 22. 6% chance that the average bulb life for 15 randomly selected bulbs would be less than or equal to 290 days.
- Slides: 11