The supernova remnant G 284 3 1 8

 1 FGL J")

")

 105 ks XMM Obs. (PI: De Luca)")


")


 Grid of 80, 000 simulations: M 1")

- Slides: 19
The supernova remnant G 284. 3 -1. 8 and the Xray binary 1 FGL J 1018. 6 -5856 Blagoy Rangelov George Washington University Collaborators: Brian Williams (NASA GSFC/CRESST/USRA) Oleg Kargaltsev (George Washington University) George Pavlov (Pennsylvania State University)
Outline Overview Analysis of G 284. 3 -1. 8 (G 284) 1 FGL J 1018. 6 -5856 (J 1018) Spectral/spatial analysis Binary evolution Summary Based on ar. Xiv: 1506. 02665 (in press, Ap. JL)
X-ray Binaries
Gamma-ray Binaries An et al. (2013)
G 284 & J 1018
G 284 72 ks Chandra Obs. (ours) 105 ks XMM Obs. (PI: De Luca)
North Region Model: phabs x vpshock Abundances: O=1 Ne = 1. 19 Mg = 1. 06 Si = 0. 19 Fe = 0. 24 k. T = 0. 67 ke. V �� = 4. 6 x 1012 cm-3 s Chandra, XMM MOS 2
West Region Model: phabs x vpshock Abundances: O=1 Ne = 1. 30 Mg = 4. 53 Si = 1. 50 Fe = 0. 97 k. T = 0. 92 ke. V �� = 1. 0 x 1011 cm-3 s Chandra, XMM MOS 1, XMM MOS 2
West region rich in Mg, spectra and abundances similar to N 49 B in LMC (Park et al. 2003), another SNR with Mg-rich ejecta. Nucleosynthesis models produce significant amounts of Mg in explosions of massive (> 25 M⊙).
1 FGL J 1018
1 FGL J 1018 An et al. (2015)
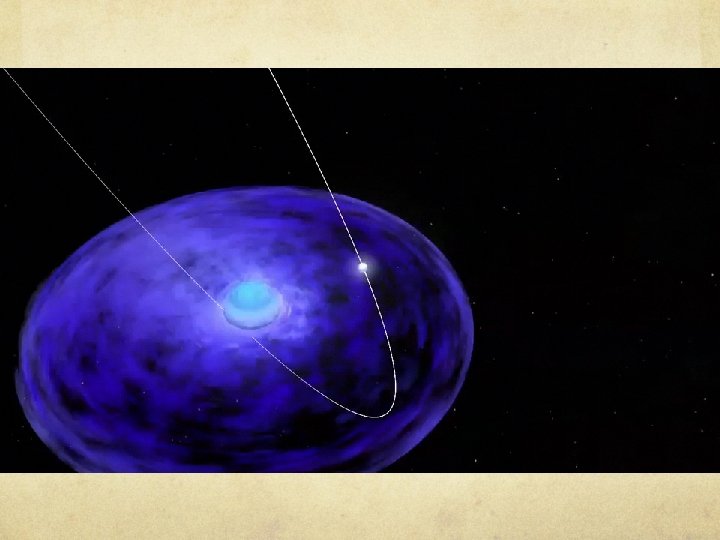
1 FGL J 1018 Chandra observations at binary phase 0. 42 and 0. 67. Power-law spectrum: n. H = 9 x 1021 cm-2 Γ ≃ 1. 75 It’s a binary: 16. 6 d period Optical counterpart O 6 V((f)) star M=30 M⊙ One of only two high-mass ɣ-ray binaries inside an SNR (SS 433 in W 50).
Point Source Analysis Profile vs. PSF model
Point Source Analysis
Binary Evolution Binary evolution code (Hurley+ 2002) Grid of 80, 000 simulations: M 1 = 10 -35 M⊙, M 2 = 12 -50 M⊙, M 2 > M 1. P=5 -50 d, e = 0 -0. 9. Best-fit reproduction with M 1 = 13. 4 M⊙, M 2 = 26. 7 M⊙, P = 18 d, e = 0. 57. Results in 2. 2 M⊙ NS.
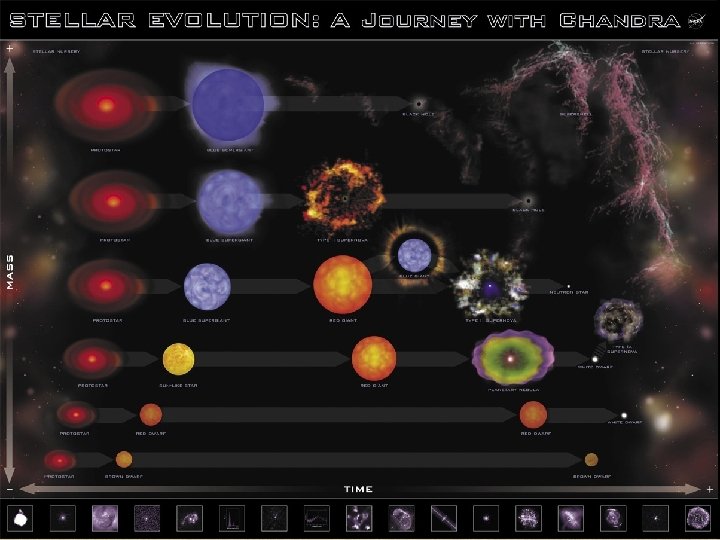
Summary SNRs can reveal information about the progenitor system. 1 FGL J 1018. 6 -5856 has a power-law spectrum. Hint of extended emission. Ejecta in SNR appear Mg-rich, very similar to LMC SNR N 49 B Nucleosynthesis models favor massive stars > 25 M⊙. Binary evolution models consistent with a heavy neutron star as compact object. ; SN progenitor ≃ 27 M⊙.