The Sunspot Cycle Convection Zone Dynamics and the


- Slides: 55

The Sunspot Cycle, Convection Zone Dynamics, and the Solar Dynamo David Hathaway NASA Marshall Space Flight Center 2011 August 1 – Space Weather Summer School http: //solarscience. msfc. nasa. gov/presentations. html

Outline • • The Sunspot Cycle Solar/Stellar Convection Zones Effects of Rotation Magnetic Dynamos

The Sunspot Cycle http: //solarphysics. livingreviews. org/Articles/lrsp-2010 -1/

Sunspot Cycle Discovery Astronomers had been observing sunspots for over 230 years before Heinrich Schwabe, an amateur astronomer in Dessau, Germany, discovered in 1844 that the number of sunspot groups and the number of days without sunspots increased and decreased in cycles of about 10 -years. Schwabe’s data for 1826 to 1843 Number of Sunspot Groups per Year Number of Spotless Days

23 Cycles and Counting Shortly after Schawbe’s discovery Rudolf Wolf proposed using a “Relative” Sunspot Number count: R = k (10 g + n) Where k is a correction factor (~0. 6) g is the number of sunspot groups and n is the number of spots The average cycle lasts about 11 years with a range from 9 to 14. The average amplitude is about 100 with a range from 50 to 200.

Sunspot Number and Solar Activity While Wolf’s Relative Sunspot Number, R, may seem contrived, it does a good job of characterizing solar activity – plus it has a long history. Sunspot Area 10. 7 cm Radio Flux M- & X-Class Flares Total Irradiance Galactic Cosmic Rays Geomagnetic Activity

Cycle Shape The average sunspot number over each sunspot cycle presents a shape of a skewed Gaussian – the rise to maximum is faster than the decline to minimum and is initially well represented by a cubic. The full cycle is well fit by a function: R(t; t 0, RM) = 2 RM [(t-t 0)/b]3 {exp[(t-t 0)/b]2 – 0. 71}-1 b = 27 + 25 (100/RM)1/4 The average of Cycles 1 -22 normalized to the average amplitude and period. The average cycle fit with the parametric function.

The Waldmeier Effect Max Waldmeier (1933, 1935) noted that big cycle rise to maximum is less time than small cycles. This effect is reflected in the cycle amplitude dependence of the cycle width parameter, b.

Cycle Prediction The two cycle parameters, starting time t 0 and maximum RM, are well determined by curve-fitting 2 -3 years after minimum. This gives a reliable estimate of solar activity levels through the remaining years of the cycle.

The Maunder Minimum The “Maunder Minimum” – a period of 70 years with virtually no sunspots - was first identified by Gustav Spörer as reported by E. Walter Maunder to the Royal Astronomical Society in 1890. It was thought for decades that this was due to a lack of observations. Jack Eddy revived interest in the Maunder Minimum in 1976. Doug Hoyt and Ken Schatten searched through sunspot observation records from 1610 to 1750 and confirmed the existence of the Maunder Minimum in 1998. In addition to grand minima like the Maunder Minimum, there appears to be a long-term periodicity of about 100 years in cycle amplitudes.

Sunspot Zones Sunspots appear in two latitude zones, one in the north and one in the south. These zones drift toward the equator as each cycle progresses. Big cycles have wider zones that extend to higher latitudes. Cycles overlap by 2 -3 years.

Spörer’s Law of Zones While Richard Carrington (1858) noted the disappearance of low latitude spots followed by the appearance of spots at higher latitudes during the transition from Cycle 9 to Cycle 10, Gustav Spörer (1880) noted the more general equatorward drift of the sunspot zones over each cycle. Differences in the positions of the sunspot zones relative to cycle amplitude disappear if time is measured relative to cycle start, t 0.

Hale’s Law In 1919 Hale (along with Ellerman, Nicholson, and Joy) found that the magnetic field in sunspots followed a definite law, “Hale’s Law” such that: “…the preceding and following spots … are of opposite polarity, and that the corresponding spots of such groups in the Northern and Southern hemispheres are also opposite in sign. Furthermore, the spots of the present cycle are opposite in polarity to those of the last cycle”.

Joy’s Law In that same 1919 paper Joy noted that sunspot groups are tilted with the leading spots closer to the equator than the following spots. This tilt increases with latitude.

Polar Field Reversals In 1959 Babcock noted that the magnetic polarities of the Sun’s weak polar fields also reverse from one cycle to the next, and that this reversal happens at about the time of sunspot cycle maximum. The dominant magnetic polarity on the poleward sides of these zones is carried toward the poles where it reverses the old cycle polarity.

The Solar Cycle in Action In addition to these magnetic polarity changes and the equatorward drift of the sunspot latitudes, there are important flows on the surface and within the Sun: Differential Rotation – faster at the equator, slower near the poles; and Meridional Flow – flow from the equator toward the poles along the surface.

Solar/Stellar Convection Zones

Stellar Convection Early type stars, O and B stars, generate so much heat the resulting temperature gradients drive convective motions in their cores. Late type stars, A through K stars, have cooler photospheres where hydrogen can recombine and lose entropy to drive convective motions in a zone near the surface. The smallest stars, M stars, become fully convective.

The Sun’s Interior Core – innermost 25% This is where the Sun’s energy is produced by the nuclear burning of hydrogen to make helium. Radiative Zone Convective Zone Radiative Zone – out to 70% The energy produced in the core is transported outward by radiative transfer (photon scattering). Convective Zone – outermost 30% The energy transferred through the radiative zone is transported to the surface by thermal convection.

Solar Convection - Granules are convective elements that cover the entire solar surface. They have typical diameters of about 1000 km and each one lasts for about 10 minutes.

Granule Simulations Stein & Nordlund (1998, 2000) simulated fully compressible convection with radiative transfer in a plane parallel layer 6 x 6 x 2. 5 Mm in size on a grid with 253 x 163 points. The emergent intensity and many other properties match the observations very well. The convection is driven by radiative cooling in the photosphere. The granule cell size is selected by the density scale height at the photosphere.

Supergranules also cover the entire solar surface. These flows are largely in the horizontal across the surface and are best seen in the Doppler velocity signal they produce. Typical supergranules are about 30, 000 km across and last for about 24 -hours.

Convection Spectrum The spectrum of convective motions in the photosphere exhibits two distinct features – a peak at spherical harmonic wavenumbers ~ 120 (35 Mm diameter cells representing supergranules) and a peak at spherical harmonic wavenumbers ~4000 (1 Mm diameter cells representing granules). Observed spectrum from SOHO/MDI. This includes the effects of foreshortening near the limb and instrumental blurring. Velocity spectrum compiled from observations by Hathaway and Shine and modeling by Nordlund

Supergranule Simulations Stein et al. (2009) have run simulations of solar-like convection in plane parallel layers 96 x 20 Mm in size on a grid with 1000 x 500. The simulated depth includes the hydrogen ionization zone and the first and most of the second helium ionization zones. The dominant horizontal scale of the convection increases monotonically with depth – but with no distinct supergranule cell size. Vertical velocity at different depths (red-inward).

Giant Cells? Simon & Weiss (1968) suggested that there should be giant convection cells that span the entire convection zone. There are many theoretical models and a few tentative detections but no irrefutable evidence for their existence, much less their sizes and lifetimes.

Effects of Rotation

Surface Differential Rotation Measurements of the Sun’s rotation using a variety of methods all show a rapidly rotating equator and more slowly rotate polar regions. However, different features have slightly faster or slower rotation – depending on the characteristic depth to which the feature extends. Small (Network) magnetic feature rotation relative to the Carrington rotation (8 -hour time lag). Doppler feature (supergranules) rotation relative to the Carrington rotation (2 -hour time lag).

Internal Rotation Observations The internal rotation determined from helioseismology is constant on cones throughout the bulk of the Convection Zone. At the surface the rotation rate increases inward through the surface shear layer (the outer 5%). At the base of the convection zone is a shear layer, the tachocline, in which the rotation decreases inward at low latitudes and increases inward at high latitudes to match the 27 day rotation of the radiative zone. R. Howe

The Rossby Number The importance of rotation on the fluid motions is characterized by the Rossby Number (Ro) – the ratio of the inertial term to the Coriolis term in the momentum equation. Large Rossby Numbers (Ro > 1) indicate weak rotation effects while small Rossby Numbers (Ro < 1) indicate strong rotation effects – restructuring of the flows and flow structures. For the Sun, Ω ~ 3 10 -6 s-1. Granules: U ~ 3 103 m s-1 L ~ 1 106 m Ro~ 1000 Supergranules: U ~ 3 102 m s-1 L ~ 3 107 m Ro~ 3 Giant Cells: U ~ 10 m s-1 L ~ 1 108 m Ro~ 0. 03

Sidebar: Reynolds Stresses Consider the x-component of the momentum equation for an incompressible fluid in Cartesian coordinates: ∂u/∂t + u ∂u/∂x + v ∂u/∂y + w ∂u/∂z = ∂u/∂t + ∂(uu)/∂x + ∂(vu)/∂y + ∂(wu)/∂z =1/ ∂p/∂x + 2 u Separating the velocity components into mean and fluctuating parts: u = <u> + u And then taking the mean of the momentum equation gives: ∂<u>/∂t + ∂ (<u> <u>)/∂x + ∂ (<v> <u>)/∂y + ∂ (<w> <u>)/∂z + ∂ <u u >/∂x + ∂ <v u >/∂y + ∂ <w u >/∂z = 1/ ∂p/∂x + 2 u The terms in yellow represent the divergence of a momentum flux or a Reynolds Stress which can drive a mean flow in the x-direction.

Rotation Effects on Giant Cells Numerical Simulations of compressible convection in rotating spherical shells (Gilman & Miller 1986) show that “banana” shaped cells dominate. The Coriolis force acting on the horizontal flows in these cells produces a correlation between prograde and equatorward moving fluid elements. This “Reynolds Stress” or momentum flux gives an accumulation of angular momentum at the equator. Gilman & Miller (1986)

Surface Shear Layer Foukal & Jokipii (1975) noted that magnetic structures rotated ~5% faster than the photospheric plasma at any given latitude. They suggested that this might be due to conservation of angular momentum by fluid elements in the outer convection zone. δΩ/Ω ~ 2 δr/r Helioseismic measurements indicate that the rotation increases to a depth of about 35 Mm – the outer 5%. Simulations by Gilman & Foukal (1979) and Hathaway (1982) supported this conclusion.

Internal Rotation Models Hydrodynamic models of thermal convection in rotating spherical shells can produce rapidly rotating equators but tend to have internal rotation profiles with angular rotation rates constant on cylinders. Gilman & Miller (1986) Miesch et al. (2000)

Surface Meridional Flow Prior to the mid-90 s the meridional flow was poorly constrained. It is now known to be poleward with a speed of 10 -20 m/s but with different techniques giving different speeds (depending on depth).

Meridional Flow A meridional flow can be driven by a combination of three forcing terms: 1) the Coriolis force acting on the differential rotation; 2) a latitudinal pressure/temperature gradient; 3) a Reynolds stress due to correlations between radial and latitudinal motions in the convective flows. Simulations of compressible convection in rotating spherical shells gave highly structured and variable meridional flows. Miesch et al. (2000)

Solar Cycle Variations in Flow Amplitude While the differential rotation does vary slightly over the solar cycle, it is the meridional flow that shows the most significant variation. The Meridional Flow slowed from 1996 to 2001 but then increased in speed again after maximum. The slowing of the meridional flow at maximum seems to be a regular solar cycle occurrence (Komm, Howard, & Harvey, 1993). The greater speed up after maximum is specific to Cycle 23. Differential rotation variations Meridional flow variations

Solar Cycle Variations in Flow Structure The differential rotation and meridional flow profiles for each solar rotation also show that the differential rotation changes very little while the meridional flow changes substantially. Differential rotation profiles Meridional flow profiles

Differences from Average Removing the average, symmetric profiles reveals the torsional oscillations (faster rotation on the equatorward side of the sunspot latitudes and slower poleward with faster polar rotation at maximum) and a system of inflows toward the sunspot latitudes. The equatorward inflow at higher latitudes is identified as the source of the slower meridional flow at cycle maxima. Countercells are seen near the poles. Differential Rotation Meridional Flow

Magnetic Dynamos

Dynamo Fundamentals Dynamo theory developed in the 40 s and 50 s from simplified MHD equations. Two key processes were identified – the Omega Effect (shearing of the magnetic field by the differential rotation) and the Alpha Effect (lifting and twisting of the magnetic field by helical convective motions). Alpha (α) Omega (Ω)

Babcock (1961) a) Dipolar field at cycle minimum threads through a shallow layer below the surface. b) Differential rotation shears out this poloidal field to produce a strong toroidal field (first at the mid-latitudes then progressively lower latitudes). c) Buoyant fields erupt through the photosphere giving Hale’s polarity law and Joy’s Tilt. d) Proposed Meridional flow away from active latitude gives reconnection at the poles and equator.

Leighton (1969) • Supergranules (which were “discovered” by Leighton, Noyes, & Simon in 1962) provide diffusive transport of 104 km 2/s in the photosphere (no meridional flow as in Babcock’s model). • A rotation rate increasing inward is required for equatorward drift of the active latitudes. • A numerical model for the depth and longitude averaged magnetic field can reproduce many observed aspects – provided several adjustable parameters are set.

Mean Field Theory

αΩ Dynamos • Toroidal field, Bɸ, is generated from poloidal field by the Omega effect – shearing by differential rotation - Ω. • Poloidal field, Aɸ, is generated from toroidal field by the alpha effect – cyclonic flows – α~v· v. • A dynamo wave travels along isorotation surfaces with frequency ~ α Ω

3 D-MHD Dynamos • Gilman & Miller (1981) “Dynamically consistent nonlinear dynamos driven by convection in a rotation spherical shell” • Glatzmeier (1985) “Numerical simulations of stellar convective dynamos. II. Field propagation in the convection zone” • Oscillatory dynamos were produced • The dynamo waves moved poleward • The periods were too short by 10 x

Dynamo Dilemma #1 Equatorward propagation could be achieved if the rotation rate increased inward across the convection zone. However, the α-effect in the bulk of the convection zone is orders of magnitude too large and gives short period (2 -year instead of 22 -year) dynamos no matter how the internal rotation rate varies.

Dynamo Dilemma #2 The toroidal magnetic produced in the convection zone should be buoyant and rise rapidly to the surface (Parker, 1975).

Dynamo Dilemma #3 Observed (Helioseismology) Hydrodynamic Model Kinematic Model The internal rotation profile determined with helioseismic methods shows shear layers at the top and bottom of the convection zone with nearly constant rotation rate in between – unlike the rotation profiles produced in the hydrodynamic models or assumed in the kinematic dynamo models.

Interface Dynamos All three dilemmas could be circumvented if the dynamo was placed at the base of the convection zone. Parker (1975) made this suggestion early on to solve the magnetic buoyancy dilemma. De. Luca & Gilman (1986) produced dynamo models in which the overshooting convective motion act on the magnetic field and could produce longer period dynamo oscillations. The dynamics of flux tubes rising rapidly through a rotating convection zone dramatically reduces the twisting otherwise produced by the convection itself.

Dynamo Dilemma #4 The shear layer at the base of the convection zone has rotation rate decreasing inward at latitudes below about 30º and increasing inward at higher latitudes. This gives two dynamo waves – one moving toward the equator below 30º and another moving poleward at higher latitudes.

Flux Transport Dynamos Dikpati & Choudhuri (1994, 1995) proposed flux transport dynamos like those of Babcock and Leighton but with key differences. 1) The Ω-effect is in the shear layer at the base of the convection zone. 2) The α-effect is produced by the Coriolis force on rising flux tubes. 3) A poleward meridional flow at the surface facilitates polar field reversals. 4) The return flow at the base of the convection zone gives the equatorward drift of the active latitudes and the 22 -year period of the magnetic cycle.

A Flux Transport Dynamo Dikpati & Charbonneau (1999) investigated the characteristics of these dynamos and their sensitivity to changes in flow parameters. The meridional flow speed controls both the dynamo period and its strength. In/CCW Out/CW

Dynamo Dilemma #5 To account for Cycle 23’s weak polar fields and long minimum Flux Transport Dynamos require fast meridional flow early in the cycle and slow meridional flow late in the cycle (Nandy et al. 2011). The observed meridional flow did exactly the opposite (Hathaway & Rightmire 2010, 2011) and the equatorward drift of the sunspot zones showed no variation from the standard law.

Shallow Meridional Circulation Cross-correlating the Doppler signal from the convective motions at different time lags gives the differential rotation and meridional flow at different depths. The peak of the differential rotation is found for 24 -hour time lags. At 32 -hours the differential rotation is slower and the meridional flow is equatorward (no longer poleward. This indicates that the meridional circulation is confined to the surface shear layer.

Suggests that Dynamo Theory needs New Direction A meridional circulation confined to the surface shear layer suggests that Flux Transport Dynamos cannot be correct. The Flux Transport Dynamos developed over the last decade and a half ALL assume that the poleward meridional flow at the surface returns to the equator at the base of the convection zone with a velocity determined by the surface flow. Babcock (1961) may have been closer to the solution.
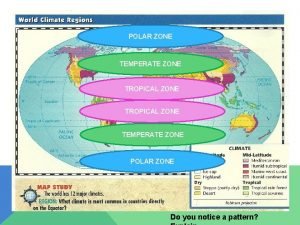
 Tropical temperate and polar zones
 Intertidal zone neritic zone and oceanic zone
 Source zone transition zone and floodplain zone
 Reddish loops of gas
 Reddish loops of gas that link parts of sunspot regions
 Sunspot solar oven
 Sunspots magnetic field
 Conducting zone of the respiratory system function
 Respiratory zone of the respiratory system
 Zone of aeration and zone of saturation
 Underground water table
 Photic zone and aphotic zone venn diagram
 Zone 1 and zone 2
 Water cycle heat transfer
 Zone chaude et zone froide magasin
 Latitude in climate
 Minute ventilation normal
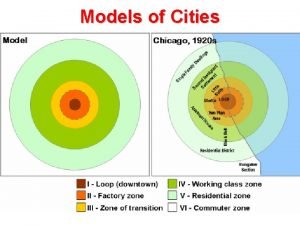
 Centric zone model
 Conduction
 How does heat energy flow
 Venn diagram matter
 Plate tectonics
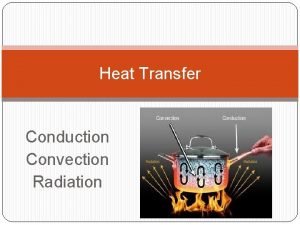
 What is heat transfer conduction convection and radiation
 Characteristic length for cylinder
 Venn diagram of conduction, convection and radiation
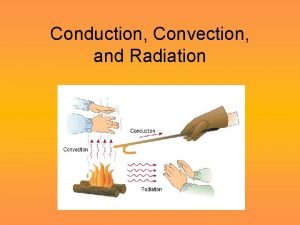
 Whats conduction convection and radiation
 Does radiation travels in straight lines
 Radiation examples
 Convection conduction radiation
 Example of radiation
 Heat transfer objectives
 Define thermal energy
 How are conduction convection and radiation alike
 Process of conduction
 Difference between conduction convection and radiation
 Conduction, convection radiation diagram
 Difference between phosphorus cycle and carbon cycle
 Difference between phosphorus cycle and carbon cycle
 Difference between open cycle and closed cycle gas turbine
 Simple cycle and greedy cycle
 Chapter 5 two-cycle and four-cycle engines answers
 Mhd generator ppt
 Two examples of convection
 Convection of 1818
 Thermoneutral environment for neonates
 Convection summary
 Level of free convection
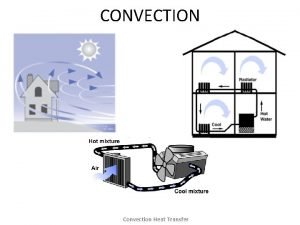
 Convection
 2 examples of convection
 Convection definition
 Evaporation heat loss newborn
 Convection definition
 What cause convection currents
 What is the heat source for convection currents
 Convection currents definition
 Convective heat transfer coefficient formula
