The Structure of Human Gene and Genome Nattiya


 Ribbon diagram of the nucleosome shown")


 The")


, which has been sequenced in its")


- Slides: 58
The Structure of Human Gene and Genome Nattiya Hirankarn, MD, Ph. D Dept of Microbiology Faculty of Medicine Chulalongkorn University
Further Reading • ������� “������ ” • http: //www. ncbi. nlm. nih. gov/books • book lists – Molecular Cell Biology – Genome
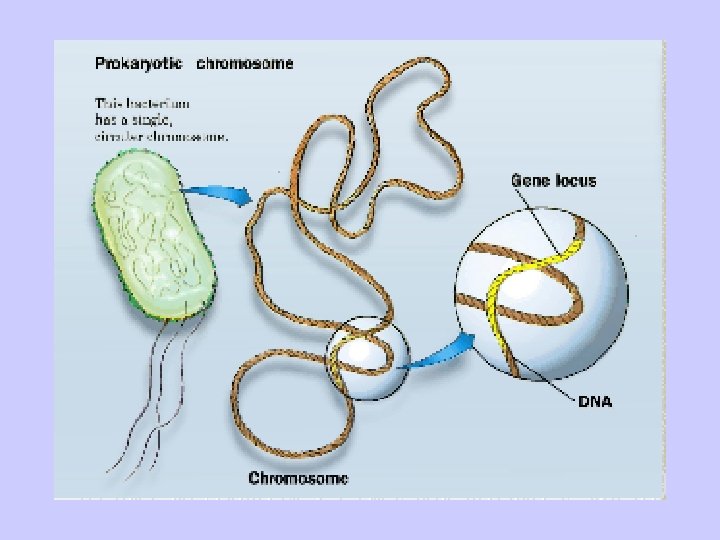
Genome
Chromosome change structure dramatically during cell cycle • Cell cycle consists of a nuclear division and the interphase • Mitosis is a marvelous copying process, prophase, prometaphase, anaphase, and telophase : chromosome is highly organized and condensed • During Interphase the chromosomes are diffuse and the nuclear envelop is intact
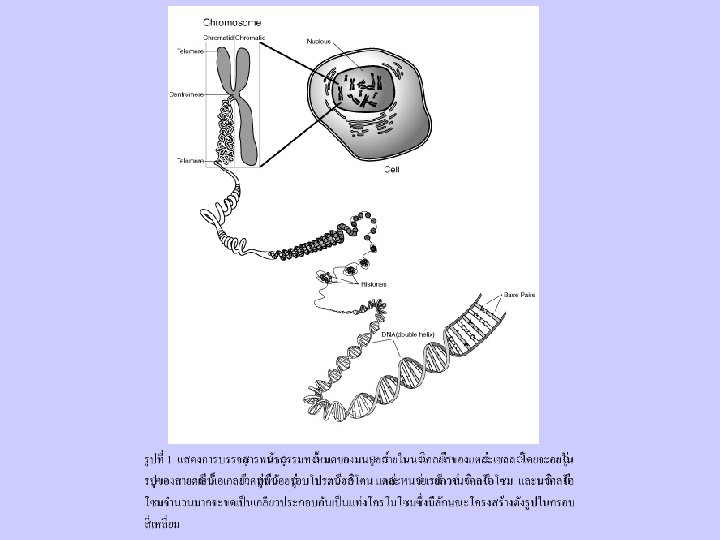
Key Concepts *Metaphase chromosomes have a protein scaffold to which the loops of supercoiled DNA are attached *DNA of interphase chromatin is a tangled mass occupying a large part of the nuclear volume
* A nucleosome contains ~ 200 bp of DNA, 2 copies of each core histone (H 2 A, H 2 B, H 3, H 4) and 1 copy of H 1 *DNA is wrapped around the outside surface of the protein octamer
Figure 9 -30. Structure of the nucleosome. (a) Ribbon diagram of the nucleosome shown face-on (left) and from the side (right). One DNA strand is shown in green and the other in brown. H 2 A is yellow; H 2 B, red; H 3, blue; H 4, green. (b) Space-filling model shown from the side. DNA is shown in white; histones are colored as in (a). H 2 A, H 2 B, H 3, and H 4 indicate the positions of the respective histone N-terminal tails visible in this view. The H 2 A N-terminal tail interacts with the upper loop of DNA, while the H 2 A N-terminal tail (only partially seen in this view) interacts with the bottom loop of DNA. The N-terminal tail of one H 4 extends from the bottom of the nucleosome and interacts with the neighboring histone octamer in the crystal lattice (not shown). The N-terminal tails of histones H 2 B, H 3, and H 3 pass between the two loops of DNA. The N-terminal tails of H 2 A, H 4, H 3, and H 2 B include an additional 3, 15, 19, and 23 residues, respectively, that are not visualized in the crystal structure because they are not highly structured. They extend further from the surface of the nucleosome where they may participate in nucleosome-nucleosome interactions in the 30 nm fiber or interact with other chromatin-associated proteins. [From K. Luger et al. , 1997, Nature 389: 251; courtesy of T. J. Richmond [.
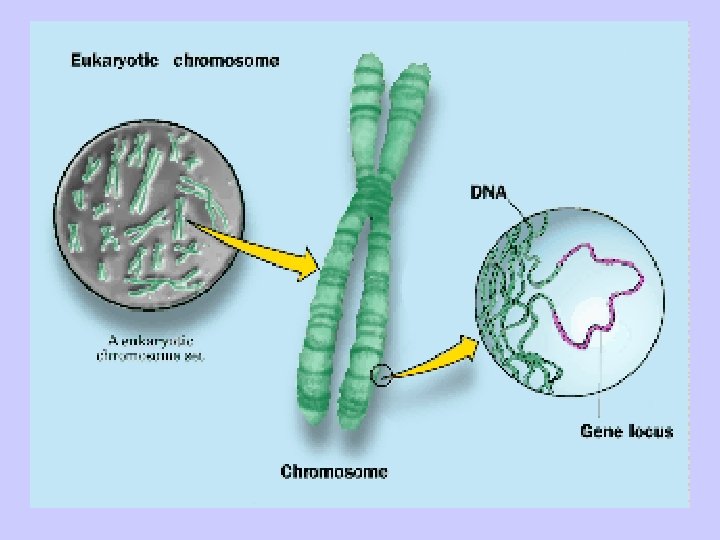
Chromatin • Individual chromosomes can be seen only during mitosis • Chromatin is the DNA-protein complex in chromosome • During interphase, the general mass of chromatin is in the form of euchromatin, which is less tightly packed than mitotic chromosomes • Regions of heterochromatin remain densely packed throughout interphase
Bandind Pattern (The human karyogram( • Certain staining techniques cause the chromosomes to have the appearance of a series of striations called G-bands • The bands are lower in G -C content than the interbands • Genes are concentrated in the G-C rich interbands
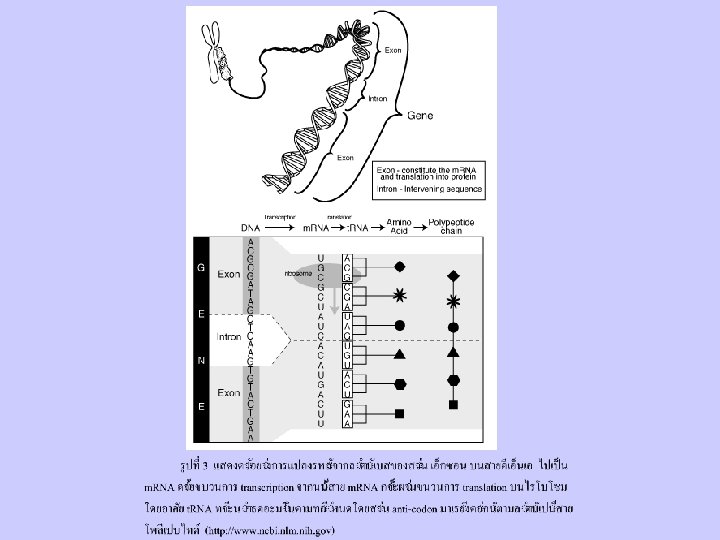
Gene
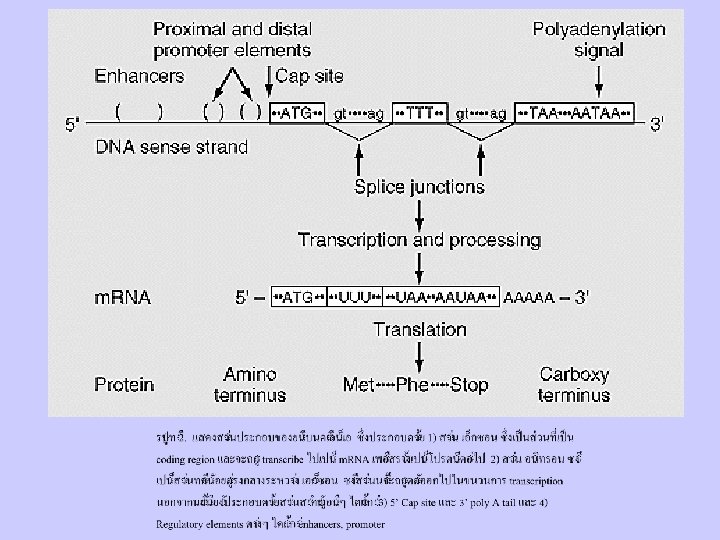
Figure 9 -1. Comparison of bacterial operons and simple eukaryotic transcription units. (a) The trp operon in the E. coli genome contains five genes (A E) encoding enzymes required for synthesis of tryptophan. A control region located near the start site regulates transcription of the entire operon, which yields an 7 -kb polycistronic m. RNA. A mutation within the transcription-control region (a) can prevent expression of all the proteins encoded by the trp operon. In contrast, a mutation within any one gene of an operon (e. g. , b in the trp. A gene) generally affects only the protein encoded by that gene (Trp. A protein). (b) A simple eukaryotic transcription unit includes a region that encodes one protein, extending from the 5 cap site to the 3 poly(A) site, and associated control regions. Intron sequences, which lie between exons, are removed during processing of the primary transcripts and thus do not occur in the functional monocistronic m. RNA. Dashed lines indicate spliced-out introns. Mutations in a transcription-control region (a, b) may reduce or prevent transcription, thus reducing or eliminating synthesis of the encoded protein. A mutation within an exon (c) may result in an abnormal protein with diminished activity. A mutation within an intron (d) that introduces a new splice site results in an abnormally spliced m. RNA encoding a nonfunctional protein.
Figure 9 -2. Two examples of complex eukaryotic transcription units and the effect of mutations on expression of the encoded proteins. The RNA transcribed from a complex transcription unit (blue) can be processed in alternative ways to yield two or more functional monocistronic m. RNAs. Dashed lines indicate splicedout introns. (a) A complex transcription unit whose primary transcript has two poly(A) sites produces two m. RNAs with alternative 3 exons. (b) A complex transcription unit whose primary transcript undergoes exon skipping during processing produces alternative m. RNAs with the same 5 and 3 exons. In this example, some cell types would express the m. RNA including exon 3, whereas in other cell types, exon 2 is spliced to exon 4, producing an m. RNA lacking exon 3 and the protein sequence it encodes. In (a) and (b), mutations (designated a) within exons shared by the alternative m. RNAs (solid red) affect the proteins encoded by both alternatively processed m. RNAs. In contrast, mutations (designated b and c) within exons unique to one of the alternatively processed m. RNAs (red with diagonal lines) affect only the protein encoded by that m. RNA.
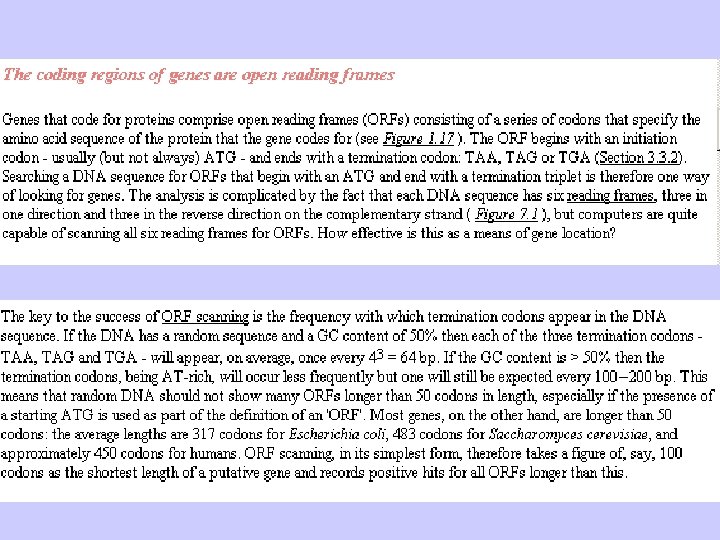
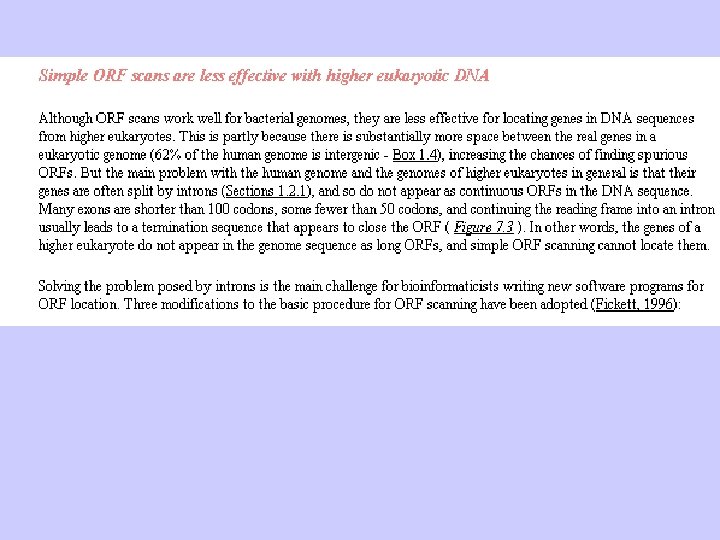
How can the number of genes in the genome be identified? • By defining open reading frame • By defining the number of genes directly in terms of transcriptome (by directly identifying all the m. RNAs) or proteome (by directly identifying all the proteins( • Note: The number of genes is less than the number of potential proteins because of alternative splicing
Read more in“Locating the Genes in the Genome Sequence” in Genomes 2 nd edition
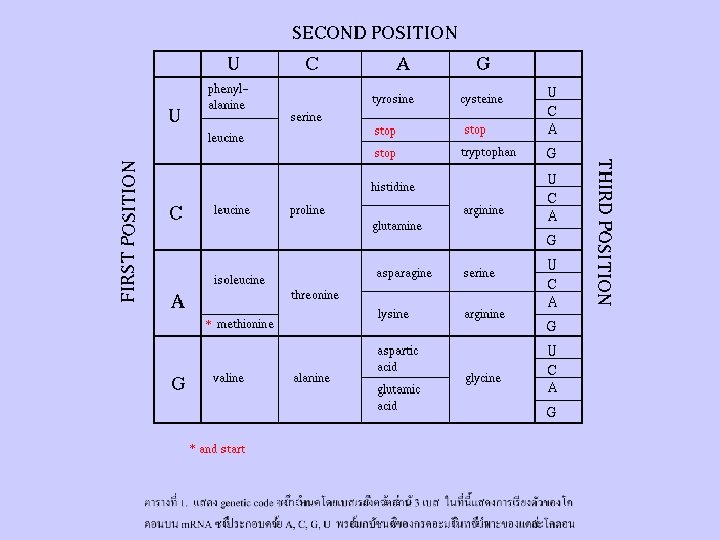
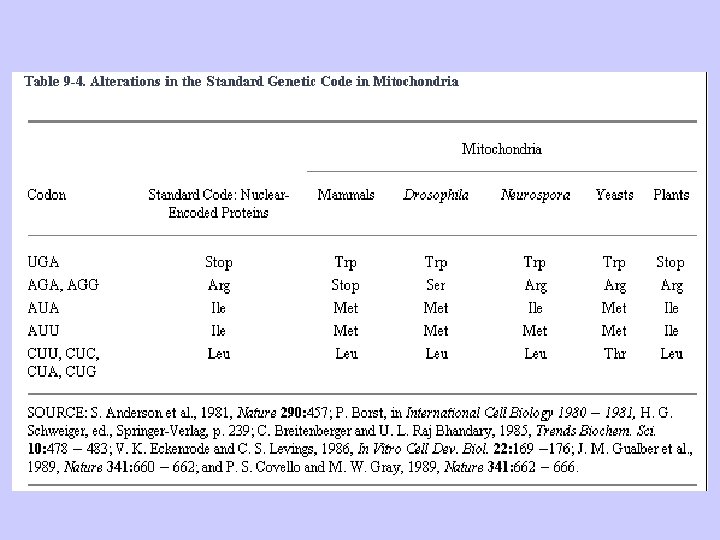
The Genetic Code (������ (
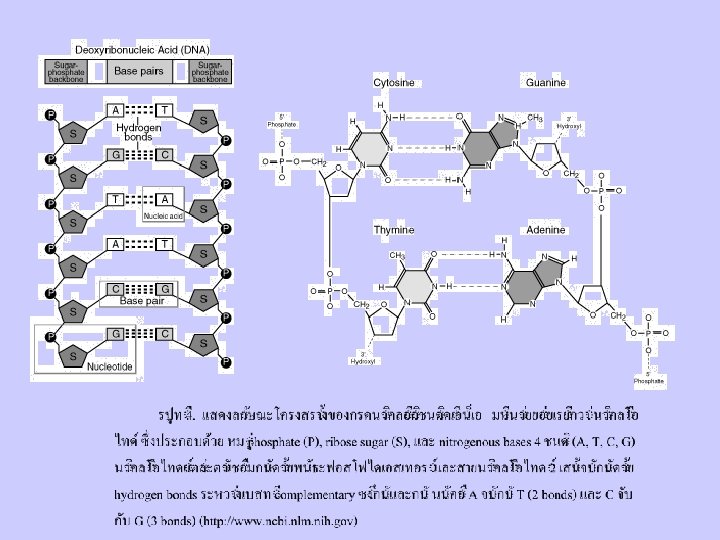
Nucleic Acid
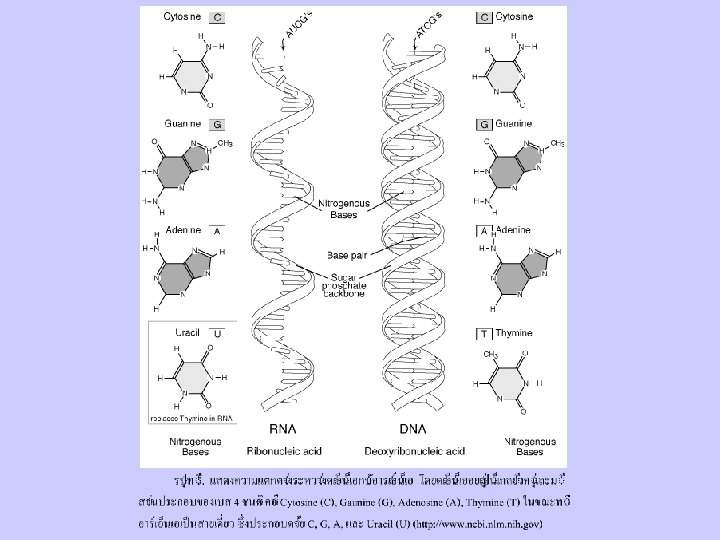
DNA and RNA
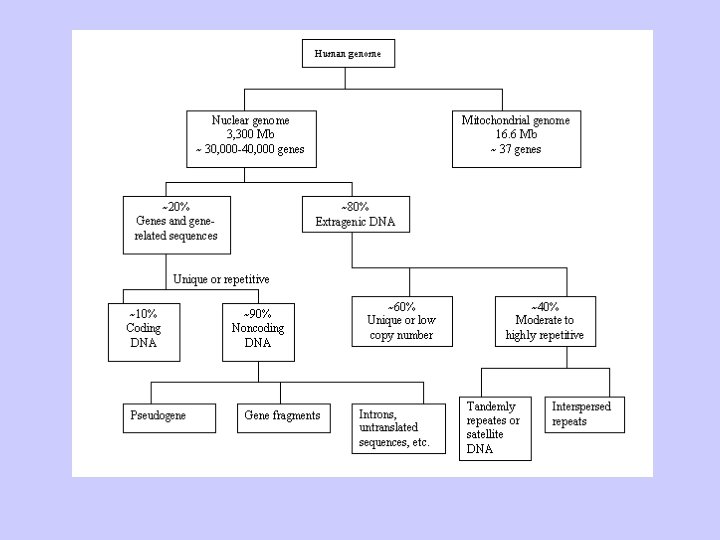
DNA composition within the Genome
Extragenic DNA
Interspersed Repeated DNA
Satellite Repetitive DNA
Mitochondria Genome
Figure 9 -44. Human mitochondrial DNA (mt. DNA), which has been sequenced in its entirety. Proteins and RNAs encoded by each of the two strands are shown separately. Transcription of the outer (H) strand occurs in the clockwise direction and of the inner (L) strand in the counterclockwise direction. The abbreviations for amino acids denote the corresponding t. RNA genes. ND 1, ND 2, etc. , denote genes encoding subunits of the NADHCo. Q reductase complex. The 207 -bp gene encoding F 0 ATPase subunit 8 overlaps, out of frame, with the N-terminal portion of the segment encoding F 0 ATPase subunit 6. No mammalian mt. DNA genes contain introns, although intervening DNA lies between some genes. [See D. A. Clayton, 1991, Ann. Rev. Cell Biol. 7: 453[.
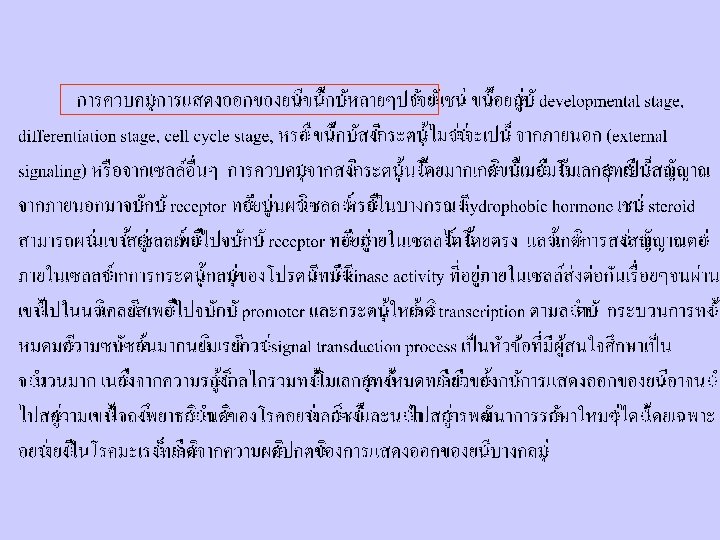
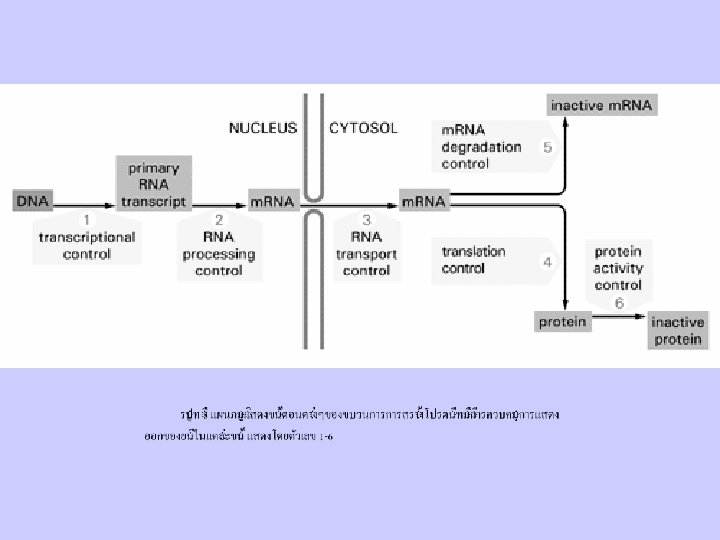
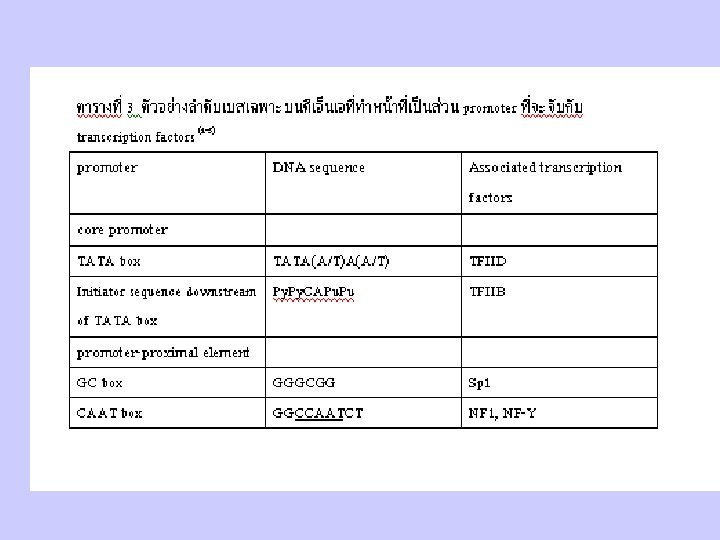
Gene Function and Control
The Inheritance of Gene
Molecular Genetic Analysis
Mutation
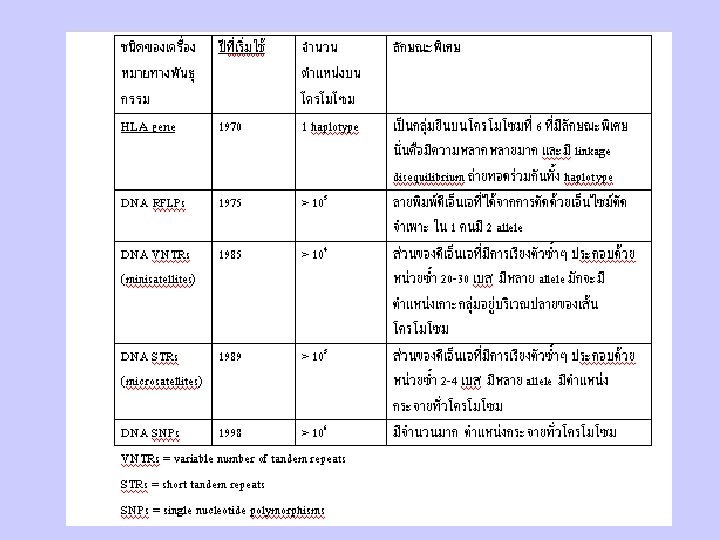
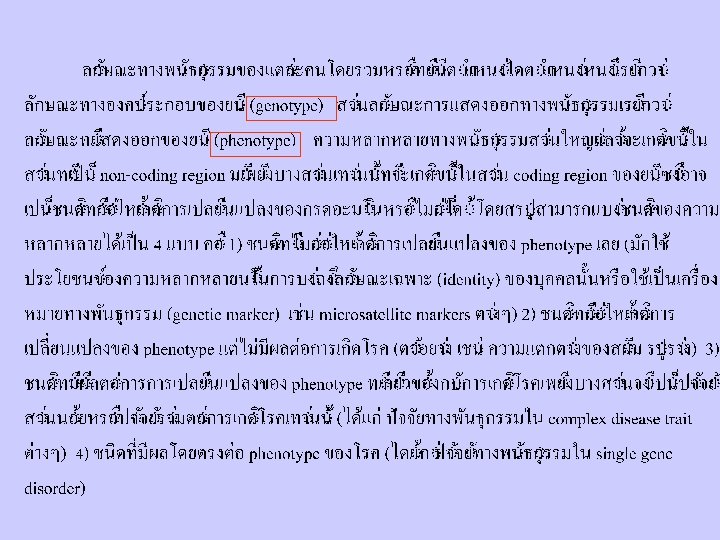
Genetic Variation & Polymorphism
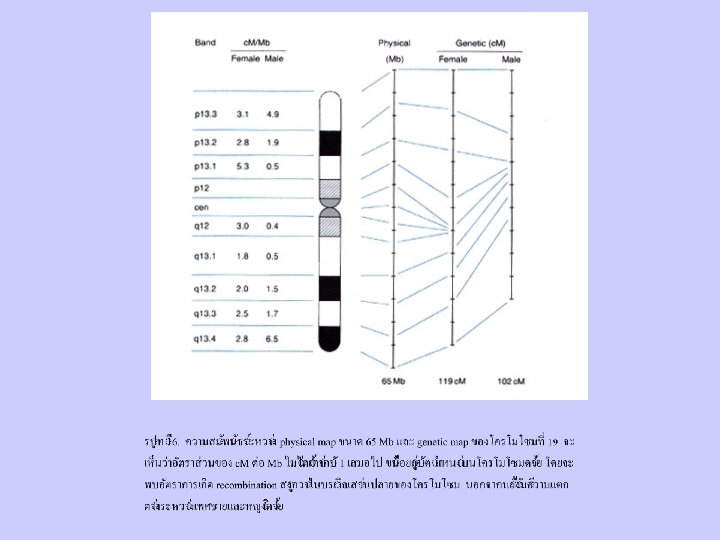
Gene Mapping
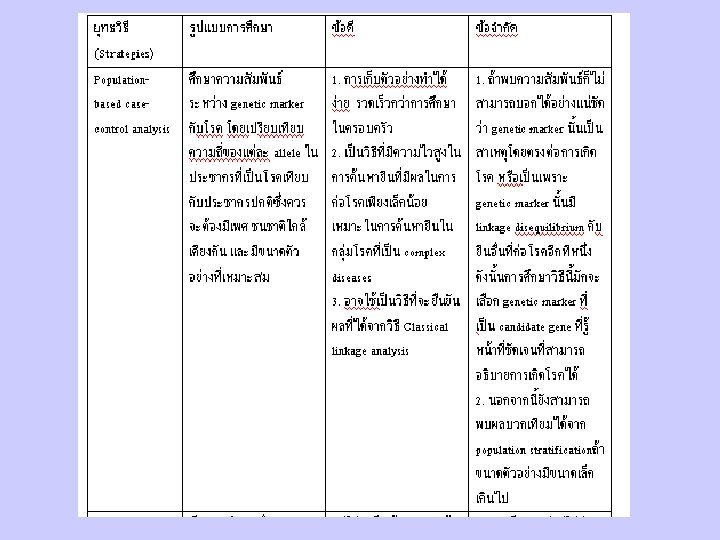
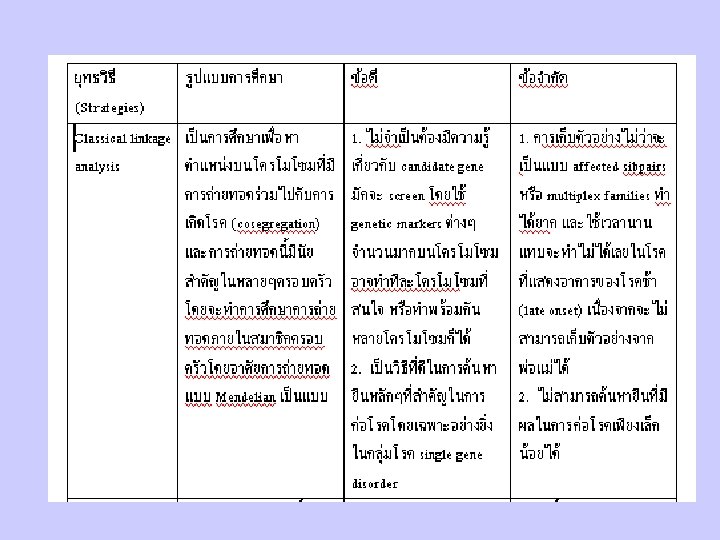
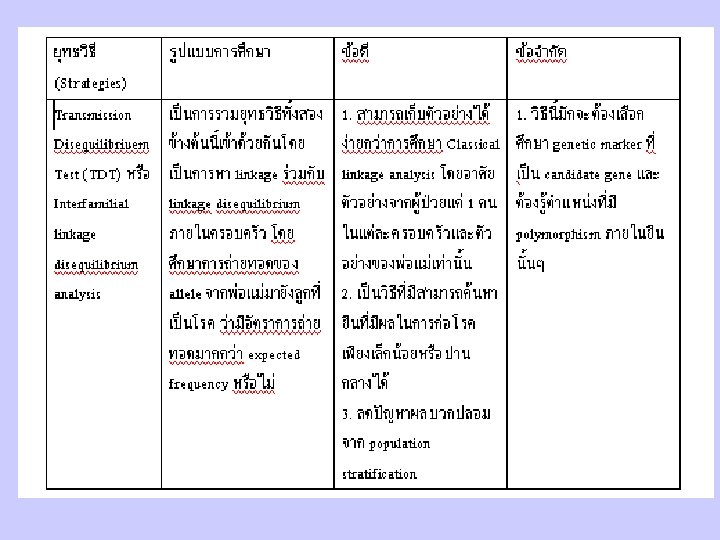
Principles and Strategies in Identify Disease Genes
Human Genome Project