The Standardized Infection Ratio Steven P Hudson MBA

The Standardized Infection Ratio Steven P Hudson, MBA, MA Statistician Health Care Excel, Inc
 is and how it is")
Objectives • Describe what the Standardized Infection Ratio (SIR) is and how it is calculated. • Explain how to generate and interpret a report utilizing the SIR.
 is a")
What is a standardized infection ratio? § The standardized infection ratio (SIR) is a summary measure used to track healthcareassociated infections (HAIs) at a national, state, or local level over time. The SIR adjusts for patients of varying risk within each facility. - The National Healthcare Safety Network (NHSN)

The SIR calculation • In HAI data analysis, the SIR compares the actual number of HAIs reported (observed) with the baseline U. S. experience (expected/predicted), adjusting for several risk factors that have been found to be significantly associated with differences in infection incidence. number of observed (O) SIR= number of expected (E) – NHSN aggregate data are used as the standard population and considered the baseline U. S. experience – NHSN baseline data used in a SIR are used to calculate the expected or predicted number of HAIs adjusting for the identified risk factors.

What does the SIR number mean? • Accounting for differences in the types of patient followed: – A SIR greater than 1. 0 indicates that more HAIs were observed than predicted. – A SIR less than 1. 0 indicates that fewer HAIs were observed than predicted. – A SIR equal to 1. 0 indicates the same number of HAIs were observed than predicted. • However, the SIR alone does not imply statistical significance.

Statistical significance of the SIR: p-value and 95% confidence intervals • The SIR is only a point estimate and needs additional information to indicate if it is statistically significantly different from 1. • A 95% confidence interval (CI) and a p-value are calculated by NHSN for each SIR and determines statistical significance. – A 95% CI assesses the magnitude and stability of a SIR. Therefore, a 95% CI is the range of estimated SIR values that have a 95% probability of including the true SIR for the population. – If the 95% CI does not contain the value 1, the SIR is “statistically significant. ” – If the p-value is less than 0. 05, the SIR is “statistically significant. ”

Statistical Significance § If the p-value is less than. 05, then your rates are different than the national average § If the confidence level does not overlap 1, then your rates are different than the national average.

I was just getting used to rates, why the SIR? More sensitive for low denominators Ability to combine data Useful for predicting state and national rates

OK , I’m no statistician-what’s all this mumbo jumbo about? The SIR In simple terms- you are compared to the average of a referent population and adjusted for risk In this case, it is a historical control.
 SIR= Expected (expected number of infections)")
Calculation Observed (actual number of Infections) SIR= Expected (expected number of infections)

Let’s take a closer look Hospital A : Type of ICU Number of Infections Line days My rate NHSN Mean Med/ Surg 1 865 1. 1 2. 1 SICU 0 1000 0 2. 8 CCICU 2 948 2. 1 1. 1 MICU 2 1000 2. 1

Turned into SIR Type of ICU Number of infections Number expected SIR Observed/ expected Med/ Surg 1 0. 95 1. 05 SICU 0 2. 8 0 CCICU 2 0. 93 2. 1 MICU 2 2. 1 0. 95 SIR is less than 1 P VALUE

Simply Put • A SIR of 1. 0 means the observed number of infections is equal to the number of expected infections. • A SIR above 1. 0 means that the infection rate is higher than that found in the "standard population. " For HAI reports, the standard population comes from data reported by the hundreds of U. S. hospitals that use the NHSN system. The difference above 1. 0 is the percentage by which the infection rate exceeds that of the standard population. • A SIR below 1. 0 means the infection rate is lower than that of the standard population. The difference below 1. 0 is the percentage by which the infection rate is lower than that experienced by the standard population.

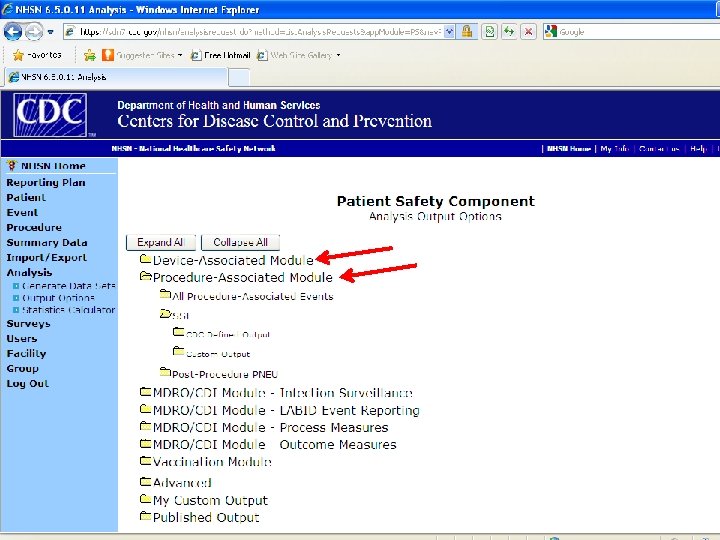
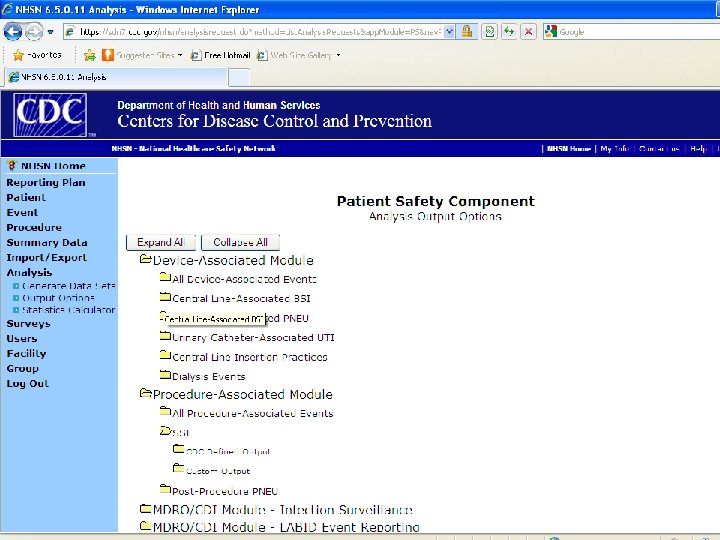
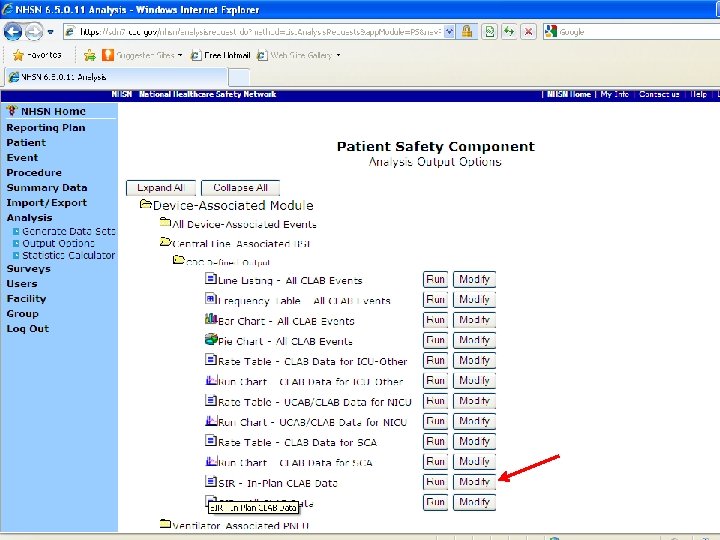
How to generate NHSN SIR outputs 1. Log into NHSN --> enter the Patient Safety Module 2. Starting from the blue navigation menu on the left, click “Analysis” --> “Generate Data Set” --> “Generate New” (note: this will take some time to load) 3. Click “Analysis” --> “Output Options” 4. On the white screen, click “Device-Associated Module” --> “Central Line-Associated BSI” --> “CDC Defined Output” --> “SIR – In-Plan CLAB Data” 5. Select “Run” for data aggregated by 6 -month intervals and CDC location type or select “Modify” to customize the output

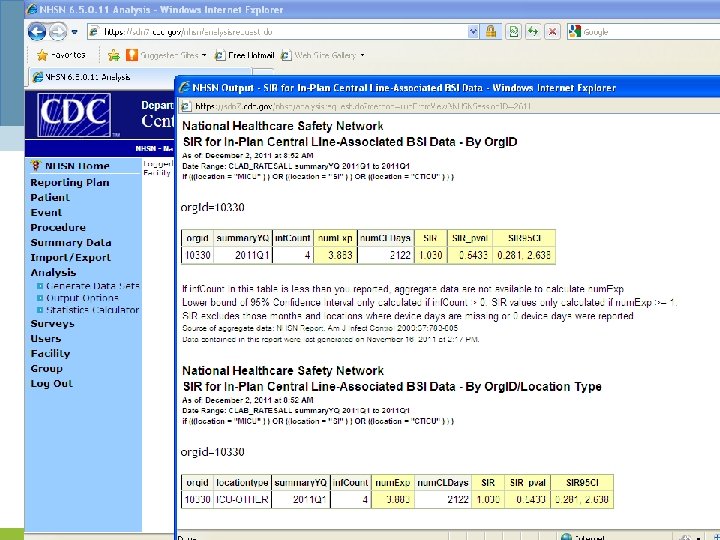
Conducting your own analysis

orgid=10330

Surgical SIR

SSI SIR

SSI data are summarized like they are for CLABSIs:

Interpreting the SIR • During 2009, there were 524 procedures performed and 13 SSIs identified. • Based on the NHSN 2006 -2008 baseline data 6. 687 SSIs were expected. • This results in a SIR of 1. 94 (13/6. 687), signifying that during this time period our facility identified 94% more SSIs than expected. • The p-value and 95% confidence interval indicate that the number of observed SSIs is significantly higher than the number of expected SSIs.

The SIR PROS CONS Surgical risk adjustment is a significant improvement Risk adjustment still suboptimal – especially with CLABSI data Consistent with other types of data such as mortality Not designed to compare one institution to another- only to compare with national average Advantages with rare events Potential problems with ranking , etc Overall rates can cloud the big picture

Questions ?

Contact Info § Email: shudson@kyqio. sdps. org § 502 -454 -5112 ext 2252 This material was prepared by Health Care Excel, the Medicare Quality Improvement Organization for Indiana, under contract with the Centers for Medicare & Medicaid Services (CMS), an agency of the U. S. Department of Health and Human Services. The contents presented do not necessarily reflect CMS policy. 10 SOW-IN-INDPAT-13 -012 4/1/13 27
- Slides: 27