
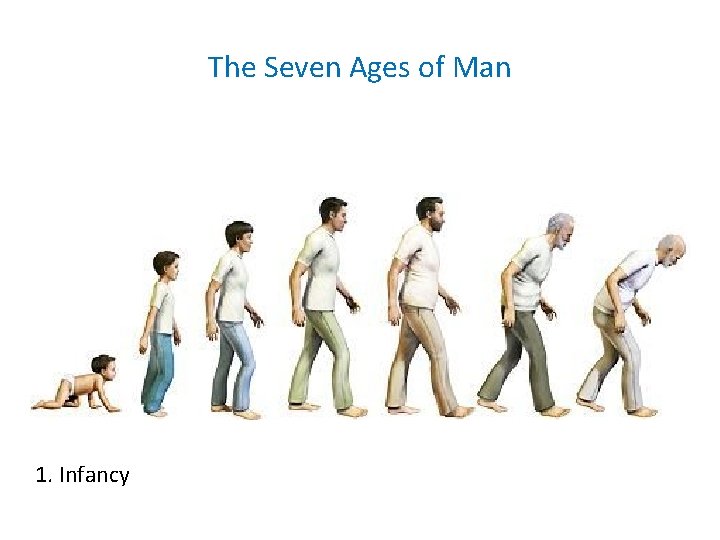
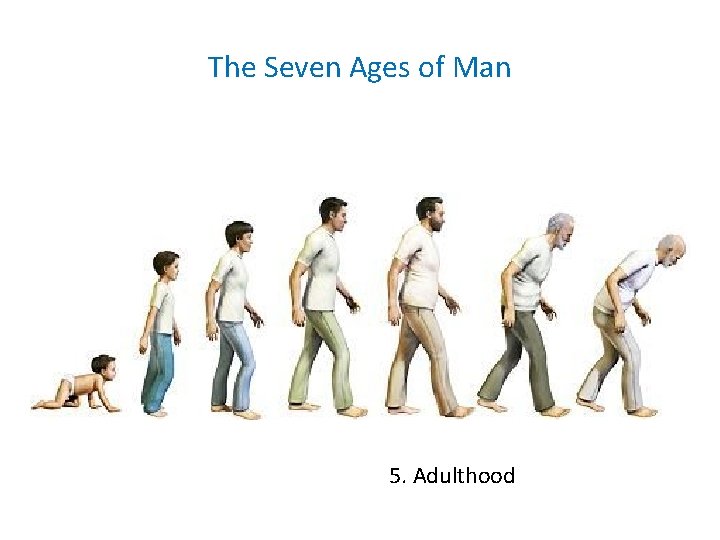
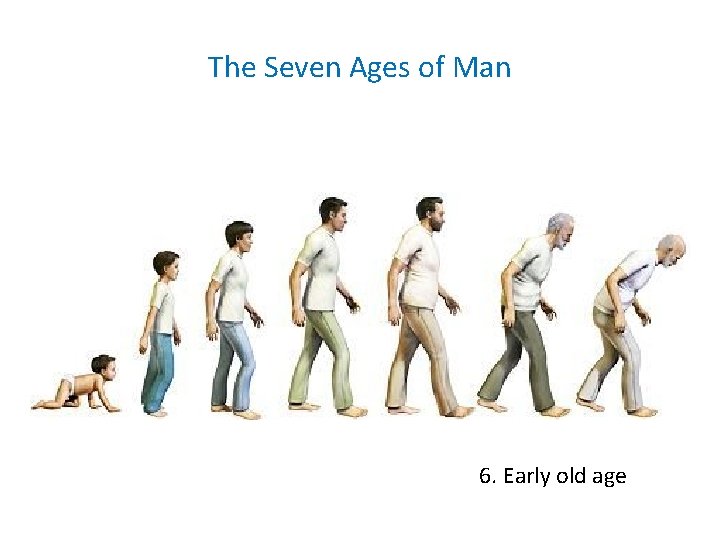
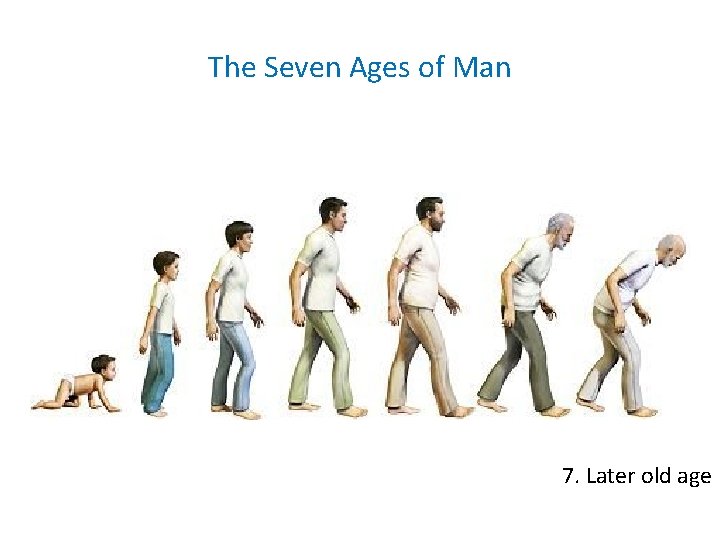
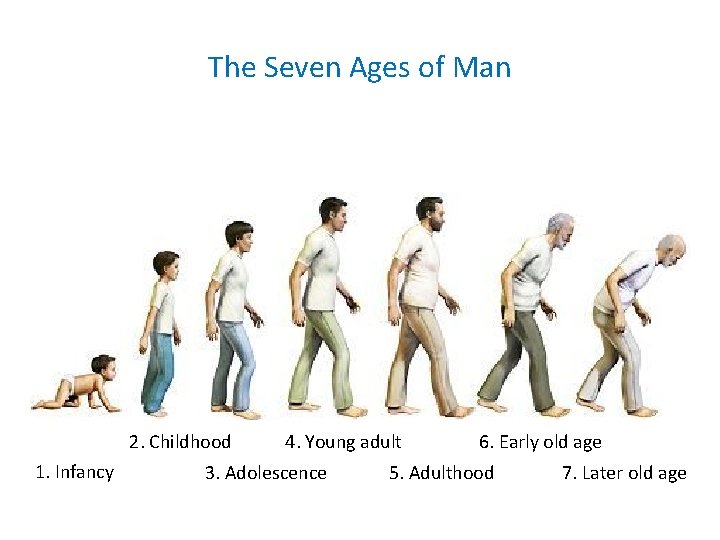
The Seven Ages of Man 1 Infancy The





- Slides: 47
The Seven Ages of Man 1. Infancy
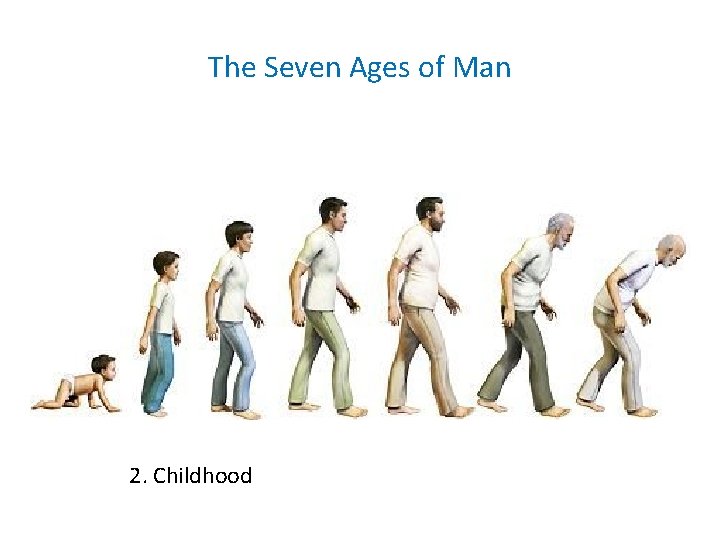
The Seven Ages of Man 2. Childhood
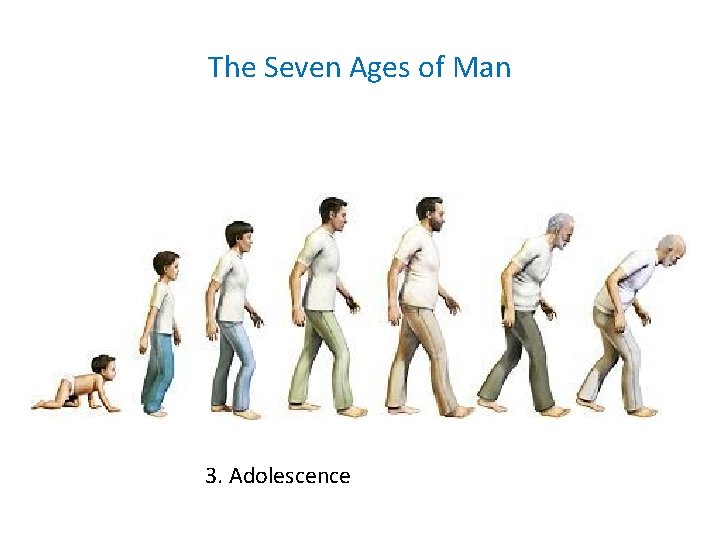
The Seven Ages of Man 3. Adolescence
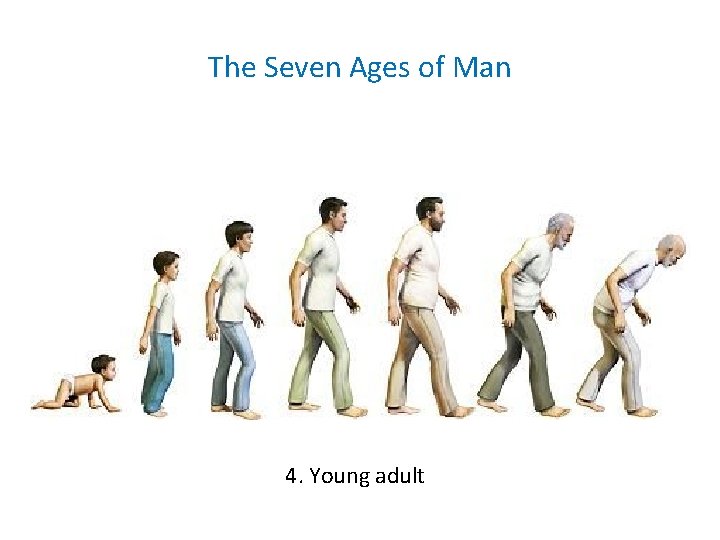
The Seven Ages of Man 4. Young adult
The Seven Ages of Man 5. Adulthood
The Seven Ages of Man 6. Early old age
The Seven Ages of Man 7. Later old age
Diabetes from Cradle to Grave Dr. Thomas Galliford Consultant Endocrinologist West Herts Hospitals NHS Trust
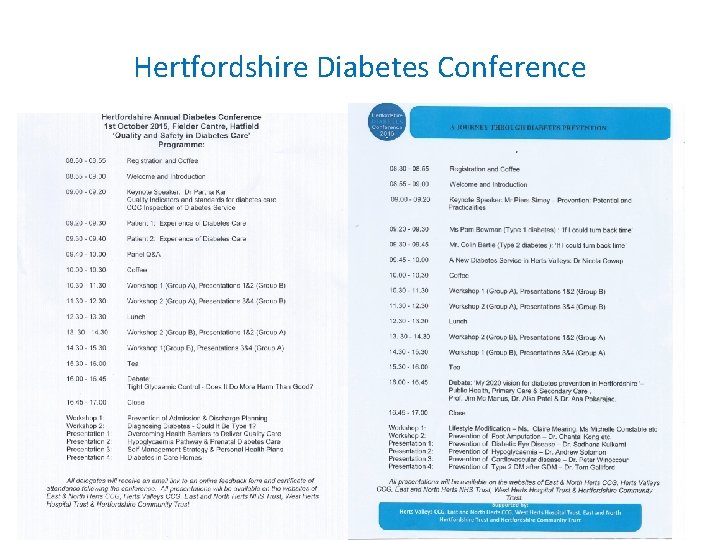
Hertfordshire Diabetes Conference
Childhood
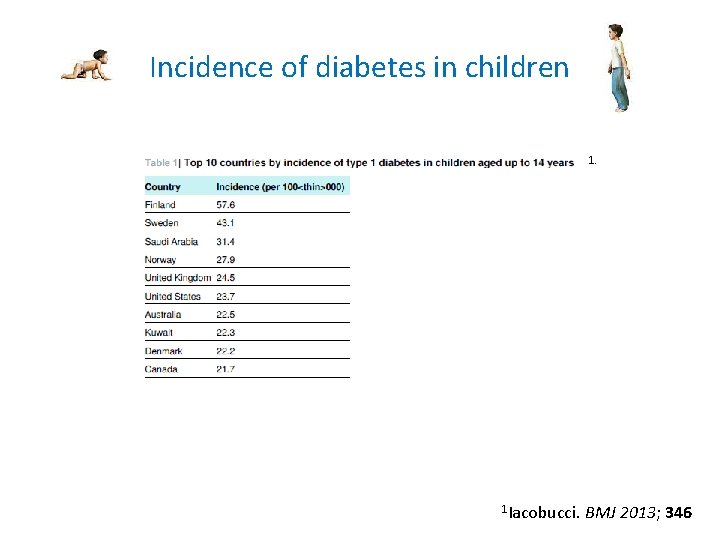
Incidence of diabetes in children 1. 1 Iacobucci. BMJ 2013; 346
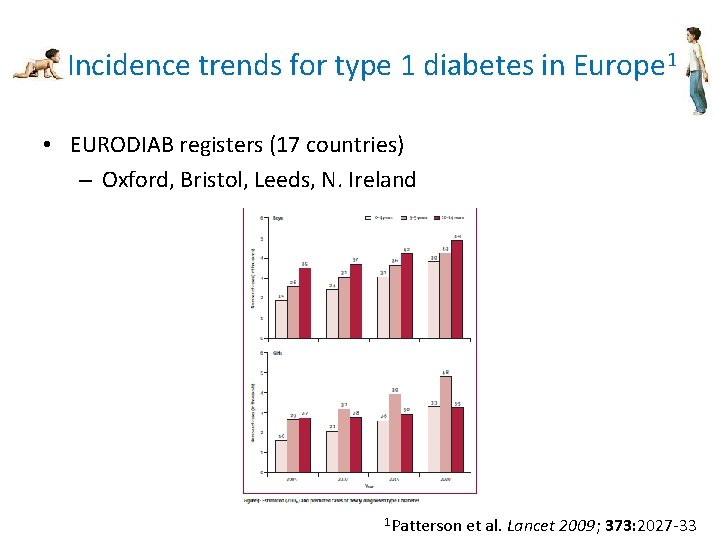
Incidence trends for type 1 diabetes in Europe 1 • EURODIAB registers (17 countries) – Oxford, Bristol, Leeds, N. Ireland 1 Patterson et al. Lancet 2009; 373: 2027 -33
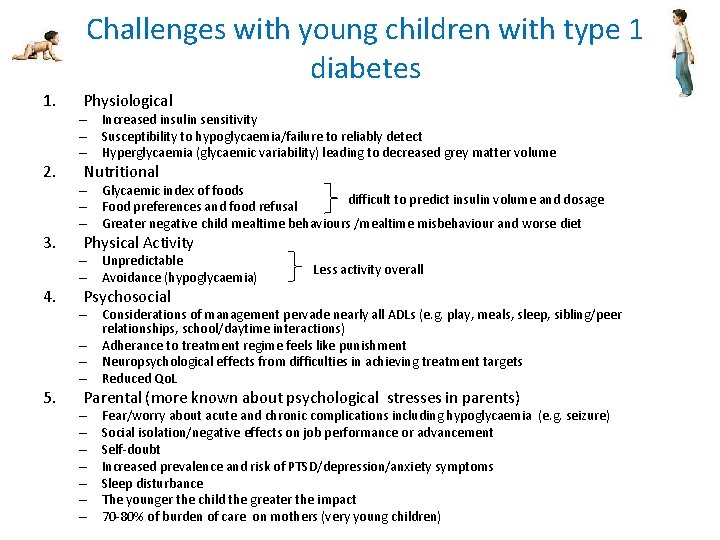
Challenges with young children with type 1 diabetes 1. 2. 3. 4. 5. Physiological – Increased insulin sensitivity – Susceptibility to hypoglycaemia/failure to reliably detect – Hyperglycaemia (glycaemic variability) leading to decreased grey matter volume Nutritional – Glycaemic index of foods difficult to predict insulin volume and dosage – Food preferences and food refusal – Greater negative child mealtime behaviours /mealtime misbehaviour and worse diet Physical Activity – Unpredictable – Avoidance (hypoglycaemia) Less activity overall Psychosocial – Considerations of management pervade nearly all ADLs (e. g. play, meals, sleep, sibling/peer relationships, school/daytime interactions) – Adherance to treatment regime feels like punishment – Neuropsychological effects from difficulties in achieving treatment targets – Reduced Qo. L Parental (more known about psychological stresses in parents) – – – – Fear/worry about acute and chronic complications including hypoglycaemia (e. g. seizure) Social isolation/negative effects on job performance or advancement Self-doubt Increased prevalence and risk of PTSD/depression/anxiety symptoms Sleep disturbance The younger the child the greater the impact 70 -80% of burden of care on mothers (very young children)
Young children with type 1 diabetes • Interventions – Limited trial data, small studies – e. g. parent mentors, phone-calls, coping skills training – Streisand et al 1: • 134 parents of children 1 -6 yrs (parent support vs. diabetes education support) • Parent support = phone sessions, online message board, group teleconferences • Interventional strategies = parental emotional functioning, support of parenting behaviours • Preliminary results: – Improvements in mealtime distress – Higher satisfaction – 0. 5% reduction in Hb. A 1 c from baseline at 1 year – More studies needed! 1 Streisand Monaghan. Curr Diab Rep. 2014, 14(9)
• Target Hb. A 1 c < 58 mmol/mol (7. 5%) • Published Aug 2015, updated Nov 2016 • Target Hb. A 1 c < 48 mmol/mol (6. 5%)
• All 173 PDUs – 24, 439 children <24 yrs • 27, 115 (96%) Type 1 diabetes – – Prevalence 195. 4/100, 000 Incidence 25. 9/100, 000 ♂>♀ Mean Hb. A 1 c 67. 8 mmol/mol (8. 35%) • 3. 2 mmol/mol improvement from 2014 -2015 • 23. 5% Hb. A 1 c < 58 mmol/mol – Complications: • • 9. 7% microalbuminuria 13. 8% retinopathy 26. 3% hypertension 30% referred to psychology or CAMHS
• 621 (2. 2%) Type 2 diabetes
• 621 (2. 2%) Type 2 diabetes – ♀: ♂ = 2: 1 – – – 78. 5% obese, 7. 3% overweight Black and asian backgrounds greater representation (52. 3%) Most children lived in deprived areas Mean Hb. A 1 c 59. 7 mmol/mol (7. 6%) Complications: • • 14. 5% microalbuminuria 5. 4% retinopathy 40% hypertension 33. 8% referred to psychology or CAMHS
Adolescence
Type 1 diabetes in adolescence • Decline in metabolic control • Rates of DKA increase • Less likely to attend OP • Increased drop out of medical system
• 1441 patients with type 1 diabetes – Intensive therapy vs. conventional treatment – Mean follow-up 6. 5 years • Results: – – – – – Hb. A 1 c 7. 4% vs. 9. 1% 76% reduction in risk for development of retinopathy 54% reduction in progression of retinopathy 47% reduction in proliferative or severe non-proliferative retinopathy 39% reduction in occurrence of microalbuminuria 54% reduction in occurrence of albuminuria 60% reduction in development of clinical neuropathy 41% reduction in major CV and PVD events 2 -3 x increase in severe hypoglycaemia NEJM 1993; 329(14): 977 -85
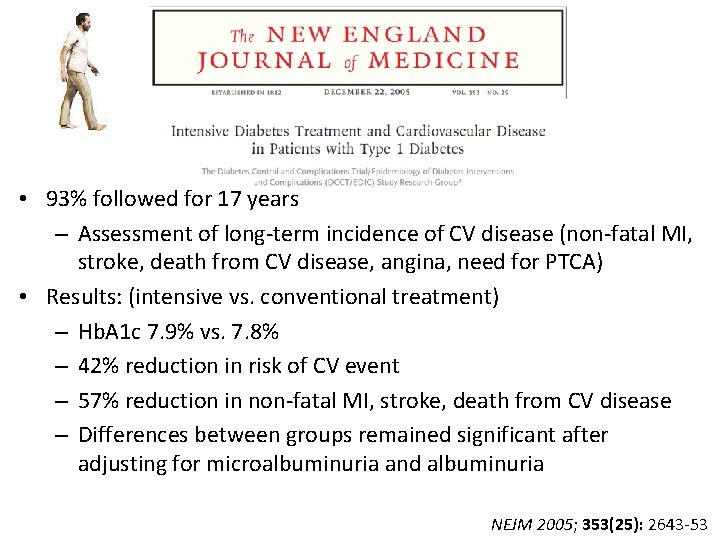
• 93% followed for 17 years – Assessment of long-term incidence of CV disease (non-fatal MI, stroke, death from CV disease, angina, need for PTCA) • Results: (intensive vs. conventional treatment) – Hb. A 1 c 7. 9% vs. 7. 8% – 42% reduction in risk of CV event – 57% reduction in non-fatal MI, stroke, death from CV disease – Differences between groups remained significant after adjusting for microalbuminuria and albuminuria NEJM 2005; 353(25): 2643 -53
DCCT in adolescents • DCCT cohort differences adolescant vs. adult 1 – 195 young subjects (13 – 17 yrs) – At enrollment Hb. A 1 c INT 9. 6% vs. 9. 0%, CON 9. 5% vs. 8. 9% – At completion Hb. A 1 c INT 8. 1% vs. 7. 2%, CON 9. 7% vs. 8. 9% • Risk reduction of having DR 53% (p = 0. 048) • Risk reduction of progression of DR 70% (p = 0. 042) • DCCT/EDIC – 156 adolescents 2 • No difference in retinopathy progression 10 yrs after the end of DCCT • Significantly higher risk of retinopathy progression INT adolescants vs. INT adults – adjusted hazard ratio 1. 7 1 DCCT Research Group. J Pediatr. 1994, 125(2): 177 -88 2 White et al. Diabetes 2010, 59: 1244 -1253
Adulthood
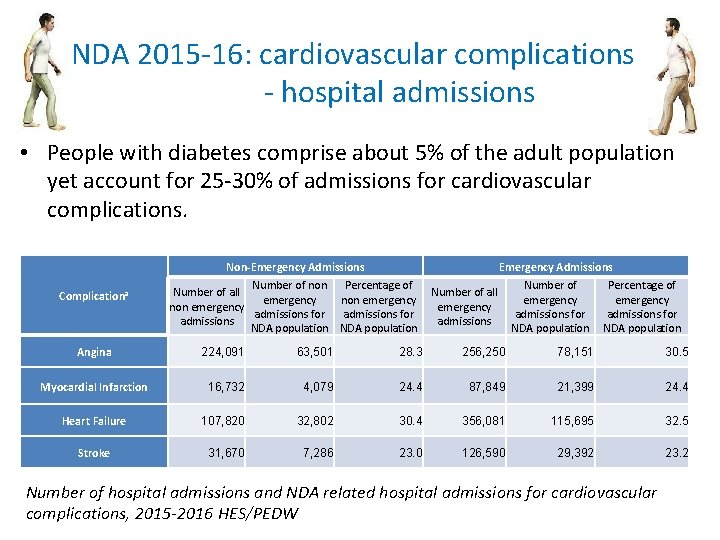
NDA 2015 -16: cardiovascular complications - hospital admissions • People with diabetes comprise about 5% of the adult population yet account for 25 -30% of admissions for cardiovascular complications. Non-Emergency Admissions Complication a Emergency Admissions Number of non Percentage of Number of all emergency non emergency admissions for admissions NDA population Number of all emergency admissions Number of emergency admissions for NDA population Percentage of emergency admissions for NDA population Angina 224, 091 63, 501 28. 3 256, 250 78, 151 30. 5 Myocardial Infarction 16, 732 4, 079 24. 4 87, 849 21, 399 24. 4 Heart Failure 107, 820 32, 802 30. 4 356, 081 115, 695 32. 5 Stroke 31, 670 7, 286 23. 0 126, 590 29, 392 23. 2 Number of hospital admissions and NDA related hospital admissions for cardiovascular complications, 2015 -2016 HES/PEDW
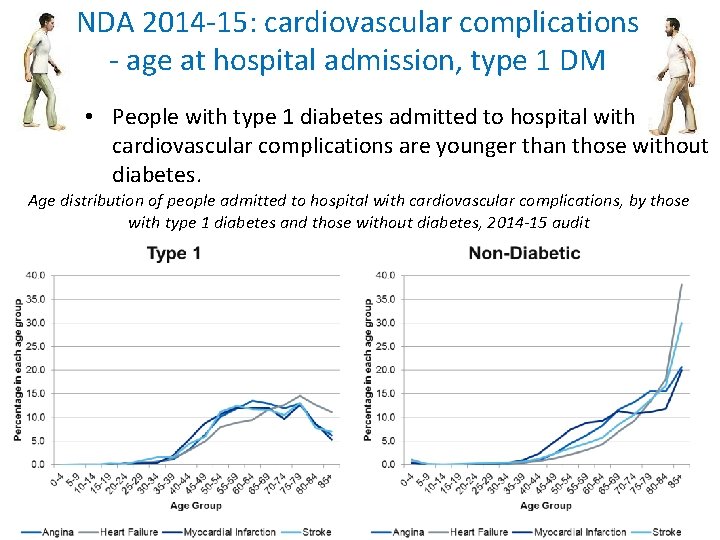
NDA 2014 -15: cardiovascular complications - age at hospital admission, type 1 DM • People with type 1 diabetes admitted to hospital with cardiovascular complications are younger than those without diabetes. Age distribution of people admitted to hospital with cardiovascular complications, by those with type 1 diabetes and those without diabetes, 2014 -15 audit
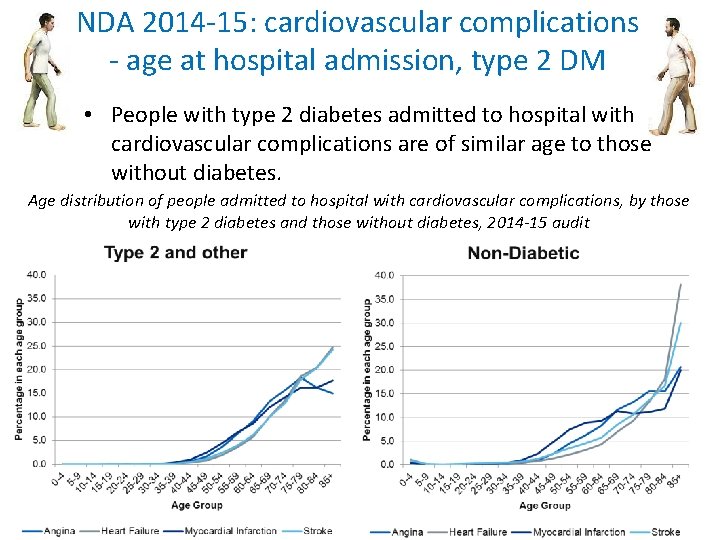
NDA 2014 -15: cardiovascular complications - age at hospital admission, type 2 DM • People with type 2 diabetes admitted to hospital with cardiovascular complications are of similar age to those without diabetes. Age distribution of people admitted to hospital with cardiovascular complications, by those with type 2 diabetes and those without diabetes, 2014 -15 audit
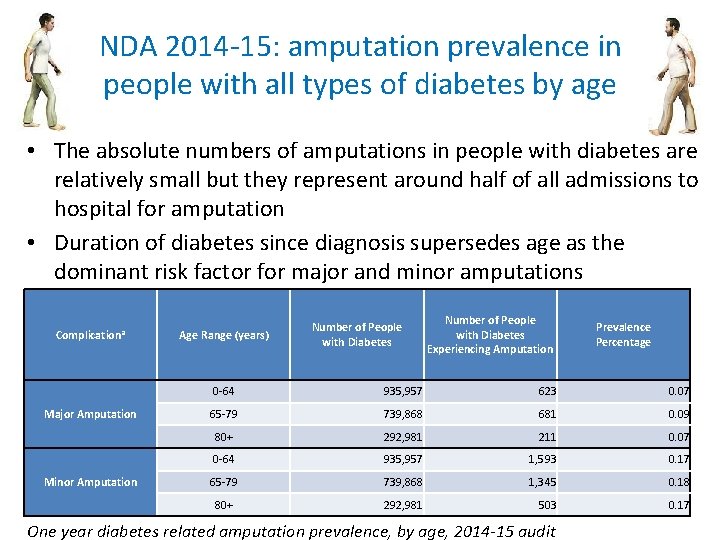
NDA 2014 -15: amputation prevalence in people with all types of diabetes by age • The absolute numbers of amputations in people with diabetes are relatively small but they represent around half of all admissions to hospital for amputation • Duration of diabetes since diagnosis supersedes age as the dominant risk factor for major and minor amputations Complication a Major Amputation Minor Amputation Age Range (years) Number of People with Diabetes Experiencing Amputation Prevalence Percentage 0 -64 935, 957 623 0. 07 65 -79 739, 868 681 0. 09 80+ 292, 981 211 0. 07 0 -64 935, 957 1, 593 0. 17 65 -79 739, 868 1, 345 0. 18 80+ 292, 981 503 0. 17 One year diabetes related amputation prevalence, by age, 2014 -15 audit
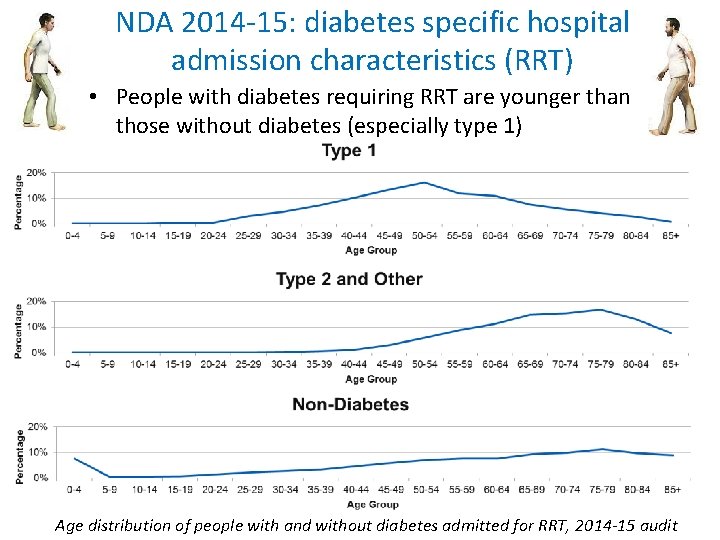
NDA 2014 -15: diabetes specific hospital admission characteristics (RRT) • People with diabetes requiring RRT are younger than those without diabetes (especially type 1) Age distribution of people with and without diabetes admitted for RRT, 2014 -15 audit
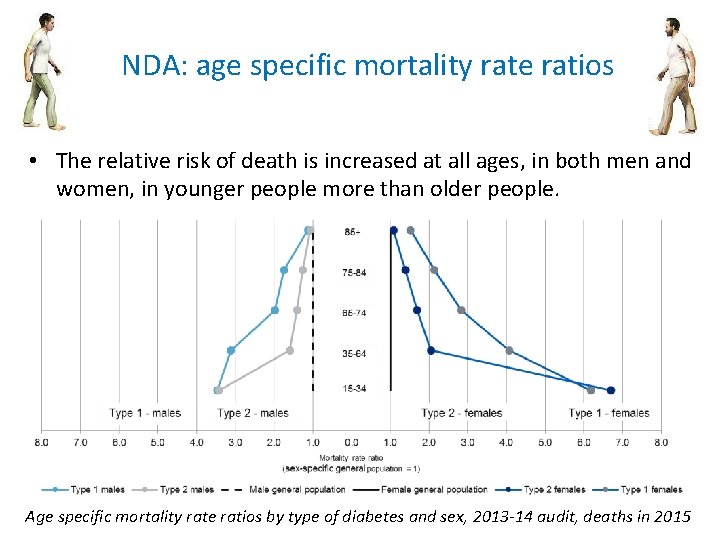
NDA: age specific mortality rate ratios • The relative risk of death is increased at all ages, in both men and women, in younger people more than older people. Age specific mortality rate ratios by type of diabetes and sex, 2013 -14 audit, deaths in 2015
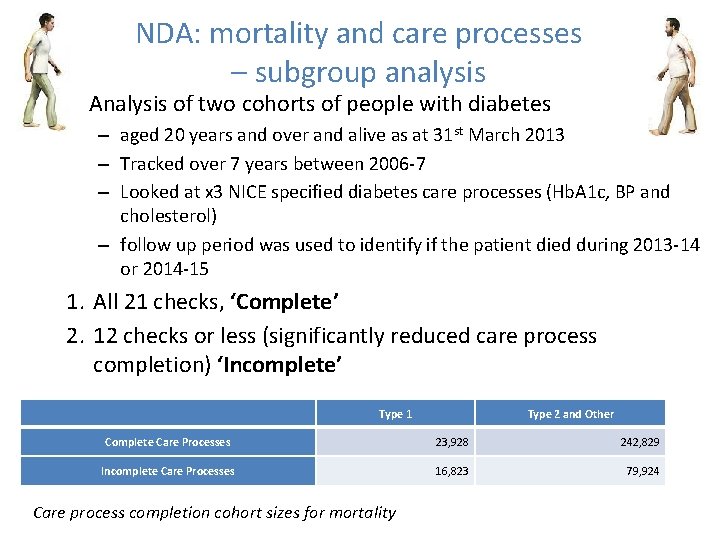
NDA: mortality and care processes – subgroup analysis • Analysis of two cohorts of people with diabetes – aged 20 years and over and alive as at 31 st March 2013 – Tracked over 7 years between 2006 -7 – Looked at x 3 NICE specified diabetes care processes (Hb. A 1 c, BP and cholesterol) – follow up period was used to identify if the patient died during 2013 -14 or 2014 -15 1. All 21 checks, ‘Complete’ 2. 12 checks or less (significantly reduced care process completion) ‘Incomplete’ Type 1 Type 2 and Other Complete Care Processes 23, 928 242, 829 Incomplete Care Processes 16, 823 79, 924 Care process completion cohort sizes for mortality
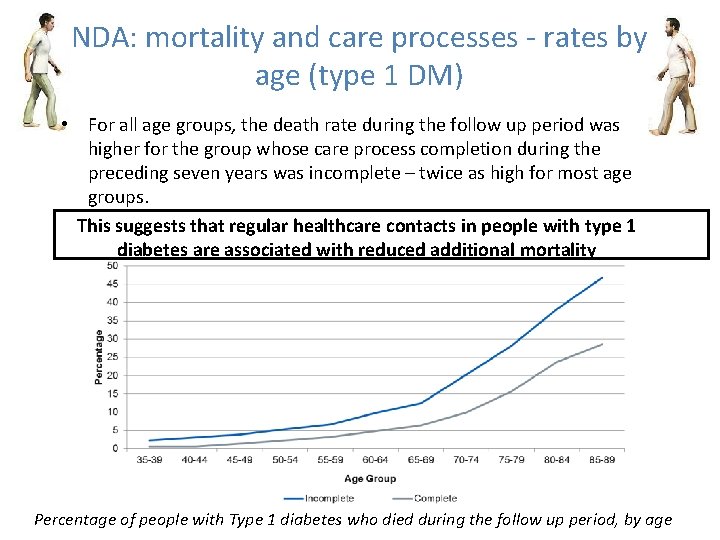
NDA: mortality and care processes - rates by age (type 1 DM) • For all age groups, the death rate during the follow up period was higher for the group whose care process completion during the preceding seven years was incomplete – twice as high for most age groups. This suggests that regular healthcare contacts in people with type 1 diabetes are associated with reduced additional mortality Percentage of people with Type 1 diabetes who died during the follow up period, by age
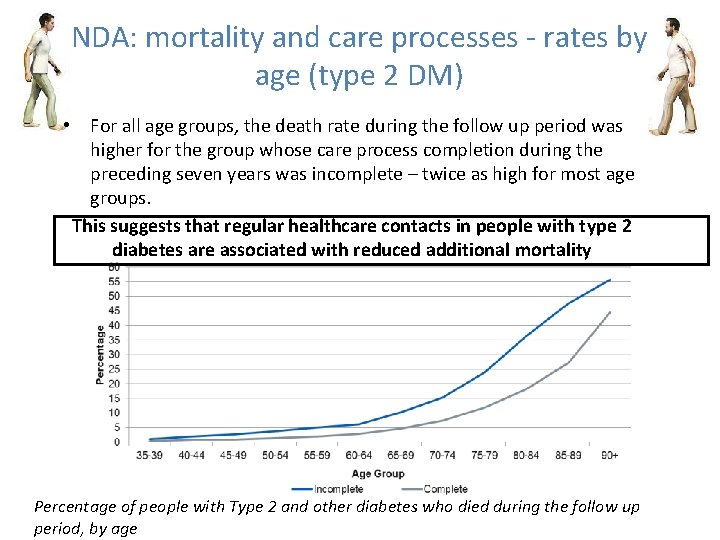
NDA: mortality and care processes - rates by age (type 2 DM) • For all age groups, the death rate during the follow up period was higher for the group whose care process completion during the preceding seven years was incomplete – twice as high for most age groups. This suggests that regular healthcare contacts in people with type 2 diabetes are associated with reduced additional mortality Percentage of people with Type 2 and other diabetes who died during the follow up period, by age
Old Age
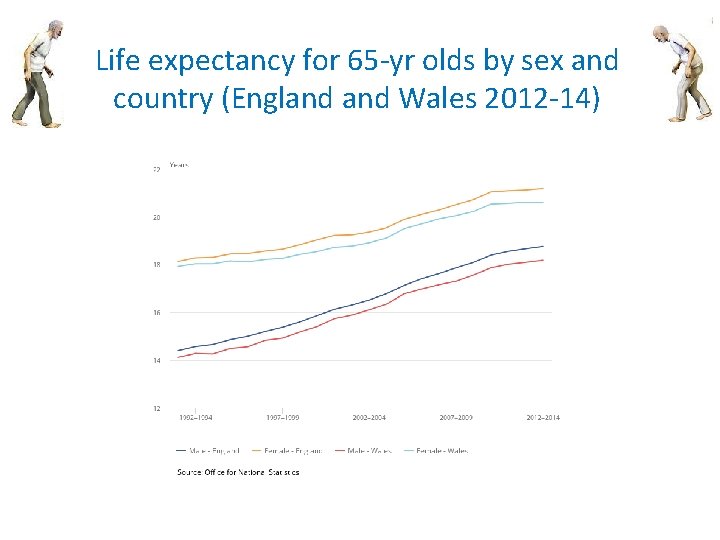
Life expectancy for 65 -yr olds by sex and country (England Wales 2012 -14)
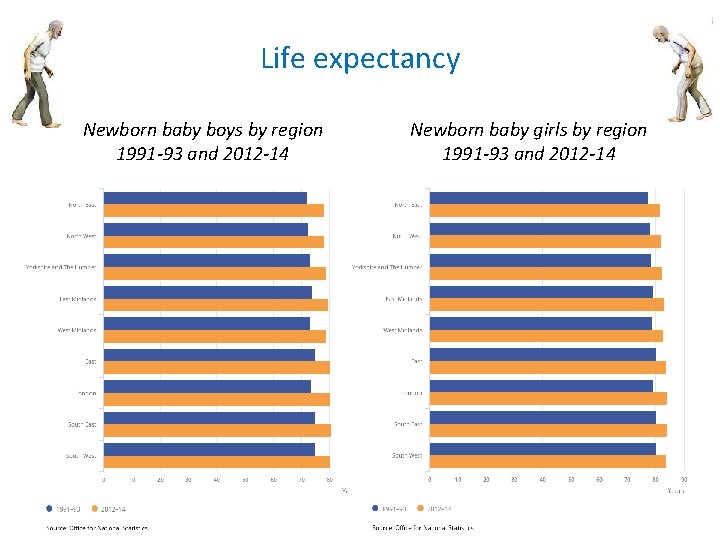
Life expectancy Newborn baby boys by region 1991 -93 and 2012 -14 Newborn baby girls by region 1991 -93 and 2012 -14
Clinical guidelines for diabetes in older age • Individualized care, considering the factors of age, life expectancy and co-morbidity when considering glycaemic targets – Little qualifying detail • European Diabetes Working Group → Hb. A 1 c target 53 -58 mmol/mol (7 -7. 5%) in fit older people; 59 -69 mmol/mol (7. 5 -8. 5%) for the frail • ? 69 mmol/mol may be risky?
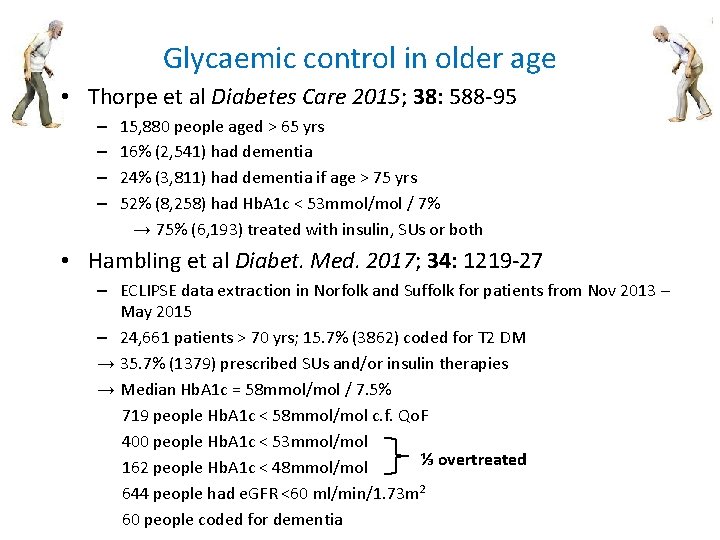
Glycaemic control in older age • Thorpe et al Diabetes Care 2015; 38: 588 -95 – – 15, 880 people aged > 65 yrs 16% (2, 541) had dementia 24% (3, 811) had dementia if age > 75 yrs 52% (8, 258) had Hb. A 1 c < 53 mmol/mol / 7% → 75% (6, 193) treated with insulin, SUs or both • Hambling et al Diabet. Med. 2017; 34: 1219 -27 – ECLIPSE data extraction in Norfolk and Suffolk for patients from Nov 2013 – May 2015 – 24, 661 patients > 70 yrs; 15. 7% (3862) coded for T 2 DM → 35. 7% (1379) prescribed SUs and/or insulin therapies → Median Hb. A 1 c = 58 mmol/mol / 7. 5% 719 people Hb. A 1 c < 58 mmol/mol c. f. Qo. F 400 people Hb. A 1 c < 53 mmol/mol ⅓ overtreated 162 people Hb. A 1 c < 48 mmol/mol 644 people had e. GFR <60 ml/min/1. 73 m 2 60 people coded for dementia
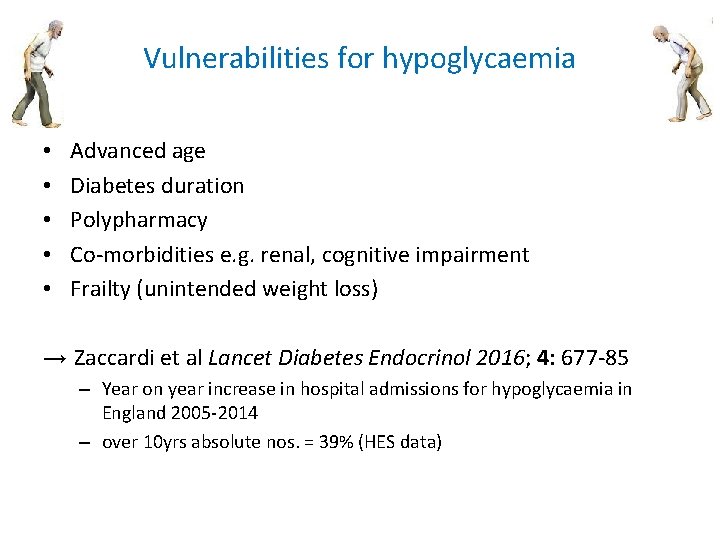
Vulnerabilities for hypoglycaemia • • • Advanced age Diabetes duration Polypharmacy Co-morbidities e. g. renal, cognitive impairment Frailty (unintended weight loss) → Zaccardi et al Lancet Diabetes Endocrinol 2016; 4: 677 -85 – Year on year increase in hospital admissions for hypoglycaemia in England 2005 -2014 – over 10 yrs absolute nos. = 39% (HES data)
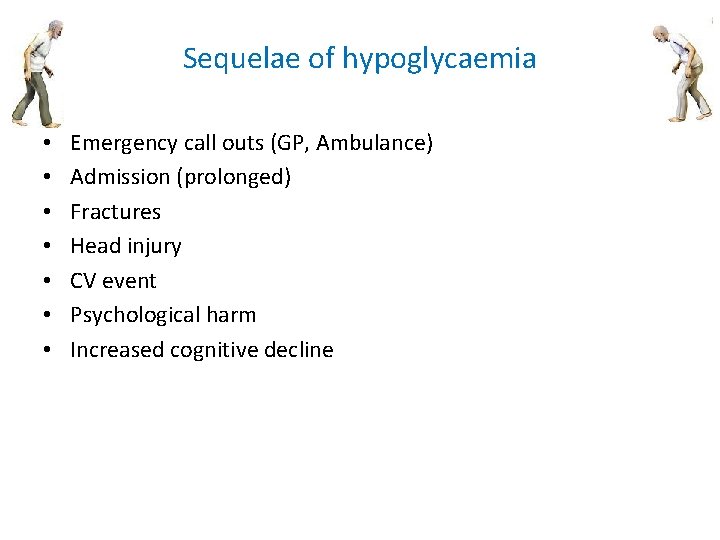
Sequelae of hypoglycaemia • • Emergency call outs (GP, Ambulance) Admission (prolonged) Fractures Head injury CV event Psychological harm Increased cognitive decline
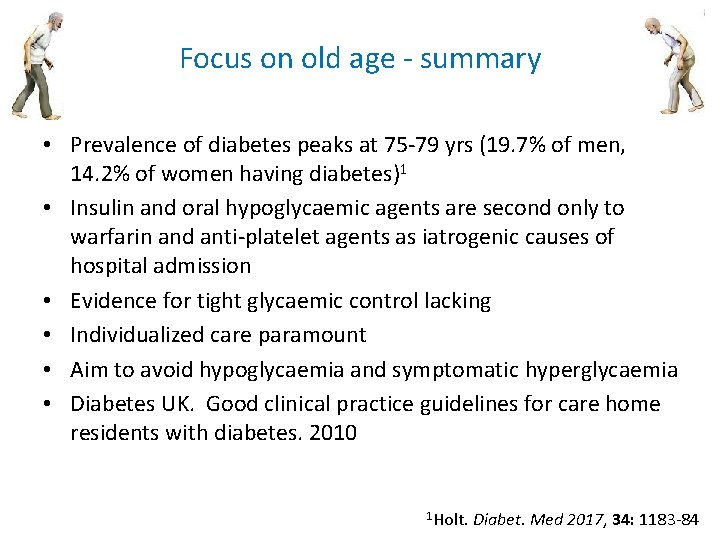
Focus on old age - summary • Prevalence of diabetes peaks at 75 -79 yrs (19. 7% of men, 14. 2% of women having diabetes)1 • Insulin and oral hypoglycaemic agents are second only to warfarin and anti-platelet agents as iatrogenic causes of hospital admission • Evidence for tight glycaemic control lacking • Individualized care paramount • Aim to avoid hypoglycaemia and symptomatic hyperglycaemia • Diabetes UK. Good clinical practice guidelines for care home residents with diabetes. 2010 1 Holt. Diabet. Med 2017, 34: 1183 -84
The Seven Ages of Man 2. Childhood 1. Infancy 4. Young adult 3. Adolescence 6. Early old age 5. Adulthood 7. Later old age
Sir David Brailsford "The whole principle came from the idea that if you broke down everything you could think of that goes into riding a bike, and then improved it by 1%, you will get a significant increase when you put them all together. ”
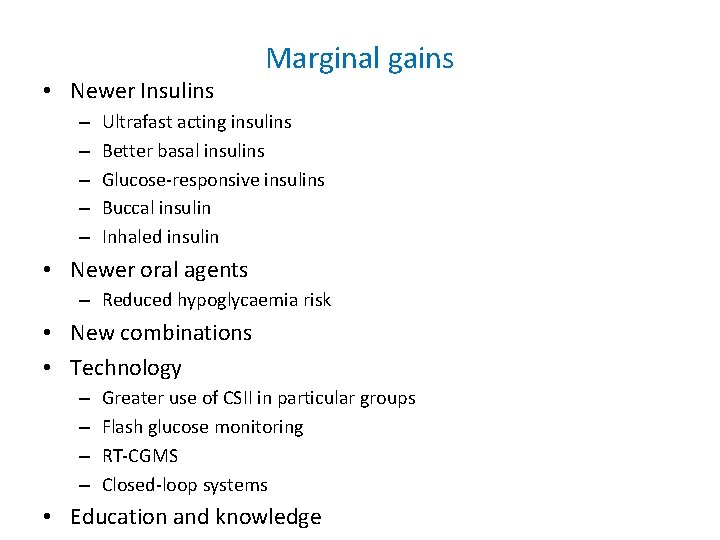
• Newer Insulins – – – Marginal gains Ultrafast acting insulins Better basal insulins Glucose-responsive insulins Buccal insulin Inhaled insulin • Newer oral agents – Reduced hypoglycaemia risk • New combinations • Technology – – Greater use of CSII in particular groups Flash glucose monitoring RT-CGMS Closed-loop systems • Education and knowledge