
The Scientific Method What is it Who uses
- Slides: 34
The Scientific Method What is it? Who uses it? Why should I care?
Everyone uses it everyday! • Yes! Even you!
It is a way to solve problems! BIG or small
Any of these sound familiar? Where are my shoes? What class do I have next? How do I solve that math problem? Which deodorant works the best? Which pain reliever works the best? What is the cure for cancer?
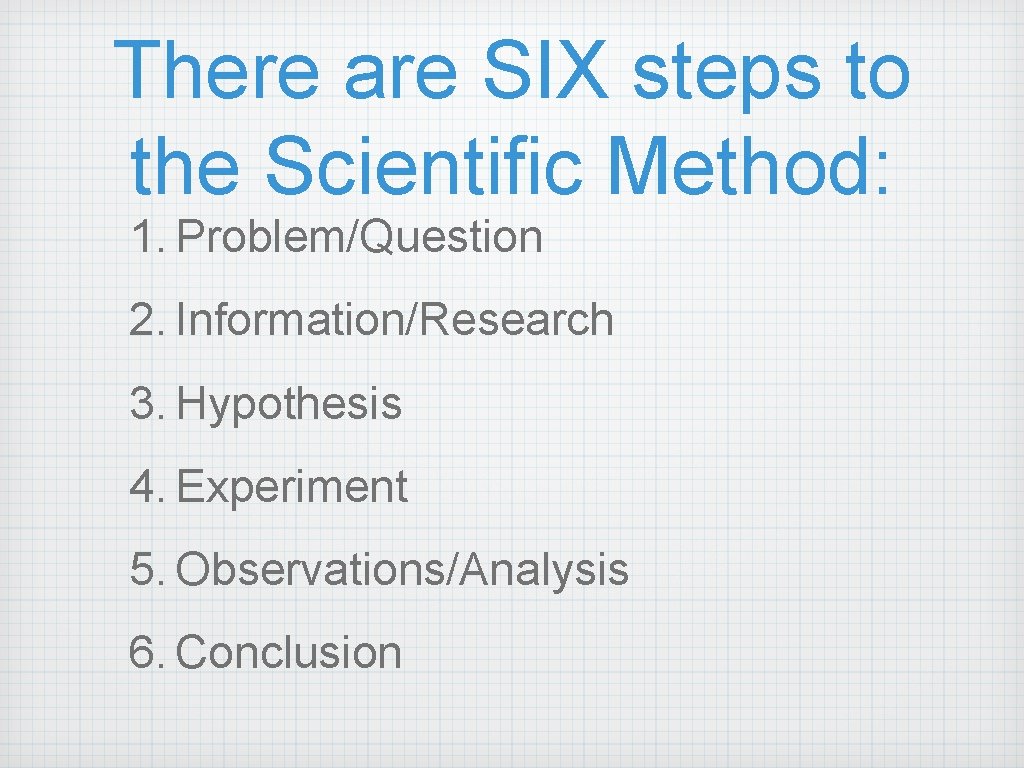
There are SIX steps to the Scientific Method: 1. Problem/Question 2. Information/Research 3. Hypothesis 4. Experiment 5. Observations/Analysis 6. Conclusion
By following these steps in order, you will learn about your problem. Notice the IN ORDER part. It is very important!
1. Problem/Question This is the problem you are trying to solve or the question you are trying to answer. Try to narrow it down and be specific.
2. Information/Research Has someone tackled this problem before? If not, gather information about your question/problem: books magazines experts past experiences
2. Information/Research Valid Internet sites Check date when site was last updated Who put the page together? Who is responsible for the information?
3. Hypothesis The hypothesis is an educated guess about the relationship between the independent and dependent variables. This is what you think the answer is based upon the information you gathered It should be in form “If (independent), then (dependent).
3. Hypothesis Independent Variable The independent, or manipulated, variable is a factor that is intentionally varied by the experimenter. Dependent Variable The dependent, or responding, variable is the factor that may change as a result of the changes made to the independent variable. This is the expected outcome!
4. Experiment The actual experiment is broken into two parts: 1. Materials A list of equipment that you will need for the experiment. 2. Procedure A list of instructions that you need to follow for the experiment. (Should be detailed!)
4. Experiment Control Group In a scientific experiment, the control is the group that serves as the standard of comparison. The control group may be a “no treatment” or an “experimenter selected” group. The control group is exposed to the same conditions as the experimental group except for the variable being tested.
4. Experiment Constants The constants in an experiment are all of the factors that the experimenter attempts to keep the same. Trials refer to the replicate groups that are exposed to the same conditions in an experiment. You should do a minimum of 3 trials.
5. Observations/Analysis Observations Collection of information and data from the experiment. It may be in the form of charts, graphs, or written work. This is WHAT HAPPENED!
5. Observations/Analysis This is an explanation of your observations. It may involve analyzing your graphs or charts in order to look for patterns to help you answer your question. It can even mean putting your measurements into a mathematical equation to get an answer.
6. Conclusion What did you find the answer to your was? It should state whether you accept or reject your hypothesis. This does not necessarily mean you “proved” something--just that your analysis supports your hypothesis. It is OK if it turns out your hypothesis is not correct. You learned!!!!!! It may lead to another experiment.
Report Your Findings! Something that is very important but not officially part of the scientific method is to report to others your findings. You will help others learn!
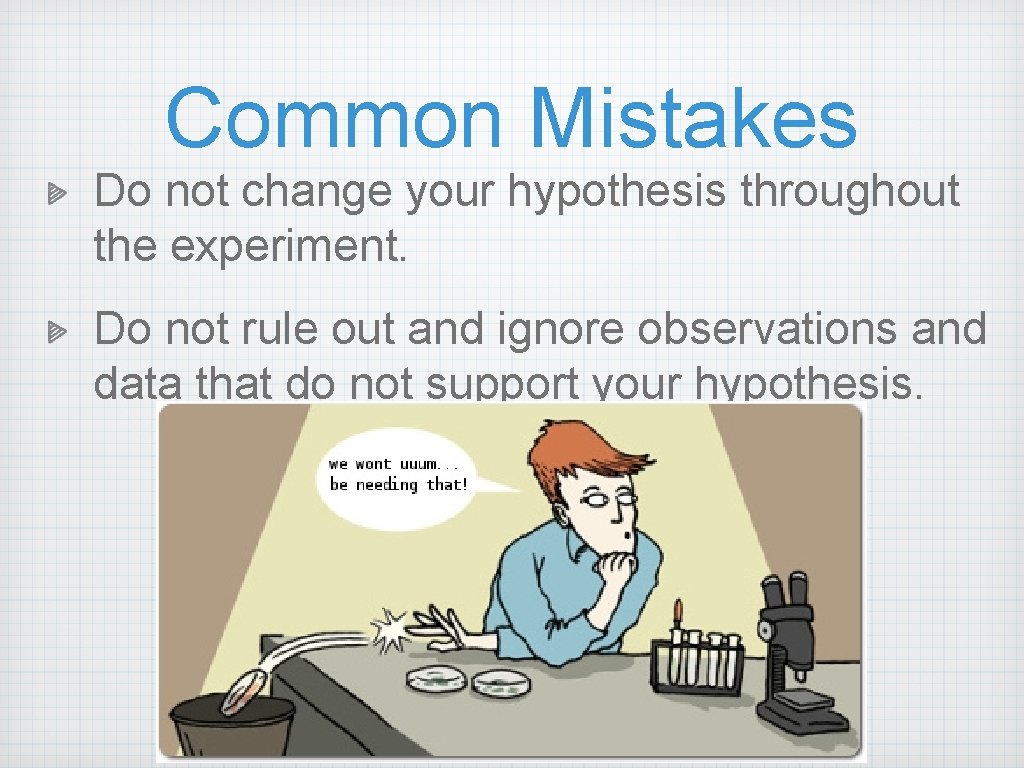
Common Mistakes Do not change your hypothesis throughout the experiment. Do not rule out and ignore observations and data that do not support your hypothesis.
Let’s put our knowledge of the Scientific Method to a realistic example that includes some of the terms you’ll be needing to used and understand.
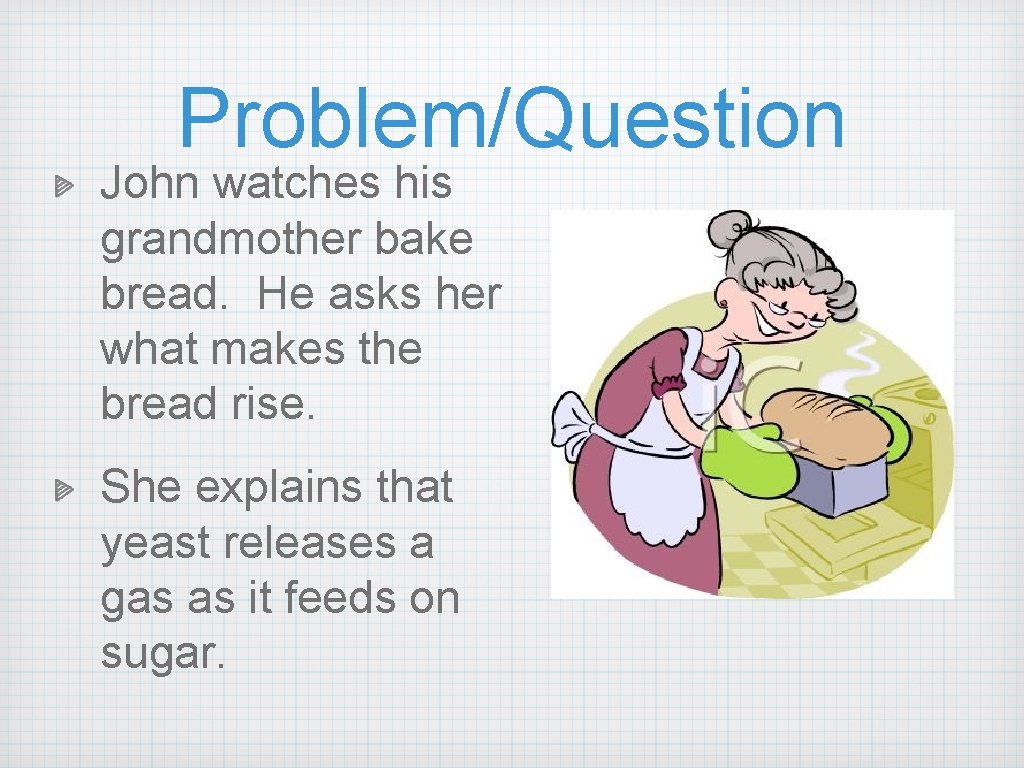
Problem/Question John watches his grandmother bake bread. He asks her what makes the bread rise. She explains that yeast releases a gas as it feeds on sugar.
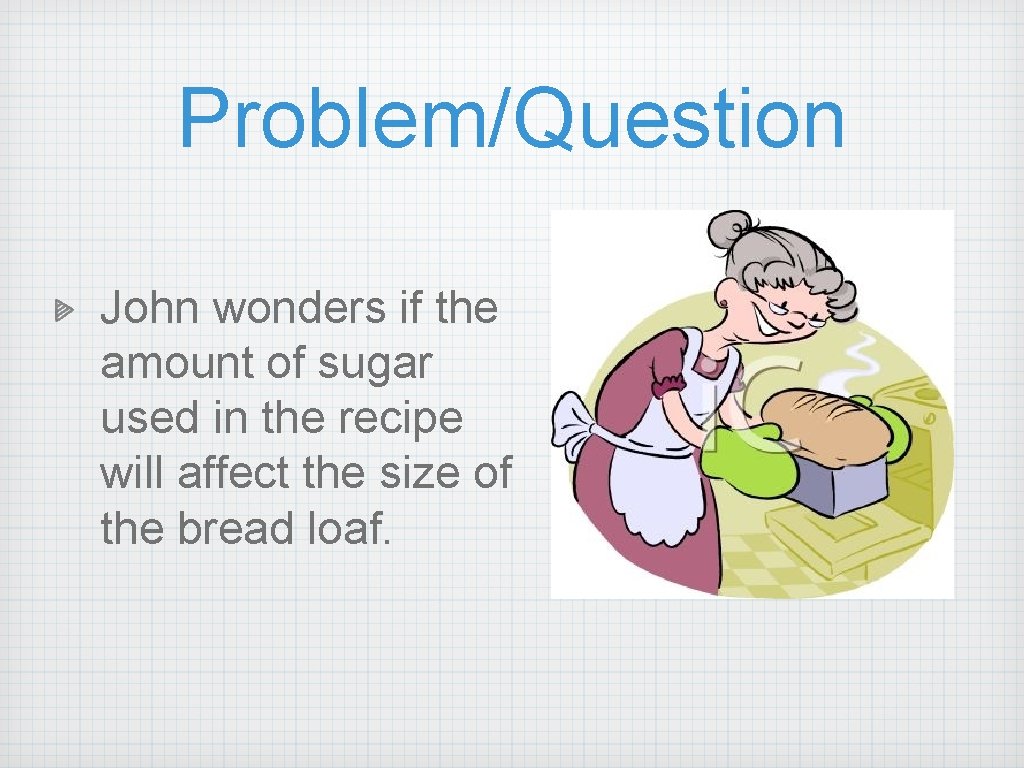
Problem/Question John wonders if the amount of sugar used in the recipe will affect the size of the bread loaf.
Information/Research John researches the areas of baking and fermentation and tries to come up with a way to test his question.
Hypothesis After talking with his teacher and conducting further research, John comes up with a hypothesis: If more sure is added, then the bread will rise higher.
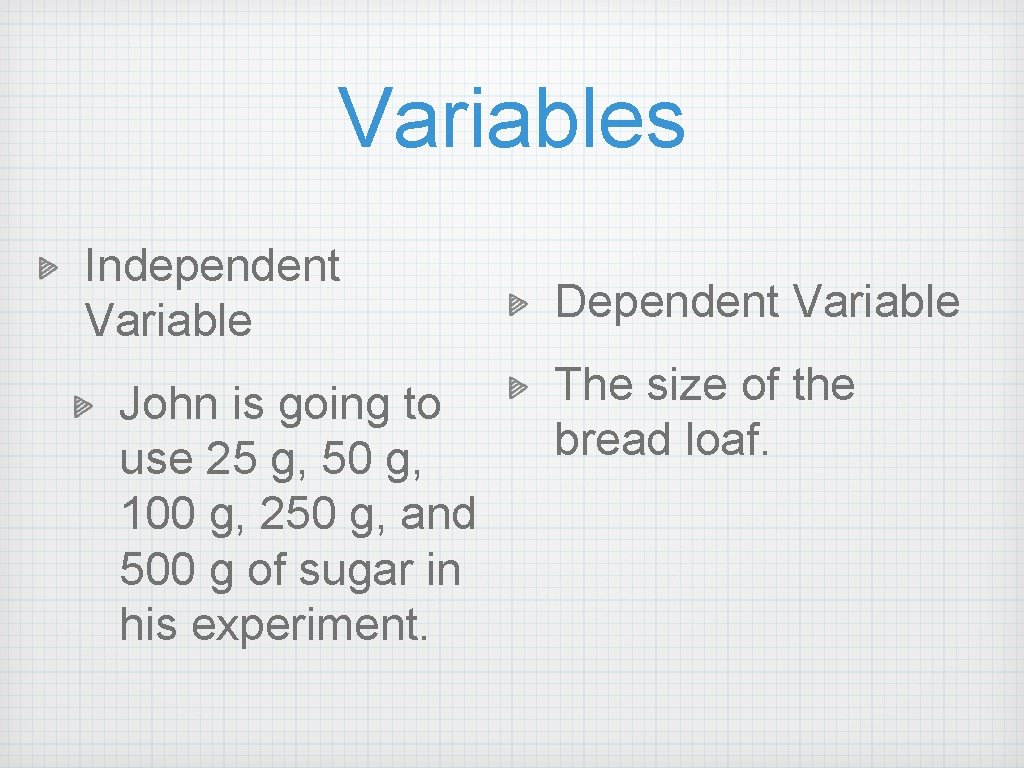
Variables Independent Variable John is going to use 25 g, 50 g, 100 g, 250 g, and 500 g of sugar in his experiment. Dependent Variable The size of the bread loaf.
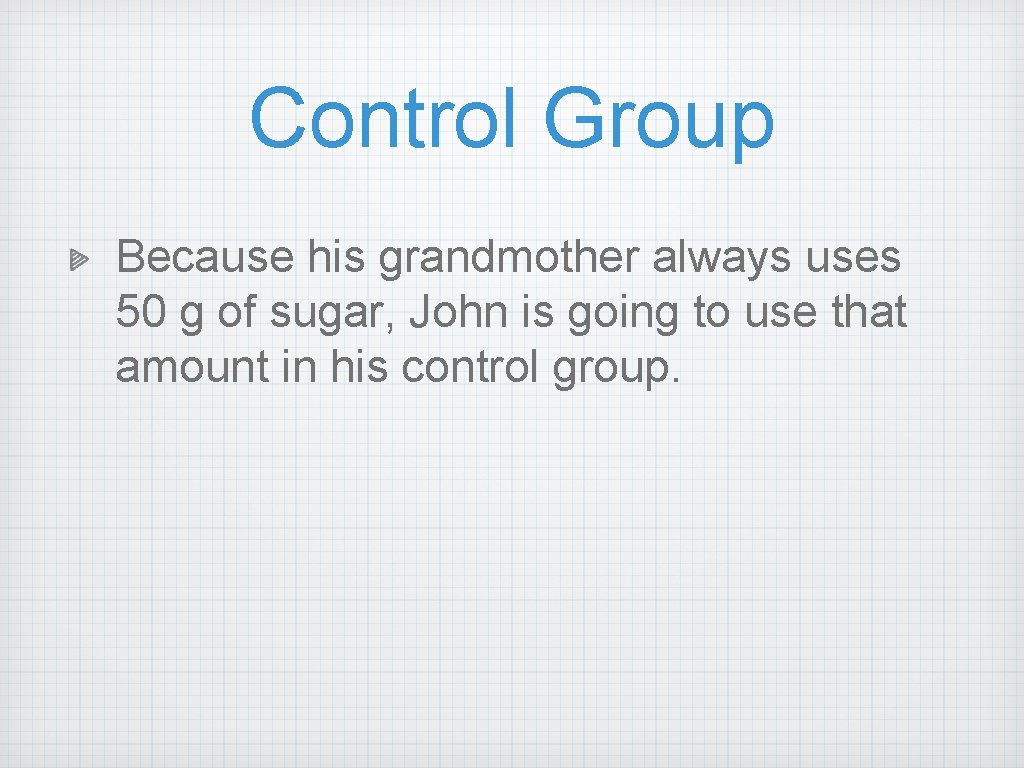
Control Group Because his grandmother always uses 50 g of sugar, John is going to use that amount in his control group.
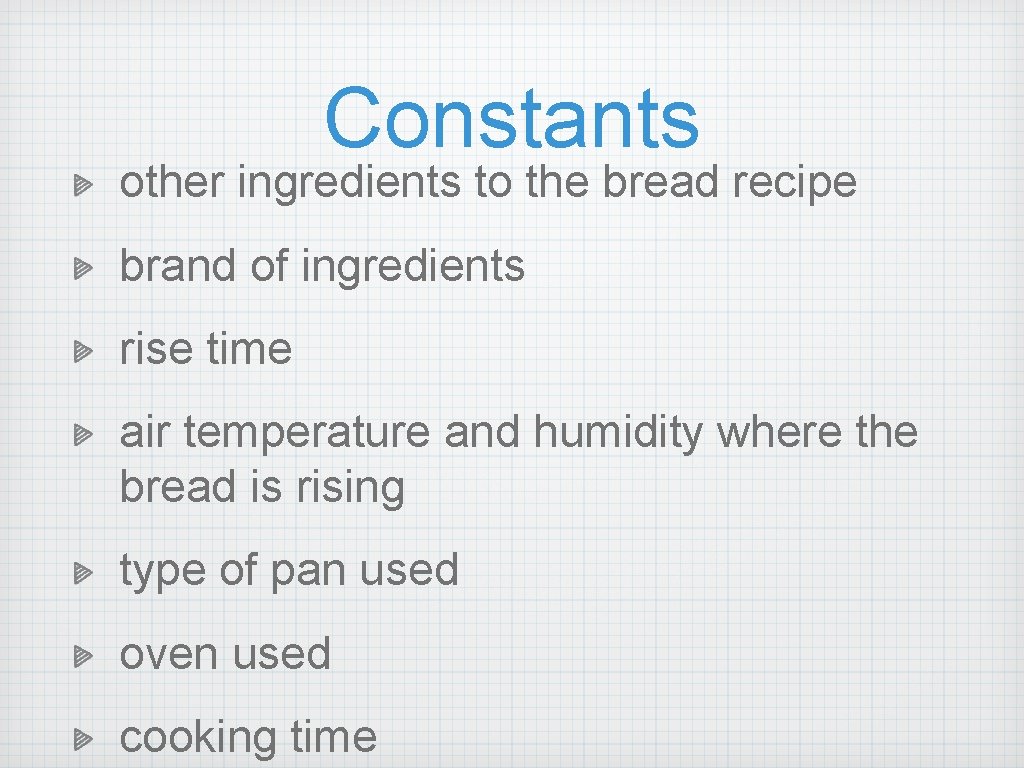
Constants other ingredients to the bread recipe brand of ingredients rise time air temperature and humidity where the bread is rising type of pan used oven used cooking time
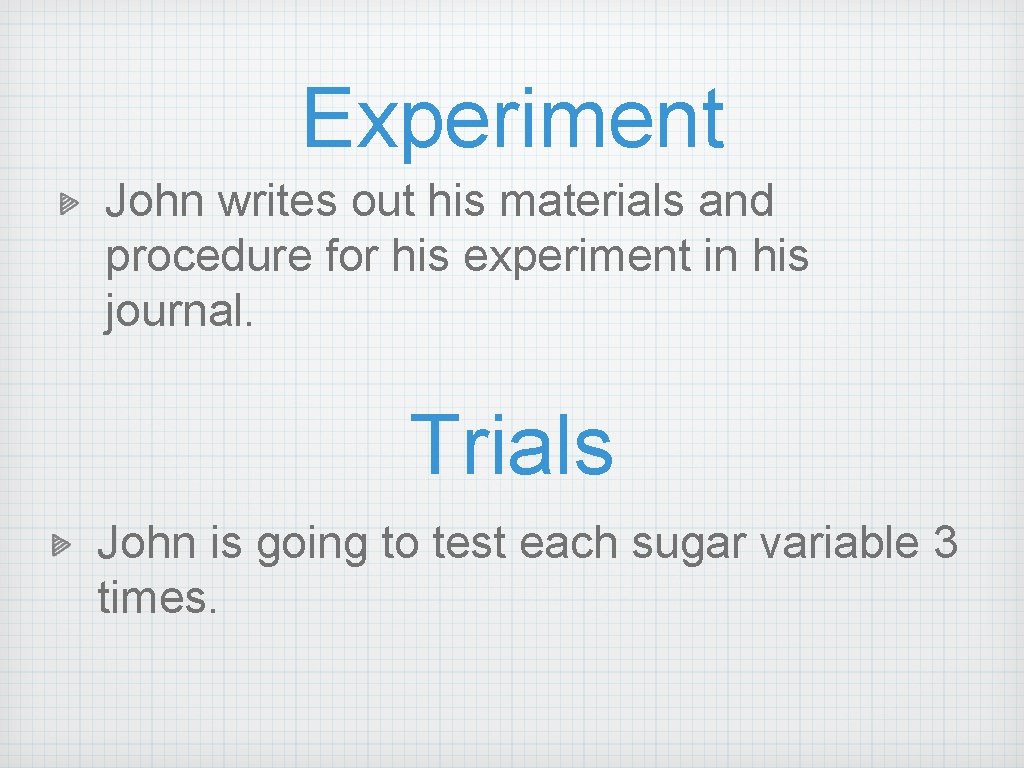
Experiment John writes out his materials and procedure for his experiment in his journal. Trials John is going to test each sugar variable 3 times.
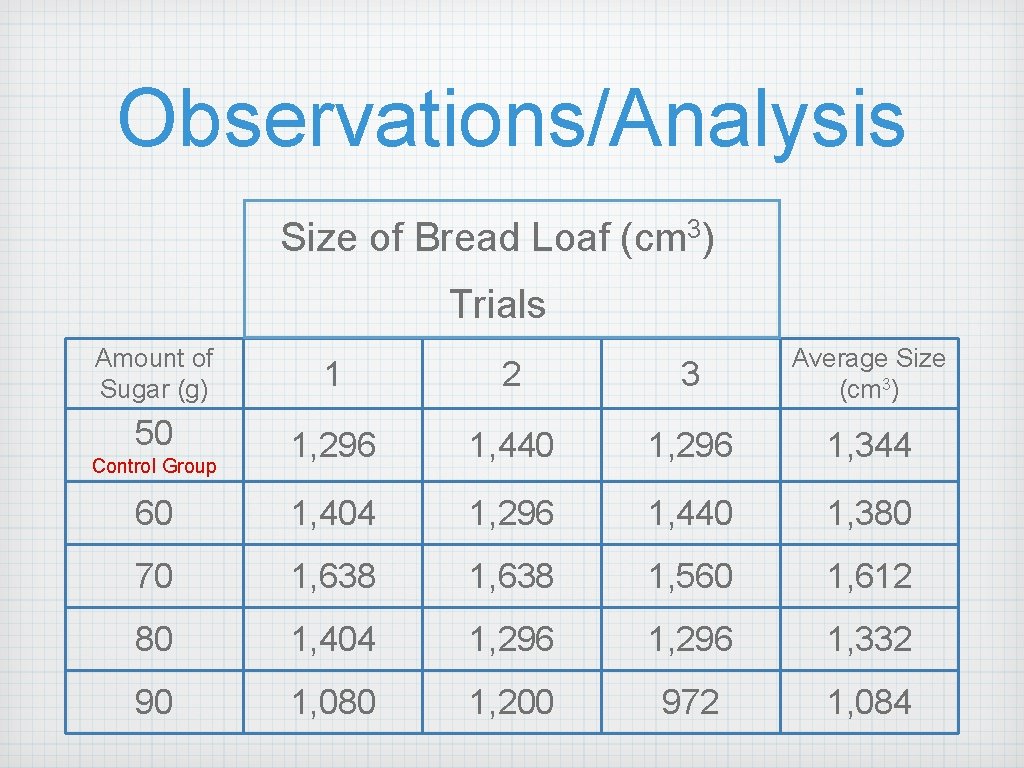
Observations/Analysis John comes up with a table so that he can record his data. John gets all of his materials together and carries out his experiment.
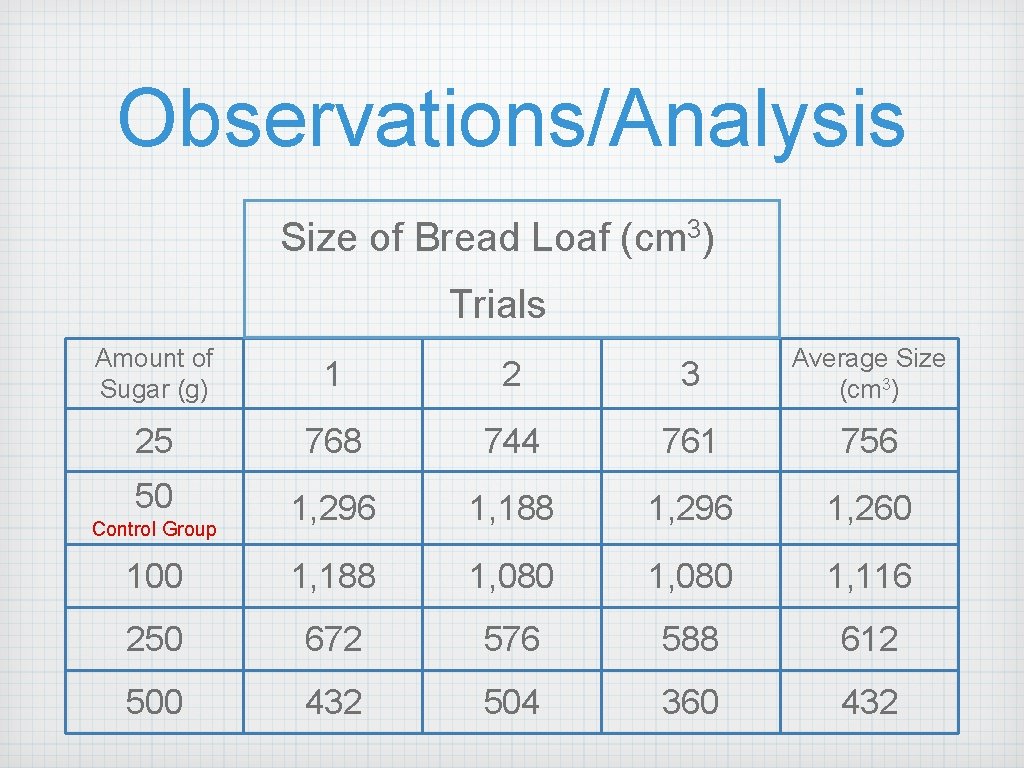
Observations/Analysis Size of Bread Loaf (cm 3) Trials Amount of Sugar (g) 1 2 3 Average Size (cm 3) 25 768 744 761 756 50 1, 296 1, 188 1, 296 1, 260 100 1, 188 1, 080 1, 116 250 672 576 588 612 500 432 504 360 432 Control Group
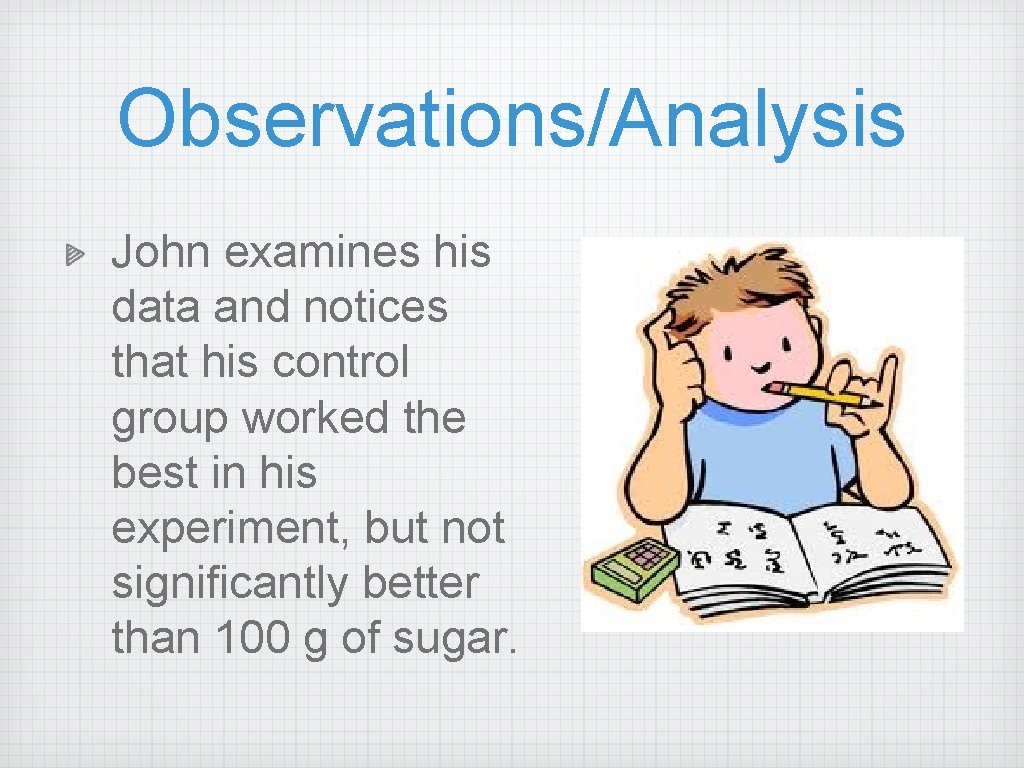
Observations/Analysis John examines his data and notices that his control group worked the best in his experiment, but not significantly better than 100 g of sugar.
Conclusion John rejects his hypothesis, but decides to re-test using sugar amounts between 50 g and 100 g.
Observations/Analysis Size of Bread Loaf (cm 3) Trials Amount of Sugar (g) 1 2 3 Average Size (cm 3) 50 1, 296 1, 440 1, 296 1, 344 60 1, 404 1, 296 1, 440 1, 380 70 1, 638 1, 560 1, 612 80 1, 404 1, 296 1, 332 90 1, 080 1, 200 972 1, 084 Control Group
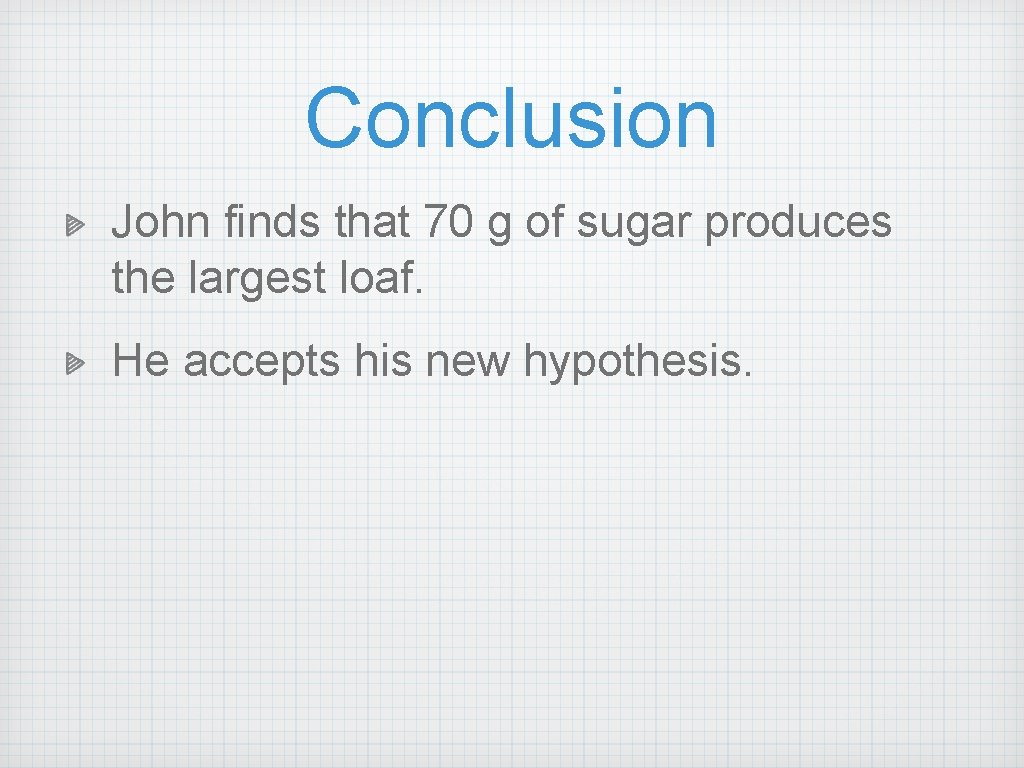
Conclusion John finds that 70 g of sugar produces the largest loaf. He accepts his new hypothesis.