The Scientific Method The Scientific Method Includes 1


 of an Experiment 1. Extend time of experiment")


- Slides: 29
The Scientific Method
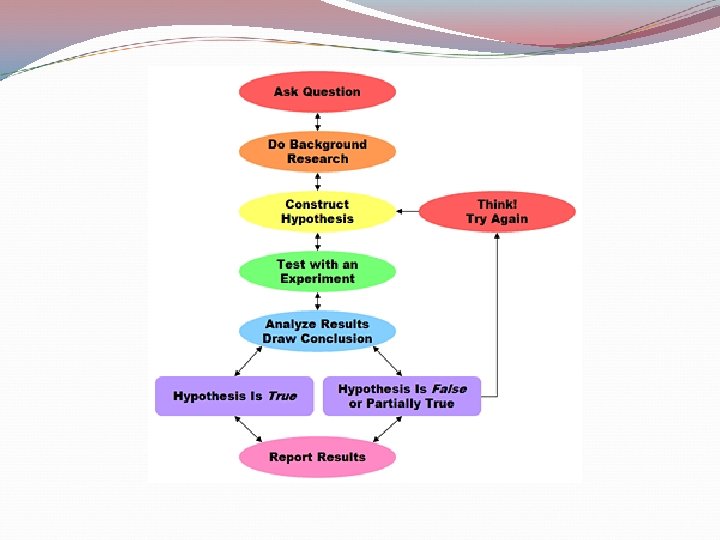
The Scientific Method Includes: 1. Identify the Problem 2. Create a Hypothesis 3. Design the Experiment 4. Collect and Organize Data 5. Analyze Data (results) 6. Draw Conclusions: Reject or Support Hypothesis 7. Peer Review
1. Identify the Problem Identify what you want to test in an experiment. Observe and ask questions about this problem.
2. Create a Hypothesis: a scientific explanation of observations that can be tested (NEVER ? ? ) Educated Guess support or reject at the end of experiment if rejected, a new hypothesis must be created. How to make a hypothesis Use “If, then” model Example: If _(independent variable) affects the (dependent variable), then prediction If the amount of sunlight affects plant growth, then the plants exposed to sun will grow faster.
3. Design the Experiment- organized process used to test a hypothesis Controlled Experiment: only one variable is changed while the other variables remain constant/unchanged Independent Variable- variable that is controlled by experimenter. ( x-axis). Factor that is being tested. It is intentionally changed by them Examples: time, depth, temperature, etc Dependent Variable- variable that is observed and measured Changes in response to independent variable. (y-axis) Examples: growth of plant, number of bubbles produced, etc
3. Design the Experiment Control Group- This group is used for comparison only and is not exposed to the factor being tested. Experimental Group- exposed to same conditions as well as the independent variable that is being tested. Example: Testing Nitrogen (Independent Variable) on Grass Growth (Dependent Variable) Constants=variables held the same Constant Variables for Both Groups: all same soil type, water availability, grass height, etc Control Group: plants with NO nitrogen added Experimental Group: plants WITH Nitrogen added Measure growth of grass in both groups
4. Collect and Organize Data Collect & organize Data Use tables, graphs, and charts
5. Analyze Data/Results Review charts and graphs to determine patterns, trends and other relationships.
6. Draw Conclusions: Reject or Support Hypothesis Conclusion- a judgement based on the results of an experiment Conclusions either support or reject the hypothesis. If one supports the hypothesis, then one can draw conclusions and repeat experiment. If one rejects the hypothesis, then one can draw conclusions and revise hypothesis. This allows one to form a new hypothesis that can be tested.
7. Peer Review Scientists share their findings with their peers in order to test and evaluate each other’s work. A good experiment should produce similar results each time it is performed. Ensures highest standards of quality are met.
Three Ways to Increase Validity (true) of an Experiment 1. Extend time of experiment 2. Increase the number of subject or participants * The more data, the more reliable the results. 3. Repeat the experiment and get similar results.
General Rules When creating your experiment, AVOID these words: All, none , every, never When creating your experiment, USE these words: Increase, decrease, some, most, few
Regents Questions 1. Which condition is necessary for an experiment to yield useful data? A. Similar results should be obtained when the experiment is repeated B. Only the expected results should be considered each time the experiment is performed. C. The hypothesis must be correct. D. The experimental period must be short.
2. Graphs of the data from laboratory investigations are used to A. observe general trends in the data B. make the observed data more accurate C. prevent errors in measuring data D. help change the original data tables
3. Base your answer on the information in the graphic and your knowledge of biology. A variable in this investigation was the A. number of bean plants in each group B. amount of water given daily to each plant C. initial height of each bean plant D. amount of nutrient fed to each group of bean plants
4. An investigation was set up to determine the effectiveness of a particular fertilizer on the growth of bean plants. In the investigation, each of the 10 bean plants in group A was watered with 50 milliliters of a solution of distilled water and fertilizer, while each of the 10 bean plants in group B was watered with 50 milliliters of distilled water only. Both groups of plants were watered every other day for 1 month and grown under identical environmental conditions. The control for this investigation was A. group A, only B. group B, only C. both group A and group B D. neither group A nor group B
5. The graph shows the relative average mass of the ovaries of a certain species of toad each month for a period of 1 year. Which inference could correctly be made from this graph? A. Eggs are produced within the ovaries between May and October. B. Eggs are released into the environment during the period from November to February. C. The mating season of this species is from June through November. D. The toad stops producing eggs in August.
6. A water plant placed in bright light gives off bubbles. A student notes that placing the light at different distances from the plant causes the rate of bubbling to vary. The student decides to design an experiment to investigate the effect of light intensity on the rate of bubble production. An appropriate control for this experiment would be A. a plant at a fixed distance from the light source B. a plant exposed to sunlight C. the addition of oxygen to the water D. the use of blue light on some of the plants
7. A scientific study showed that the depth at which algae were found in a lake varied from day to day. On clear days, the algae were found as much as 6 meters below the surface of the water, but were found only 1 meter below the surface on cloudy days. Which hypothesis best explains these observations? A. Light intensity affects the growth of algae. B. Wind currents affect the growth of algae. C. Nitrogen concentration affects the growth of algae. D. Precipitation affects the growth of algae.
8. A student performed a laboratory investigation to determine the effect of temperature on the heart rate of Daphnia (water flea). The following temperatures and heart rates were recorded: 20°C – 260 beats/min 10°C – 152 beats/min 25°C – 300 beats/min 5°C – 108 beats/min 15°C – 200 beats/min During which temperature interval did the greatest change in heart rate occur? A. 5– 10°C B. 10– 15°C C. 15– 20°C D. 20– 25°C
9. A biologist in a laboratory reports a new discovery based on experimental results. If the experimental results are valid, biologists in other laboratories should be able to A. repeat the same experiment with a different variable and obtain the same results B. perform the same experiment and obtain different results C. repeat the same experiment and obtain the same results D. perform the same experiment under different experimental conditions and obtain the same results
10. As part of an investigation, 10 bean seedlings in one setup were grown in the dark, while 10 seedlings in another setup were grown in sunlight. All other growth conditions were kept the same in both setups. The seedlings grown in the dark were white with long, slender stems. The seedlings grown in the sunlight were green and healthy. Which hypothesis was most likely being tested in this investigation? A. Plants grown in the dark cannot perform the process of respiration. B. Sunlight is necessary for the normal growth of bean plants. C. Light is necessary for the germination of bean seeds. D. Light is necessary for proper mineral absorption by plants.
11. An investigation was designed to determine the effect of ultraviolet light on mold spore growth. Two groups of mold spores were grown under identical conditions, except one group was exposed only to ultraviolet light, while the other group was grown in total darkness. In this investigation, the group of mold spores grown without receiving any ultraviolet light is known as the A. control B. hypothesis C. dependent variable D. limiting factor
12. Which relationship can correctly be inferred from the data presented in the graphs? A. As sewage waste increases, oxygen content decreases. B. As sewage waste increases, oxygen content increases. C. As oxygen content decreases, carp population decreases. D. As oxygen content decreases, trout population increases.
13. An experiment was performed to determine the effect of different mineral salts on plant growth. Forty pots containing genetically identical plants were divided into four equal groups and placed in a well-lighted greenhouse. Each pot contained an equal amount of nonmineral potting soil and one plant. Minerals were then added in equal amounts to each experimental group of pots as shown in the diagram. For the experiment to be valid, what should be added to the control group of pots? A. water B. nitrogen salts C. potassium salts D. potassium and phosphorus salts
14. Diagrams, tables, and graphs are used by scientists mainly to A. design a research plan for an experiment B. test a hypothesis C. organize data D. predict the independent variable
15. In an investigation, three seeds of the same species were allowed to germinate and grow in three different locations. Each seedling was grown in the same amount and type of soil, and each received the same amount of water during a 6 -day period. At the end of the investigation, the height of each seedling and the color of its leaves were recorded. The results are shown in the data table. Which hypothesis was most likely being tested in this investigation? A. A plant grown in the dark will not be green. B. The type of soil a plant is grown in influences how tall it will be. C. Plants need water to grow. D. Plants grown in red light are taller than plants grown in green light.
Answers 1. 2. 3. 4. 5. 6. 7. 8. 9. 10. 11. 12. 13. 14. 15. A A D B A A A C C B A A A C A