The Scientific Method Steps in the Scientific Method


- Slides: 17
The Scientific Method
Steps in the Scientific Method Observe and ask a Question Form a Hypothesis
Hypotheses Educated Guess Observation Research Literature Hypotheses are tentative scientific explanations for a set of observations that can be tested
THEORY LAWS HYPOTHESIS FACTS
Steps in the Scientific Method Observe and ask a Question Form a Hypothesis Controlled Experiment
Controlled Experiments Only one variable is changed Variable – factors that change Independent variable: manipulated Dependent variable: Responding Measured
Scientific Methodology Design controlled experiment Two test groups 1. Experimental group – Independent variable changed 2. Control group – Independent variable NOT changed
Situation 1 Smithers thinks that a special juice will increase the productivity of workers. He creates two groups of 50 workers each and assigns each group the same task (in this case, they're supposed to staple a set of papers). Group A is given the special juice to drink while they work. Group B is not given the special juice. After an hour, Smithers counts how many stacks of papers each group has made. Group A made 1, 587 stacks, Group B made 2, 113 stacks. Control group: Experimental group: Independent variable: Dependent variable: Conclusion:
Situation 2 Krusty was told that a certain itching powder was the newest best thing on the market, it even claims to cause 50% longer lasting itches. Interested in this product, he buys the itching powder and compares it to his usual product. One test subject (A) is sprinkled with the original itching powder, and another test subject (B) was sprinkled with the Experimental itching powder. Subject A reported having itches for 30 minutes. Subject B reported to have itches for 45 minutes. Control group: Experimental group: Independent variable: Dependent variable: Conclusion:
Steps in the Scientific Method Observe and ask a Question Form a Hypothesis Controlled Experiment Collect & Analyze Data
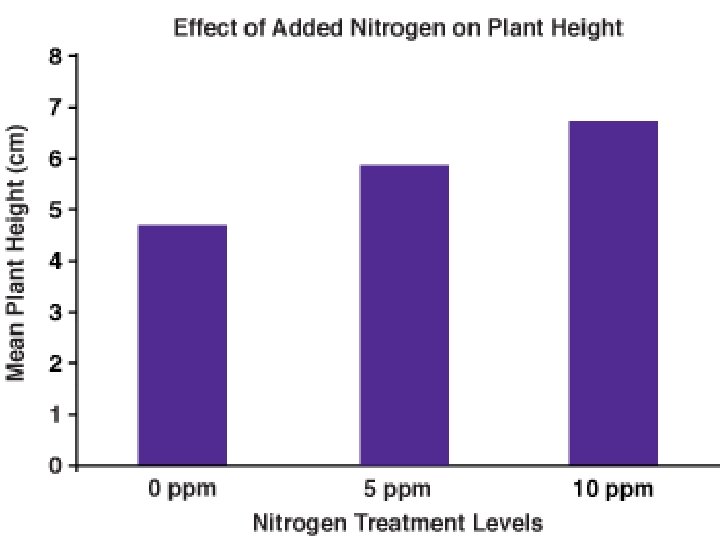
Graphs 1. Bar Graph • Bar Graphs • One time comparisons • Often categories • Can be numerical too! The Amount of Defective Cars Produced in Car Factories
Graphs 2. Line Graph • Line Graphs • Show change over time • Often numerical data
Amount
Plotting Data
Steps in the Scientific Method Observe and ask a Question Form a Hypothesis Controlled Experiment Collect & Analyze Data Draw Conclusion Publish Results
Publish Results Primary Literature Peer reviewed