The Sampling Distribution of the Sample Proportion Inference

The Sampling Distribution of the Sample Proportion Inference for categorical data

Introduction to Statistical Inference Methods � Statistical Inference: Drawing conclusions about a population from sample data. � Methods Ø Point Estimation– Using a sample statistic to estimate a parameter Ø Confidence Intervals – supplements an estimate of a parameter with an indication of its variability Ø Hypothesis Tests - assesses evidence for a claim about a parameter by comparing it with observed data Parameter Measure Statistic Mean of a single population Proportion of a single population Mean difference of two dependent populations (MP) Difference in means of two populations Difference in proportions of two populations Variance of a single population Standard deviation of a single population S

Categorical Variables � Categorical variables place individuals into one of several groups Voting on an issue: Approve Disapprove Undecided Color of Bag Orange Blue Red

Analysis of Categorical data � Calculating � We the mean is impossible. can count the occurrences or “successes” � From the counts we can calculate proportions… ◦ Ex. Approval ratings Read as “p-hat”

The Population Proportion, p � If our data are categorical we can count the number of occurrences of each outcome to describe the population. � From counts we can calculate proportions. is an estimate of p (sample statistic). � We studied the binomial distribution using the count of the number of successes, X. � We now deal with sample proportions because we want to estimate the probability of success, p in a population.

Is Inference Possible? � Can we use a sample proportion to make inferences about a population proportion?

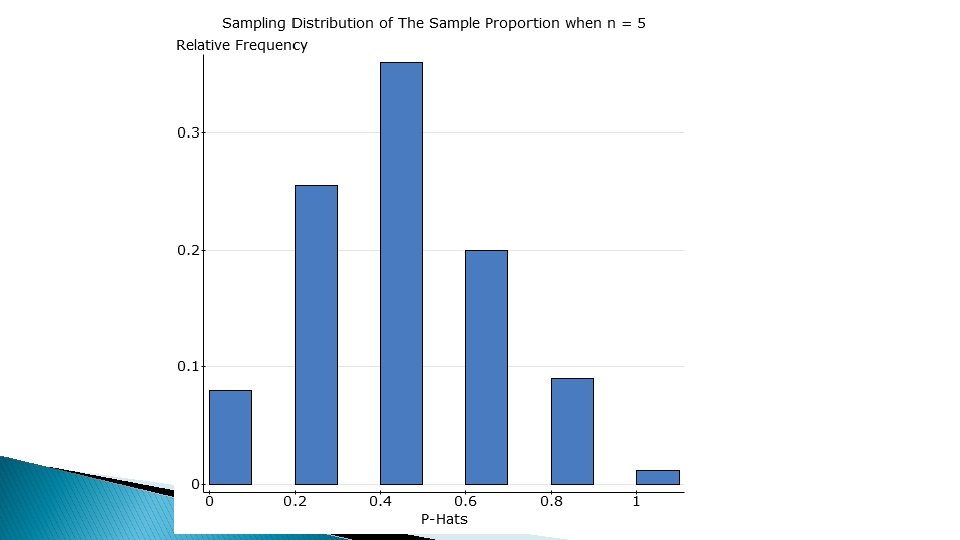
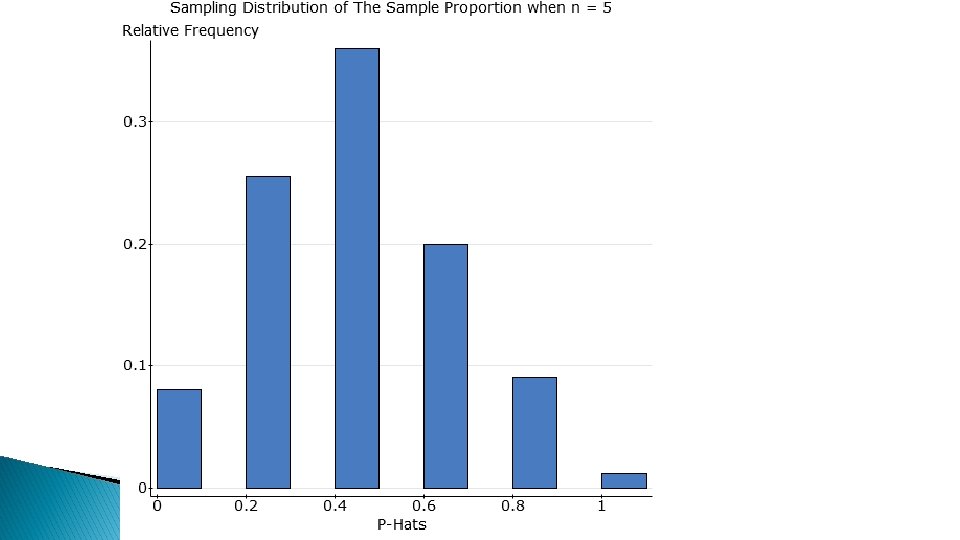
Simulating the Sampling Distribution of the Sample Proportion � Assume we know the president’s approval rating among college students is 40%. � Let’s imagine our population is all students at a large University (N=35, 000) � First, we will take 1000 samples of size n=5 from this population. � Then calculate the sample proportion and graph them. 7

Questions to think about � What is the shape of the sampling distribution? � What statistical value will be found at the center of the sampling distribution? � What is the spread of this sampling distribution? � Does the spread depend on a certain quantity?

Questions �

Precision � The standard error is defined to be the standard deviation of the sampling distribution… Column P-Hats � Recall, n 5 Mean 0. 4004 Std. dev. 0. 22353928 when looking at the sampling distribution of the sample mean, we saw that precision (standard error) had an inverse relationship with sample size.

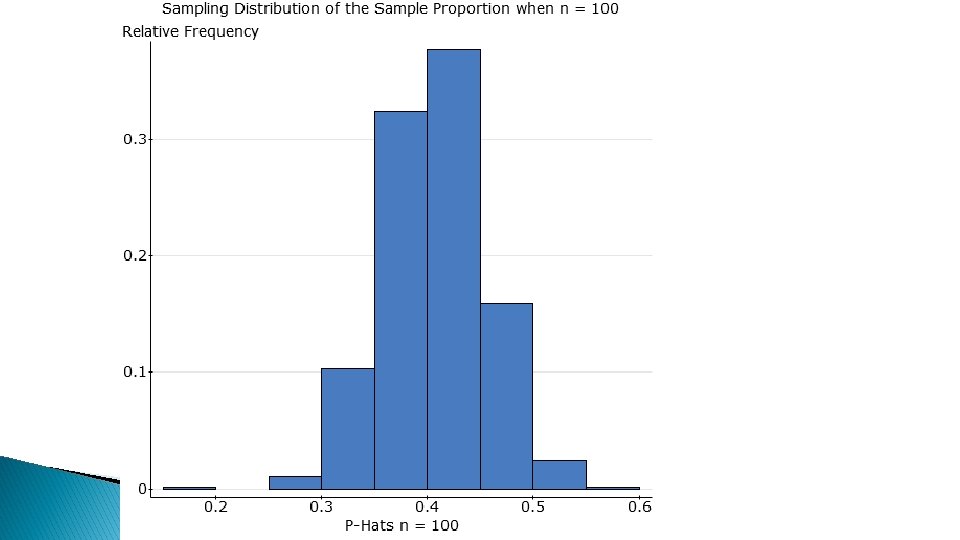
Another Sampling Distribution � Assume we know the president’s approval rating among college students is 40%. � We will still pretend we have a larger population size of 35, 000 students. � Now, we will take 1000 samples of size 100 from this population. � Keep same questions in mind

Questions � What is the shape of the sampling distribution? � What statistical value will be found at the center of the sampling distribution? � What is the spread of the sampling distribution when n = 100 and how does it compare to the spread of the sampling distribution when n = 5? � Does the spread depend on a certain quantity?

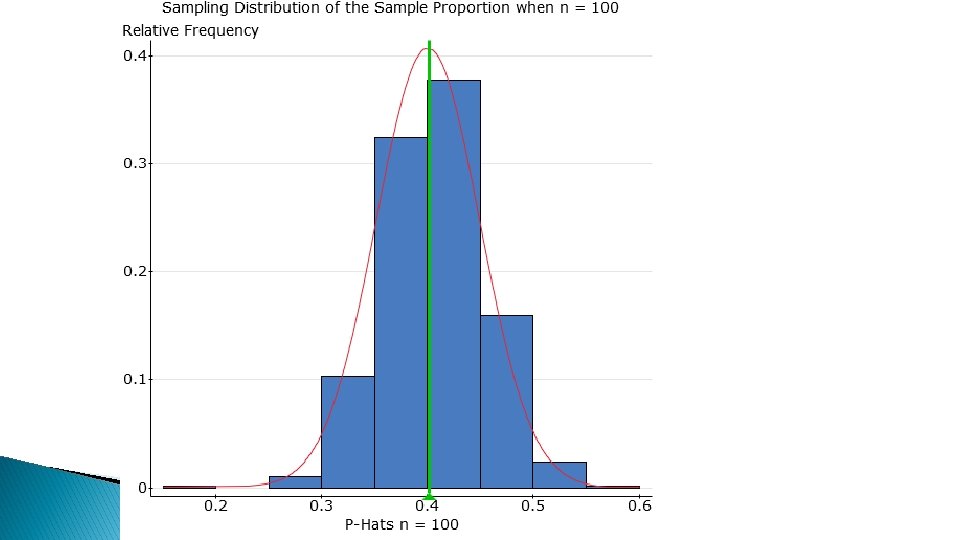
Questions � What is the shape of the sampling distribution? ◦ Our sampling distribution looks approximately normal. ◦ The shape of the sampling distribution becomes more symmetric as the sample size of each sample becomes larger. � What statistical value will be found at the center of the sampling distribution? ◦ The mean of the 1000 sample proportions will be very close to the population parameter p. � What is the spread of the sampling distribution where n = 100 and how does it compare to the spread of the sampling distribution where n = 5? ◦ It seemed to get smaller lets take a closer look � Does the spread depend on a certain quantity?


Compare Column # Mean Std. dev. P-Hats n = 5 1000 0. 4004 0. 22353928 Column # Mean Std. dev. P-Hats n = 1000 0. 40177 0. 047082734 The means are nearly the same but the standard error for the larger sample size is much smaller. Smaller standard error = more precise

Standard Error for sample proportion � The quantity that measures the standard deviation of the sampling distribution of the sample proportion is… � From our 1000 samples of n=100 the standard deviation is 0. 047. � 0. 047 is close to:

Conditions for CLT for Sample Proportions 1. 2. Sampling is random and independent. May sample with or without replacement. The sample size, n, is large enough that the sample expects at least 10 successes (yes) and 10 failures (no). and 3. Big population: If sampling is done without replacement, the population must be at least 10 times larger than the sample size.
 � When all conditions hold, the sampling distribution for")
Central Limit Theorem (for proportions) � When all conditions hold, the sampling distribution for the sample proportion is approximately Normal, with mean p (the population proportion) and standard deviation defined to be the standard error given as:

Shape: Approximately Normal We can assume this is valid when np > 10 and n(1 – p) > 10
 �")
Implications of the CLT (for p) �

Example �

Solution �
- Slides: 26