THE ROLE OF STATISTICS IN RESEARCH Reading APPENDIX


 Flat distribution")


 Jo 50, 60,")


 Mean 68% -2 -1 0 +1")


 -quantifies associations -plug your numbers into the correlation formula (see book)")


- Slides: 25
THE ROLE OF STATISTICS IN RESEARCH
Reading APPENDIX A: Statistics pp. 673 -677
Definition A field of mathematics dealing with the analysis, interpretation, and presentation of masses of numerical data (Merriam-Webster’s Collegiate Dictionary). There are three kind of lies: “Lies, damned lies, and statistics. ”
Types of Statistics Descriptive Statistics - simple quantitative summaries of the data - describe the basic features of the data in a study Inferential Statistics - used for testing hypotheses. - complex calculations based on probabilities - help reach conclusions about the data. eg did these 2 samples come from the same population ?
We’ll focus on Descriptive Statistics
Frequency Distributions • A summary of the frequency of individual scores on one variable • i. e. , How many people got each score • Nominal (categories) vs. Score (ordered) variables • Smooth curve vs. histogram
Histogram of of Psych 100 grades
Three Aspects of Distributions 1. SHAPE: flat, normal, skewed etc 2. CENTRAL TENDENCY: where is the "center" of a distribution? - Mean, median, or mode 3. VARIABILITY: how different are the scores from each other?
1. Shapes of Distributions The normal distribution (bell-curve) Flat distribution
More Shapes Skewed distributions Leans to right Leans to left
2. Measures of Central Tendency MEAN - average of the scores - (Sum of scores)/Number of people MEDIAN - the middle score when ordered MODE - most frequent score
Shape is important too Multi-modal distributions 0 2
They sometimes disagree Mo 50, 60, 99, 100 (Mean = 74) Jo 50, 60, 70, 90 (Mean = 68) Flo 50, 75, 76, 77 (Mean = 66)
2. Measures of Variability RANGE: - the highest value minus the lowest value STANDARD DEVIATION: - the average difference among the scores
e. g. of Variability Two normal distributions -same mean --differ in variability
Normal Curve Mean 3% 68% 130 150 170 3% 190 210
Standard Normal Curve (in terms of standard deviations) Mean 68% -2 -1 0 +1 +2
Measuring associations between variables: The main goal of science
Plotting Associations
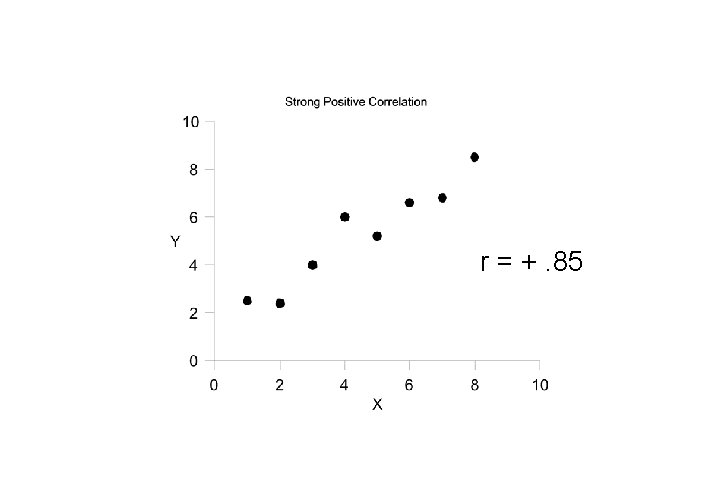
CORRELATION COEFFICIENT (r) -quantifies associations -plug your numbers into the correlation formula (see book) -yields a number between -1 and +1
Perfect positive correlation r = + 1. 00
Perfect negative r = - 1. 00
Zero correlation r=0
SUMMARY One variable: • Frequency distributions • measures of central tendency • measures of variability Two variables: • correlations