The Rise and Rise of Graphic Expectations Aimee


- Slides: 43
The Rise and Rise of Graphic Expectations Aimee Gott Consultant Aimee Gott – R Consultant agott@mango-solutions. com
BACKGROUND Aimee Gott – R Consultant agott@mango-solutions. com
Who are Mango? • Provide data science and analytic implementation services • Premier providers of R Services in the world today • Private company founded in 2002 • Offices in UK & China • Global Team of ~50 • ISO 9001 Accredited Aimee Gott – R Consultant agott@mango-solutions. com
My Background • Trained as a Statistician • Worked at Mango since 2012 • Worked on many projects with the Pharma Industry • • Training Analysis Application Development Validation of R Aimee Gott – R Consultant agott@mango-solutions. com
HISTORY Aimee Gott – R Consultant agott@mango-solutions. com
1970's • SAS requires hundreds of punch cards • S in its infancy • Graphics usage limited Aimee Gott – R Consultant agott@mango-solutions. com
1980's • SAS/GRAPH released • Initial interactive graphics in S-PLUS Aimee Gott – R Consultant agott@mango-solutions. com
1990's • S-PLUS becomes a licenced product • R development begins Aimee Gott – R Consultant agott@mango-solutions. com
2002 • Mango founded • Started working with Pharma companies using SPLUS • R being more widely used, lots of support for graphics systems Aimee Gott – R Consultant agott@mango-solutions. com
Late 2000's • ggplot 2 is first released in R • Graphics being widely used • R starting to be used in Pharma, primarily for graphics Aimee Gott – R Consultant agott@mango-solutions. com
NOW Aimee Gott – R Consultant agott@mango-solutions. com
The i. Generation • • • Graphics are everywhere They have to be clear They have to look good They are interactive Information is easy to access Aimee Gott – R Consultant agott@mango-solutions. com
What is Expected? • Sophisticated Graphics Aimee Gott – R Consultant agott@mango-solutions. com
Aimee Gott – R Consultant agott@mango-solutions. com
What is Expected? • Sophisticated Graphics • Interactive Aimee Gott – R Consultant agott@mango-solutions. com
Aimee Gott – R Consultant agott@mango-solutions. com
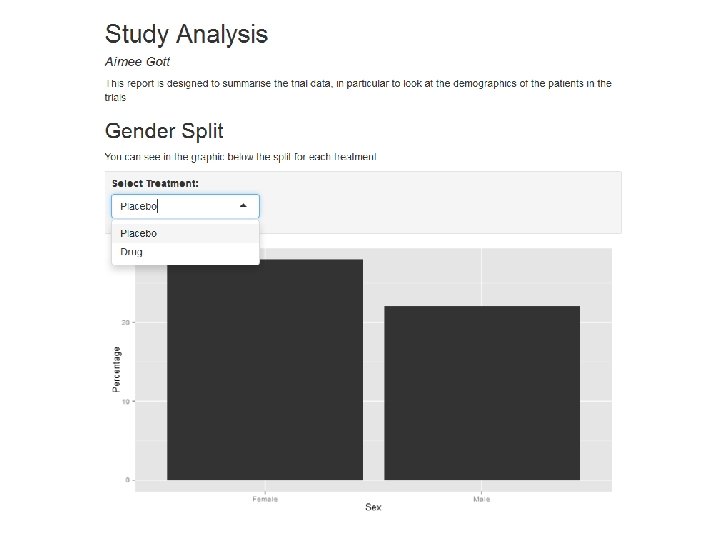
What is Expected? • Sophisticated Graphics • Interactive documents Aimee Gott – R Consultant agott@mango-solutions. com
CHALLENGES Aimee Gott – R Consultant agott@mango-solutions. com
Challenges in Pharma • • Graphics for decision making Analysis time shrinking Multi-technology Graphics must be reproducible? Aimee Gott – R Consultant agott@mango-solutions. com
Aimee Gott – R Consultant agott@mango-solutions. com
Example 1 • Area: Pre. Clin - FTi. H • Challenge: Traceability of Decisions • Solution: Interactive decision chart Aimee Gott – R Consultant agott@mango-solutions. com
What was the Challenge? • Teams use their "favourite" way to make a decision • Difficult to trace what data was used • Difficult to re-generate graphics Aimee Gott – R Consultant agott@mango-solutions. com
Solutions • Single solution for presenting data to safety board • Consistent production of informative graphics • Auditable repository of graphics Aimee Gott – R Consultant agott@mango-solutions. com
Aimee Gott – R Consultant agott@mango-solutions. com
Aimee Gott – R Consultant agott@mango-solutions. com
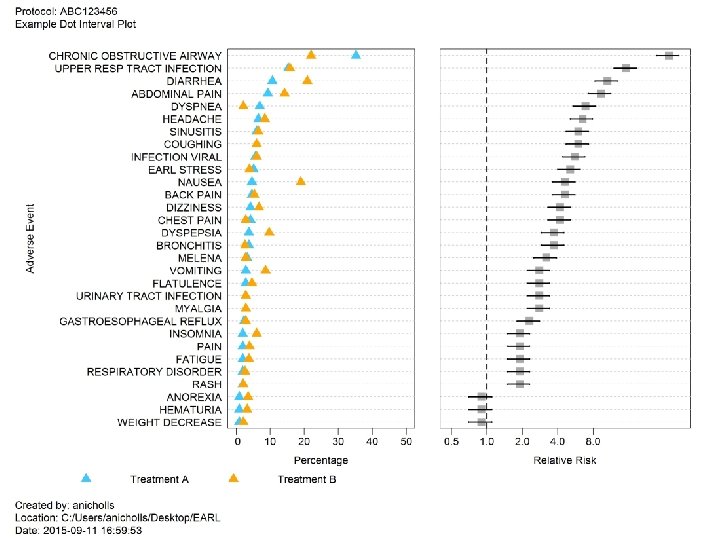
Example 2 • Area: Trial Reporting • Challenge: Reduced time for reporting, lots of graphics • Solution: Automated reporting Aimee Gott – R Consultant agott@mango-solutions. com
Challenge • Very short timelines for generating reports • Reports contain lots of graphics • Data often changes at the last minute Aimee Gott – R Consultant agott@mango-solutions. com
Dynamic Reporting in R • Report + code in one file • Graphics re-generated automatically • Data can be changed and re-run Aimee Gott – R Consultant agott@mango-solutions. com
Example 3 • • Area: Clinical Reporting Challenge 1: Consistency and quality Challenge 2: Multiple Tools Solution: SAS to R link Aimee Gott – R Consultant agott@mango-solutions. com
Requirements • High quality graphics • Consistent • Easily reproducible Aimee Gott – R Consultant agott@mango-solutions. com
Solution • Interface to R from SAS • R based library of standard graphics Aimee Gott – R Consultant agott@mango-solutions. com
Design Write csv SAS Write R script R R Script Call R Aimee Gott – R Consultant agott@mango-solutions. com
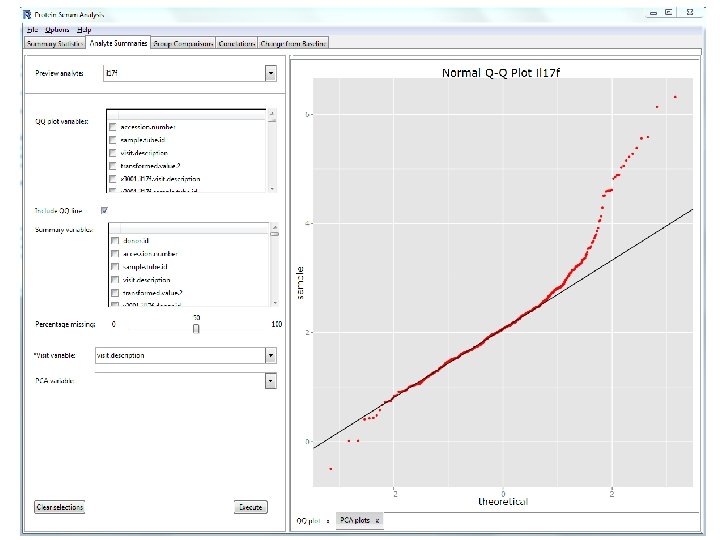
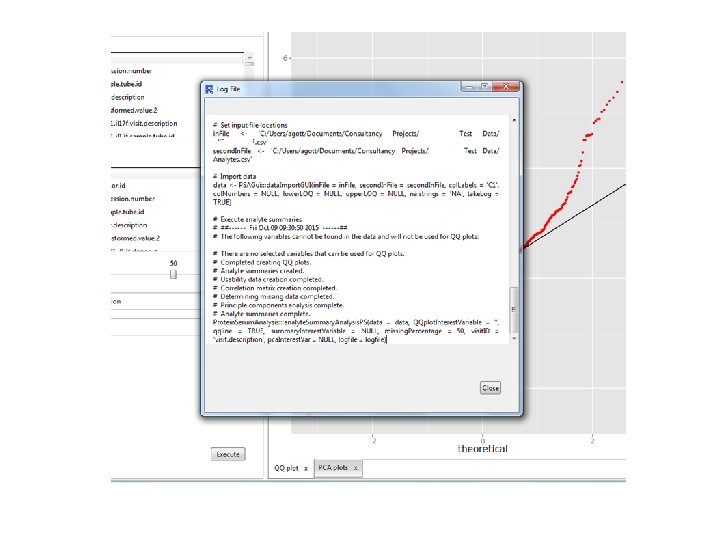
Example 4 • Major Pharma company in Philadelphia • Challenge: Traceability of interactive graphics • Solution: Built a custom GUI that generates a script Aimee Gott – R Consultant agott@mango-solutions. com
Challenges • Traceability of decisions • Interactive graphics for decision making • Tool for non-programmers Aimee Gott – R Consultant agott@mango-solutions. com
Code Generating Interface • • • Users interact with custom GUI Graphics updated based on selected options All code generated for traceability Graphics completely reproducible Decision making tracked Aimee Gott – R Consultant agott@mango-solutions. com
THE FUTURE Aimee Gott – R Consultant agott@mango-solutions. com
Future Challenges? • • New tools to learn Better graphical awareness New coding standards New tools to validate • R + shiny apps • Java. Script Aimee Gott – R Consultant agott@mango-solutions. com
Summary • Pharma industry leading stats computing • Graphics a huge part of reporting • Many open questions about interactive graphics. . . Aimee Gott – R Consultant agott@mango-solutions. com
www. mango-solutions. com @Mango. The. Cat @aimeegott_R Aimee Gott – R Consultant agott@mango-solutions. com