The Rhode Island Experience Ellen Evans Alexander Assistant


 Ø Ø Offenders with low risk levels and low to")
- Slides: 13
The Rhode Island Experience Ellen Evans Alexander Assistant Director RI Department of Corrections
Rhode Island in a Nutshell Unified Prison System with 8 jail and prison facilities Ø 3700 inmates (81% sentenced and 19% awaiting trial) Ø Average sentence is 17 months Ø Majority receive a sentence of 6 months or less (not parole eligible) Ø 27, 000 offenders on probation and parole Ø • 145 offenders seen by Parole Board monthly • 387 offenders are under parole supervision • 66 offenders are on electronic monitoring
Rhode Island Parole Board Ø Statutory authority to consider the early release of incarcerated offenders who have been sentenced to more than six (6) months and who have served not less than one-third 1/3 of the sentence. Ø In July 2007 structured decision-making was implemented. The Parole Board continues to exercise broad discretion to determine when and if an offender will be released from imprisonment. Ø Statutory authority to revoke parole if the parolee has violated state law or violated the terms and conditions of his or her permit.
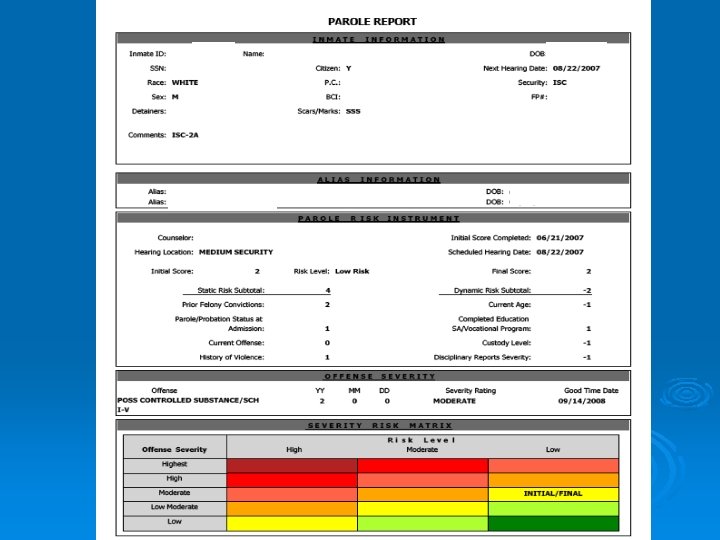
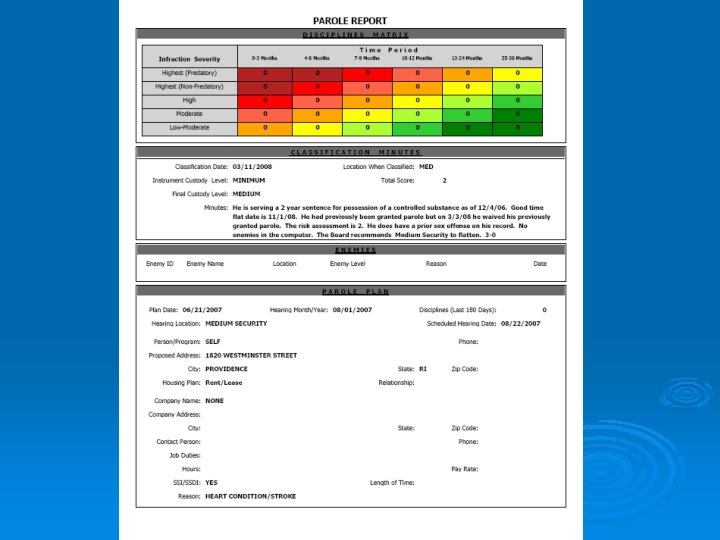
Parole Risk Assessment Ø Two components provide an actuarial based risk score. 1. Risk Assessment Instrument static factors (i. e. commitment offense, past history of violence or felonies) dynamic factors (i. e. current age, prison programs completed during incarceration, discipline, scored custody level) 2. Offense severity class Range from low for non-violent crimes to highest for capital crimes. Ø Both factors are merged into a Severity Risk Matrix Ø The instrument is scored upon sentenced commitment and then scored a second time about one month before the parole hearing.
TCU Drug Screen Ø DOC starts preparing for potential Parole Board consideration the day the inmate is sentenced. Ø Initial indications is that 70 -80% of our sentenced population need substance abuse treatment. Ø Texas Christian University (TCU) Drug Screen is an initial screening instrument to assess need for drug treatment. Ø TCU Particulars l l Ø 15 questions administered day after sentencing started January 2007 scoring indicates a need level (low, medium, high) Results of first study Need Level Number Percent Low or none (0 -2) 291 17. 2% Medium (3 -5) 391 23. 1% High (6 -9) 1012 59. 7%
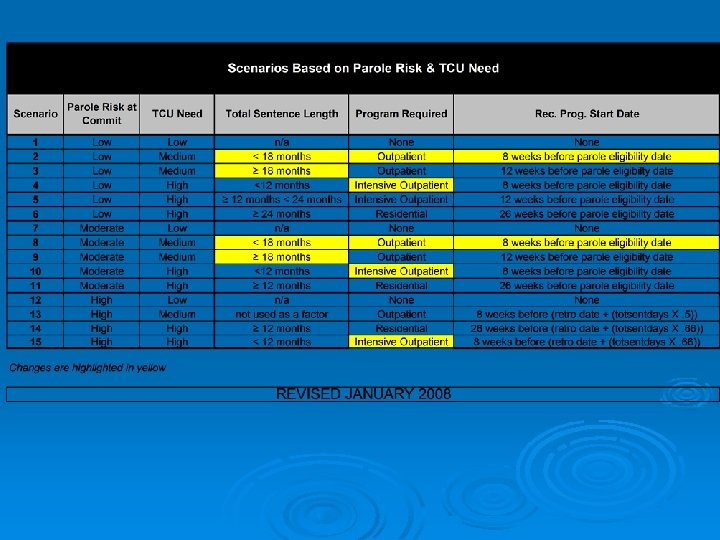
TCU / Parole Risk Matrix Ø Factors to determine when and type of substance abuse treatment l TCU need level l initial parole risk level l sentence length Ø These 3 factors result in l program recommendation for type of substance abuse treatment l recommended start date for treatment Ø Goal: Inmate can complete recommended program before first parole hearing Ø Distribution of first study Recommended Program Number Percent No Program Recommended 221 16. 8% Outpatient 292 22. 2% Intensive Outpatient 202 15. 3% Residential 601 45. 7%
Initial Parole Board Release & In-Prison Substance Abuse Treatment Matrix
Average Monthly Parole Population FY 06 -FY 09* *FY 09 through February 2009
Results and Hurdles Ø The number of parolees has increased 10 % over last year and 35% since fiscal year 2006. Ø In initial study, we found more people were paroled who were low risk and had moderate to low crime severity levels. Risk Level Moderate Low n/a 25 % 26. 1% ( 0/ 0 ) ( 2/ 8 ) ( 12 / 46 ) High 42. 9% 32. 8 % 48. 5 % (3/7) ( 19 / 58 ) ( 33 / 68 ) Moderate 38. 5 % 45. 2 % 64. 0 % ( 5 / 13 ) ( 66 / 146 ) ( 87 / 136 ) Highest Offense Severity Level High Low – Moderate Low 20 % 48. 9 % 50. 8 % (1/5) ( 22 / 45 ) ( 30 / 59 ) 100 % 32. 7 % 47. 6 % ( 3 /3 ) ( 16 / 49 ) ( 20 / 42)
Results and Hurdles (continued) Ø Ø Offenders with low risk levels and low to moderate crime severity were denied for various reasons: • lack of program completion • seriousness of crime • limited insight • long criminal history • recent booking • victim impact Not all recommended substance treatment programs are available in each prison facility. Waiting lists for substance abuse programs both in prison and in community. Economic downturn making job placement and secure housing more challenging.