
The REA Data Model Based on 2003 Prentice
The REA Data Model Based on: © 2003 Prentice Hall Business Publishing, Accounting Information Systems, 9/e, Romney/Steinbart
The REA Data Model The REA data model is a conceptual modeling tool specifically designed to provide structure for designing AIS data bases.
The REA Data Model • The REA data model provides structure in two ways: – By identifying what entities should be included in the AIS database – By prescribing how to structure relationships among the entities in the AIS database
Business Activities • Business transactions are exchanges. • Who “gets” what and who “gives” what in return are separate transactions. • The exchange occurs between the business entity and usually an outside agent. • The business gives something and then gets something in return.

Resources, Events, and Agents • Every business transaction is made up of three components: – Resources are things of economic value exchanged. – Events are the actual giving and getting of the resources. – Agents are the people who actually make the exchange.
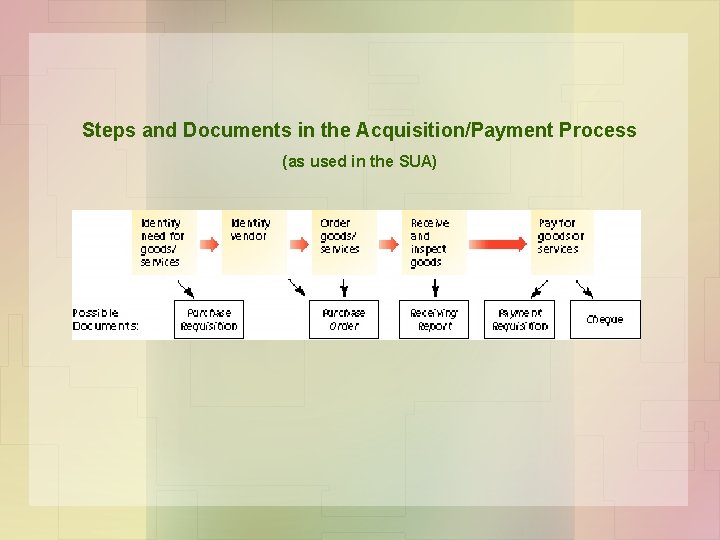
Steps and Documents in the Acquisition/Payment Process (as used in the SUA)
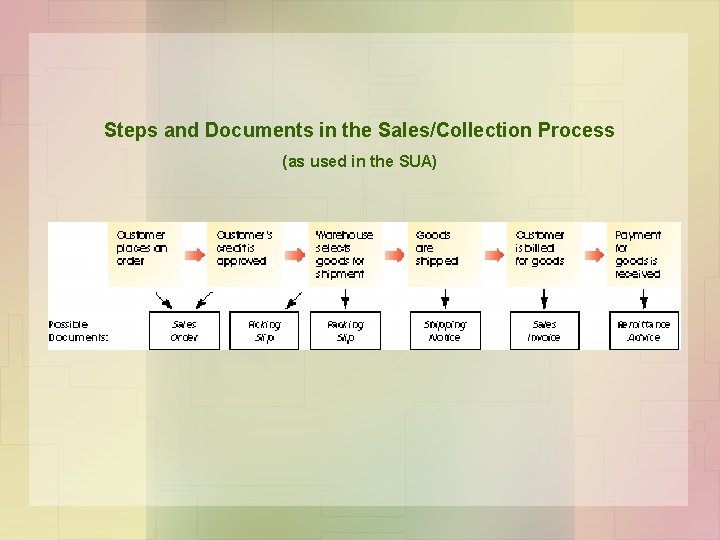
Steps and Documents in the Sales/Collection Process (as used in the SUA)

The Accounting Equation Assets = Claims Assets = Liabilities + Owner’s Equity Asset: economic resources owned by the business. • Liability: obligations of the business to creditors. • Equity: owner’s claims to the assets. •
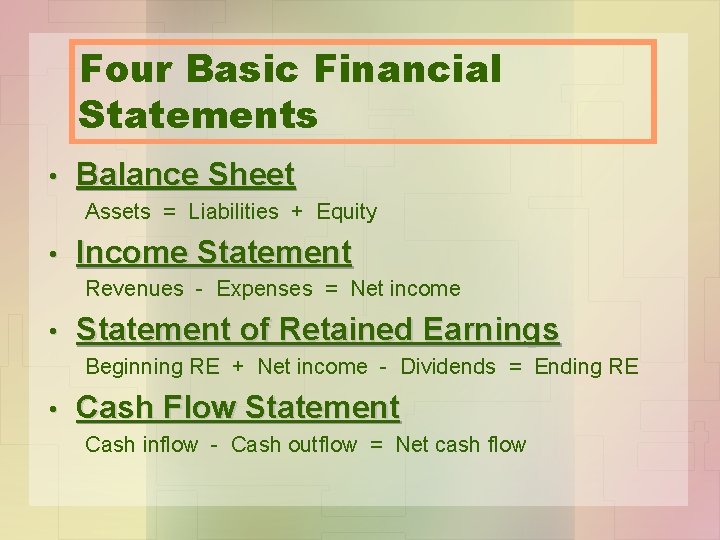
Four Basic Financial Statements • Balance Sheet Assets = Liabilities + Equity • Income Statement Revenues - Expenses = Net income • Statement of Retained Earnings Beginning RE + Net income - Dividends = Ending RE • Cash Flow Statement Cash inflow - Cash outflow = Net cash flow
Traditional Approaches: User-View Orientation • When data-modeling and IS design is too oriented toward the user’s views, problems arise: – – multiple information systems duplication of data restricted user-view leads to poor decision-making inability to support change
Traditional Approaches: Financial Accounting Orientation • Dominance of traditional accounting as the primary information provider leads to problems: – single view of business entity using the accounting/balance sheet model: Assets = Liabilities + Owners’ Equity – – double-entry, debits and credits high level of aggregation ignoring non-financial data inability to serve diverse enterprise-wide needs
The REA Approach to Business Modeling
Resources, Events, and Agents (REA) Model • Developed in the ‘ 70's by Dr. Bill Mc. Carthy of Michigan State University • The definition of events is broad enough to encompass both operational and accounting transactions. – Expands the scope and usefulness of AIS by making it capable of providing both financial and nonfinancial information. • Data for each event is stored in disaggregated form. – Outputs are subsequently produced by assembling the required data from the various records. • Many firms have not adopted the REA model since it is a major change from the traditional double-entry approach. – The REA or events perspective is increasingly seen as necessary to meet changing information needs.
Resources, Events, and Agents (REA) Model … • An approach to database design meant to overcome problems with traditional approaches: – – – – formalized data modeling and design of IS use of centralized database use of relational database structure collects detailed financial and non-financial data supports accounting and non-accounting analysis supports multiple user views supports enterprise-wide planning
Resources, Events, and Agents (REA) Model … • The REA model is an alternative accounting framework for modeling an organization’s – economic resources – economic events – economic agents, and – their interrelationships • A variation of entity-relationship diagramming (ERD) is used to model these relationships.
Resources in the REA Model • Economic resources are the assets of the company. – able to generate revenue – objects that are scarce and under the control of the organization – can be tangible or intangible • Does not include some traditional accounting assets: – for example, Accounts Receivables – artifacts that can be generated from other primary data
Events in the REA Model • Economic events are phenomena that effect changes in resources. – a source of detailed data in the REA approach to databases • Three classes of events: – operating events--what happens – information events--what is recorded – decision/management events--what is done as a result • Only operating events are included in the REA model.
Agents in the REA Model • Can be individuals or departments • Can participate in events • Can affect resources – have discretionary power to use or dispose of resources • Can be inside or outside the organization – – – clerks production workers customers suppliers, vendors departments, teams
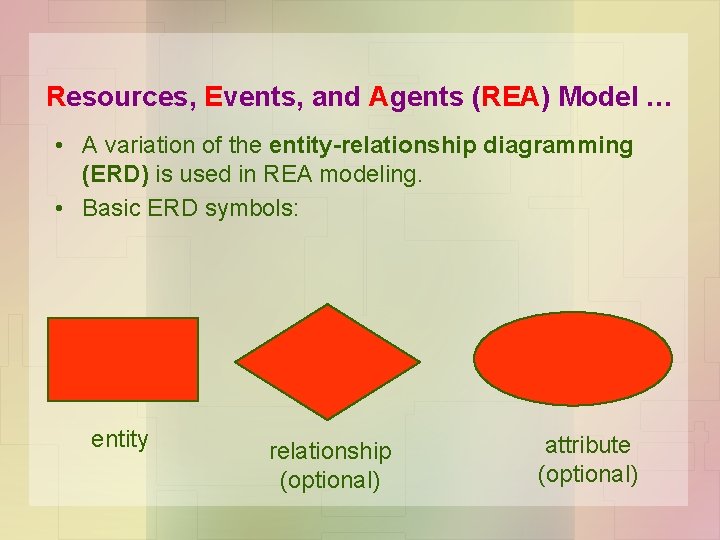
Resources, Events, and Agents (REA) Model … • A variation of the entity-relationship diagramming (ERD) is used in REA modeling. • Basic ERD symbols: entity relationship (optional) attribute (optional)
Advantages of the REA Model • Using REA can lead to more efficient operations – helps managers identify non-value added activities that can be eliminated • increased productivity via elimination of non-value added activities generates excess capacity – storing both financial and nonfinancial data in the same central database reduces multiple data collection, data storage, and maintenance – detailed financial and nonfinancial business data supports a wider range of management decisions • increased competitive advantage by providing more relevant, timely, and accurate information to managers
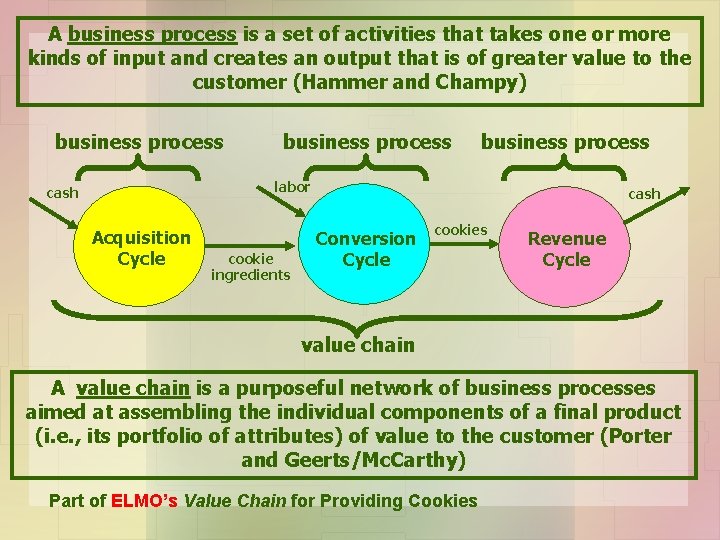
Value Chain Analysis • Competitive advantages from the REA approach can be see via value chain analysis. – Value chain analysis distinguishes between primary activities (create value) and support activities (assist performing primary activities). – REA provides a model for identifying and differentiating between these activities. – Prioritizing Strategy: Focus on primary activities; eliminate or outsource support activities.
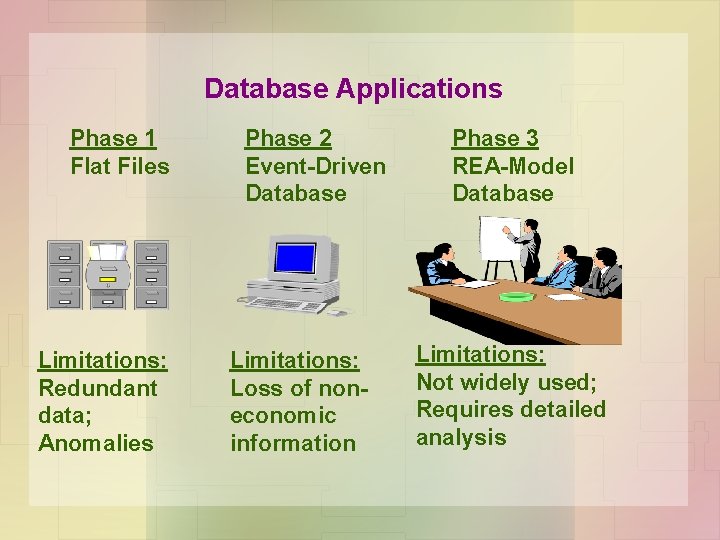
Database Applications Phase 1 Flat Files Limitations: Redundant data; Anomalies Phase 2 Event-Driven Database Limitations: Loss of noneconomic information Phase 3 REA-Model Database Limitations: Not widely used; Requires detailed analysis
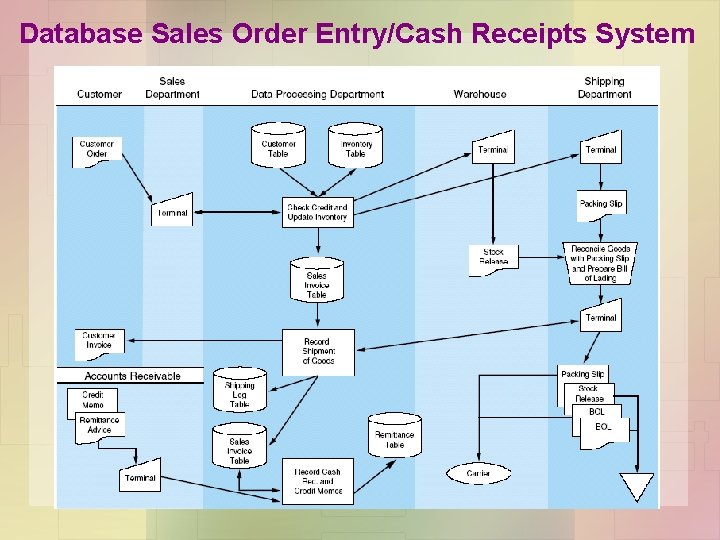
Database Sales Order Entry/Cash Receipts System
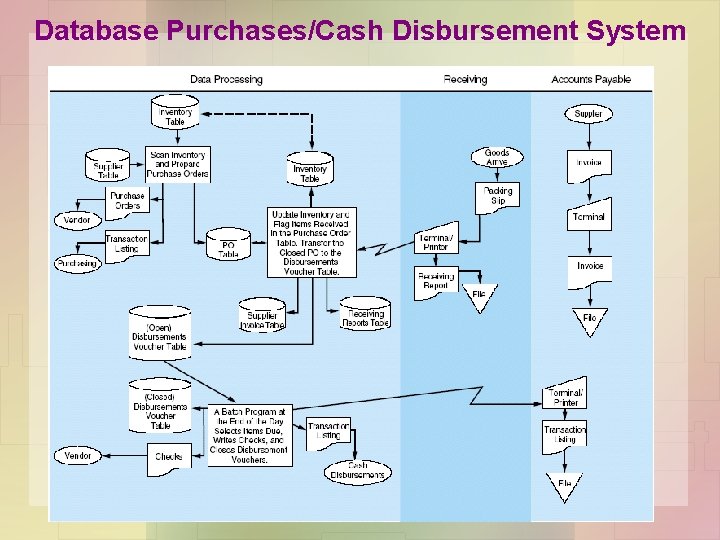
Database Purchases/Cash Disbursement System
Limitations of Transaction-Based Systems • Event: a single business activity within a business process which involves resources and agents • Traditional event-based database systems tend to focus exclusively on economic events. – loss of non-economic/non-financial information • REA is event-oriented versus event-based. – includes non-economic and economic event information
Developing an REA Model: Overview • Before developing the REA model, identify events and classify as: § Operating events--activities that produce goods and services § Information events--activities associated with recording, maintaining, and reporting information § Decision/Management events--activities that lead to decisions being taken • REA model uses only operating events.
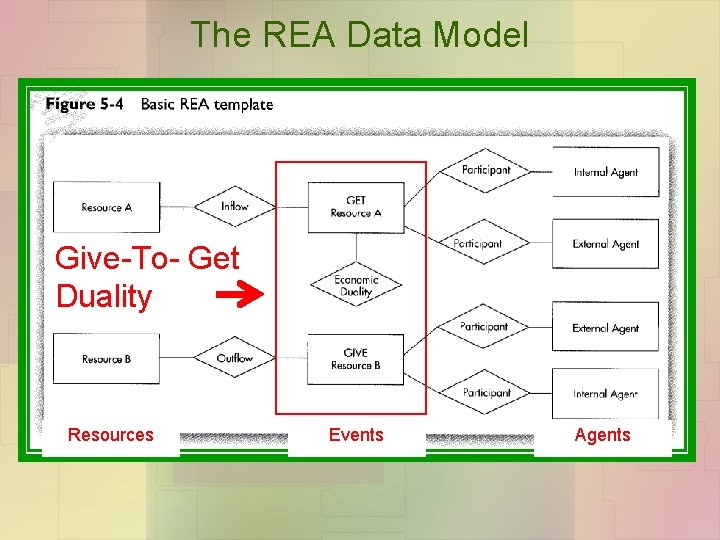
The REA Data Model Give-To- Get Duality Resources Events Agents

The REA Data Model Resources: Those things that have economic value to the firm. Resources Events Agents
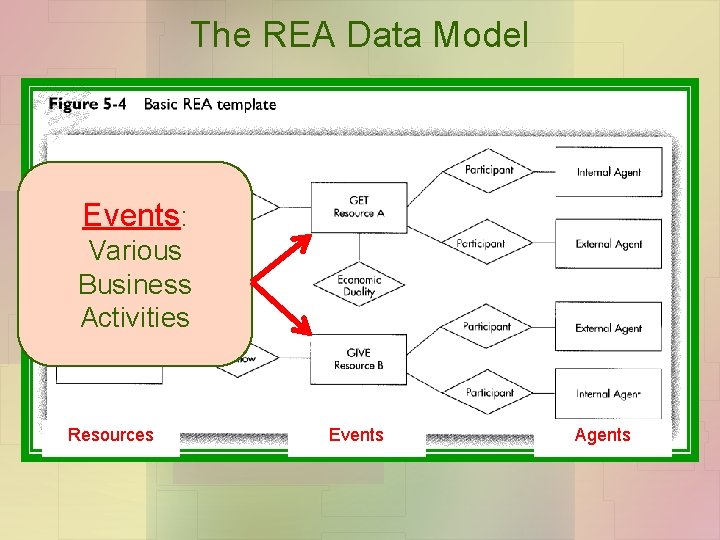
The REA Data Model Events: Various Business Activities Resources Events Agents
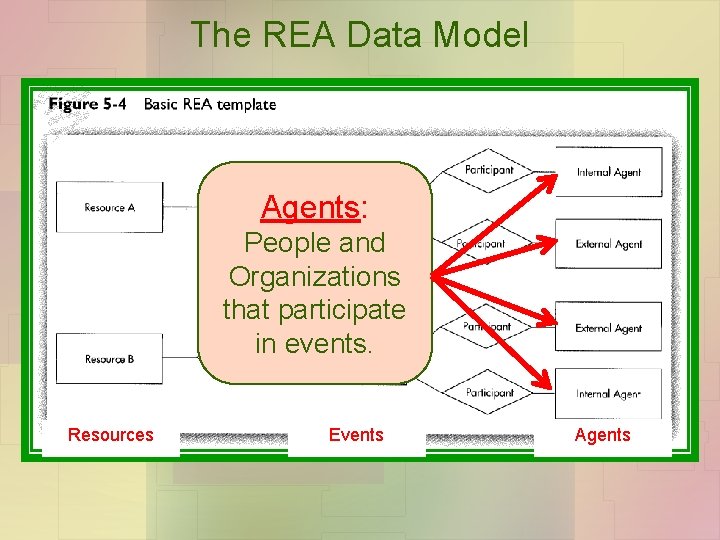
The REA Data Model Agents: People and Organizations that participate in events. Resources Events Agents
Developing an REA Diagram

Step 1: Identify the Economic Exchange Events 1 • Identify the pair of events that reflect the basic economic exchange (give-to-get duality relationship) in that cycle.
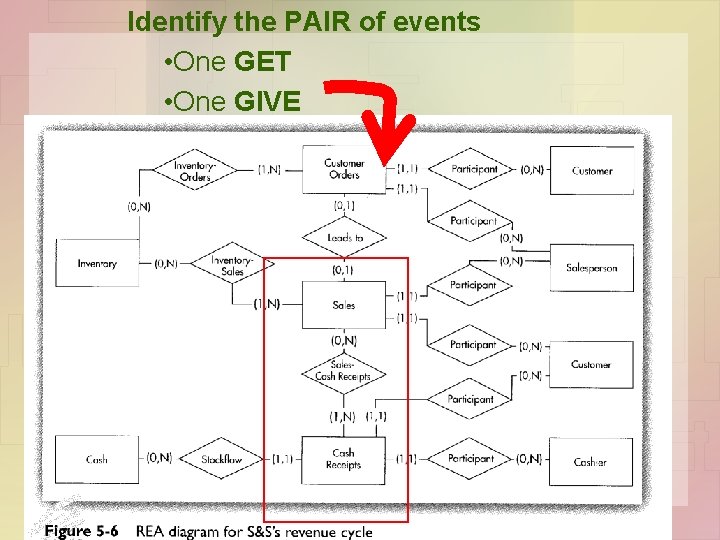
Identify the PAIR of events • One GET • One GIVE
Step 2: Identify Resources and Agents 2 • Identify the Resources affected by each event and the agents who participate in those events.
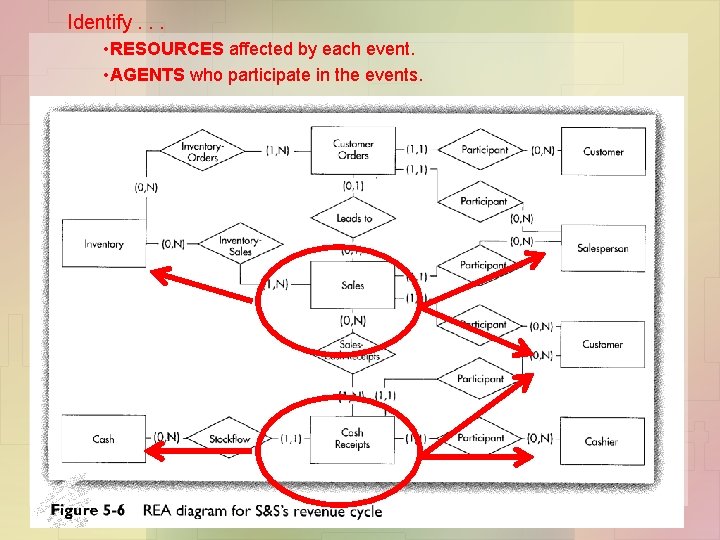
Identify. . . • RESOURCES affected by each event. • AGENTS who participate in the events.

Step 3: Include commitment Events 3 • Analyze each economic exchange event to determine whether it should be decomposed into a combination of one or more commitment events and an economic exchange event.
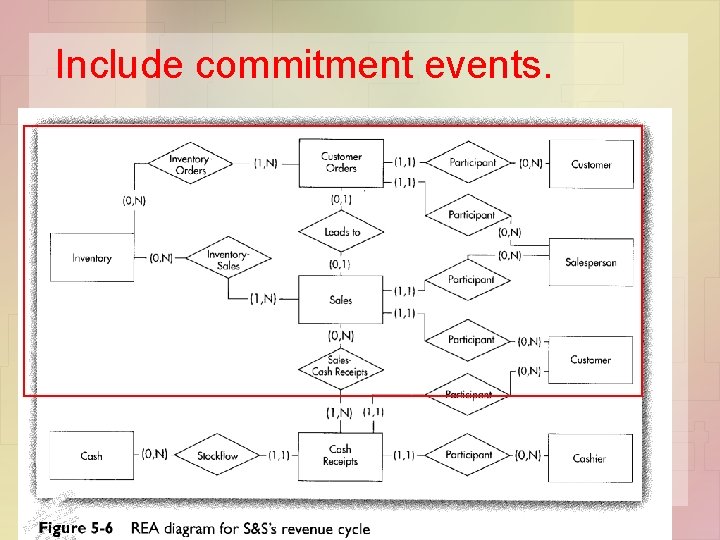
Include commitment events.
Step 4: Determine Cardinalities of Relationships 4 • Determine the cardinalities of each relationship.
Determine cardinalities of relationships.
How many sales transactions can be linked to each individual customer? Sales Customer How many customers can be linked to each individual sales transaction?
Cardinalities Minimum (1, N) Maximum
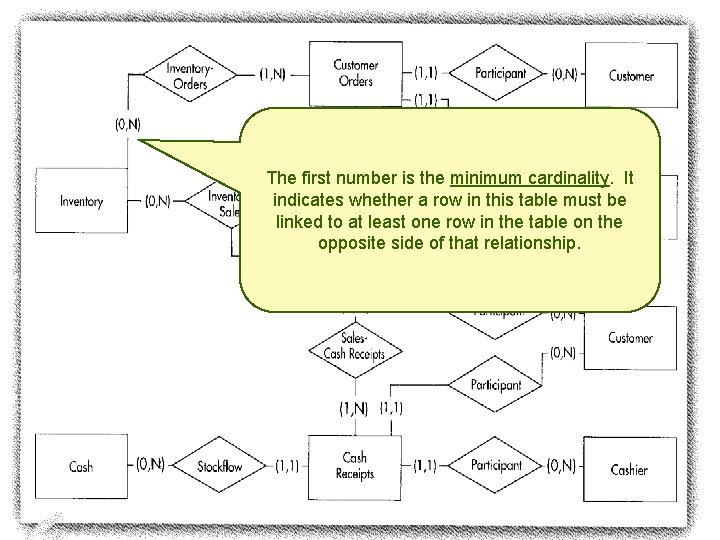
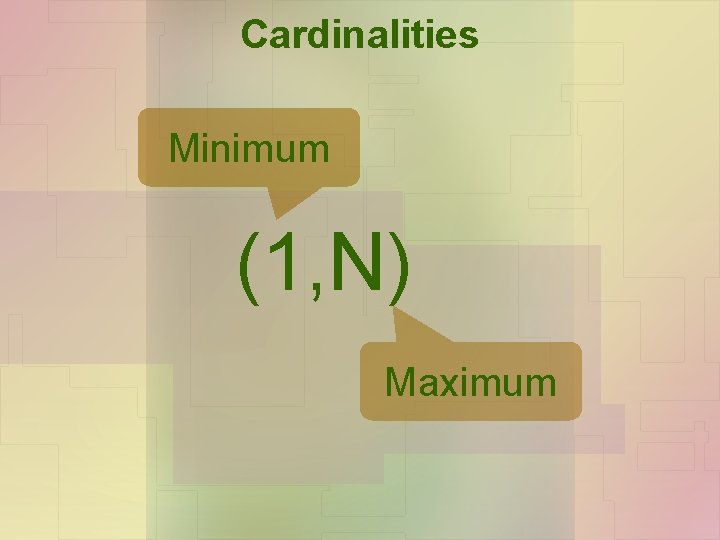
The first number is the minimum cardinality. It indicates whether a row in this table must be linked to at least one row in the table on the opposite side of that relationship.
Minimum Cardinality • The minimum cardinality of a relationship indicates whether each row in that entity MUST be linked to a row in the entity on the other side of the relationship. • Minimum cardinalities can be either 0 or 1.
Minimum Cardinalities • A minimum cardinality of zero means that a new row can be added to that table without being linked to any rows in the other table. • A minimum cardinality of one means that each row in that table MUST be linked to at least one row in the other table
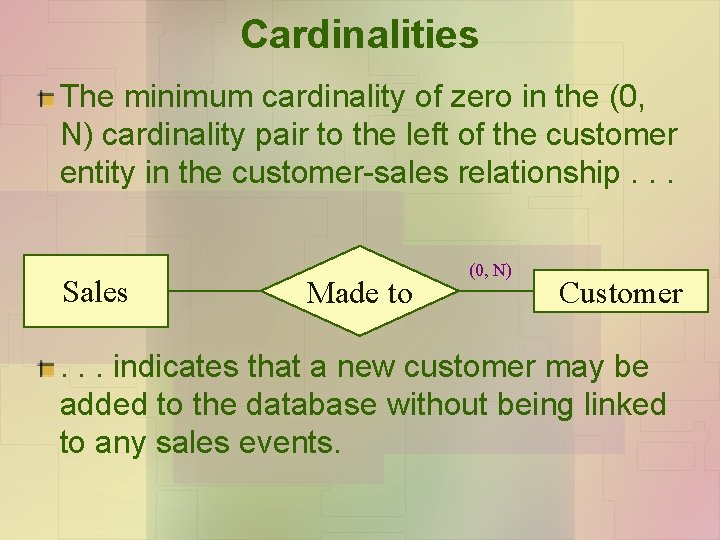
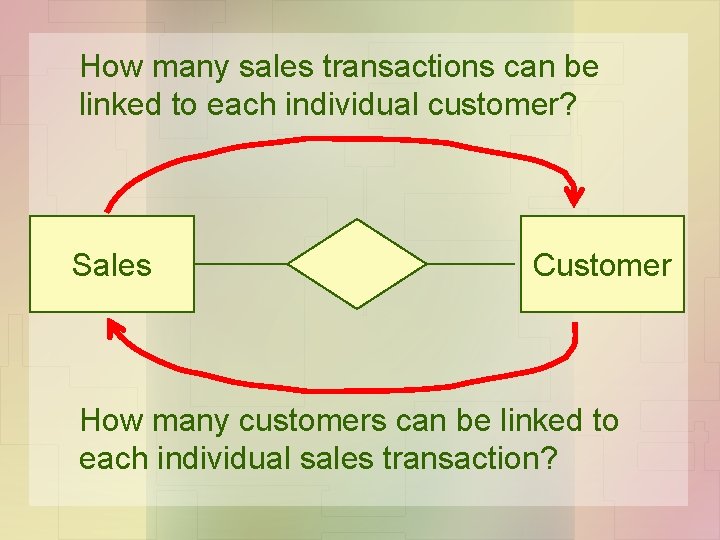
Cardinalities The minimum cardinality of zero in the (0, N) cardinality pair to the left of the customer entity in the customer-sales relationship. . . Sales Made to (0, N) Customer . . . indicates that a new customer may be added to the database without being linked to any sales events.

Cardinalities The minimum cardinality of 1 in the (1, 1) cardinality pair to the right of the sales entity in the customer-sales relationship. . . Sales (1, 1) Made to (0, N) Customer . . . indicates that a new sales transaction CAN ONLY be added if it is linked to a customer.
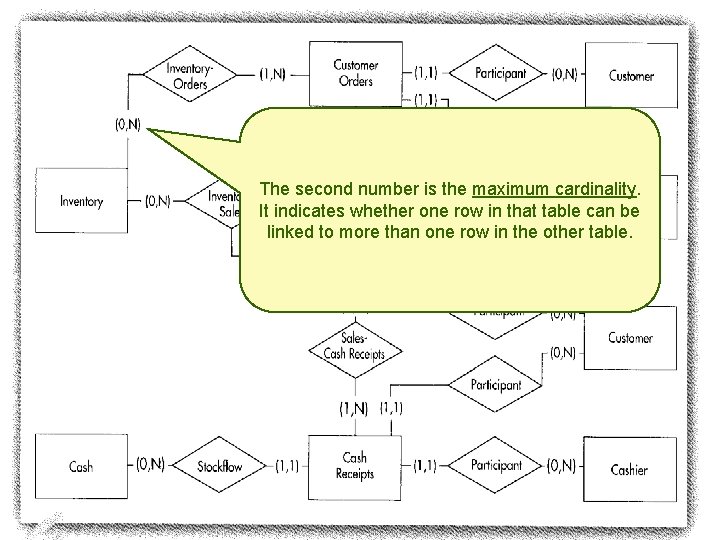
The second number is the maximum cardinality. It indicates whether one row in that table can be linked to more than one row in the other table.
Maximum Cardinalities • The maximum cardinality of a relationship indicates whether each row in that entity CAN be linked to more than one row in the entity on the other side of the relationship. • Maximum cardinalities can be either 1 or N.
Maximum Cardinalities • A maximum cardinality of 1 means that each row in that table can be linked to at most only 1 row in the other table. • A maximum cardinality of N means that each row in that table MAY be linked to more than one row in the other table.
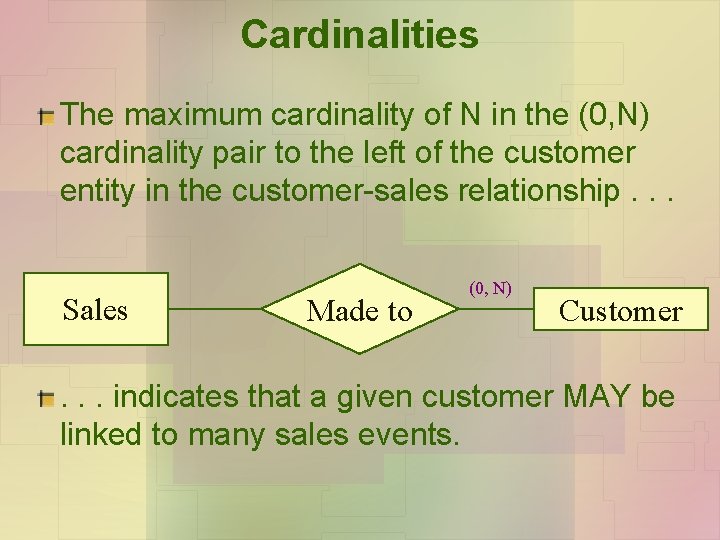
Cardinalities The maximum cardinality of N in the (0, N) cardinality pair to the left of the customer entity in the customer-sales relationship. . . Sales Made to (0, N) Customer . . . indicates that a given customer MAY be linked to many sales events.
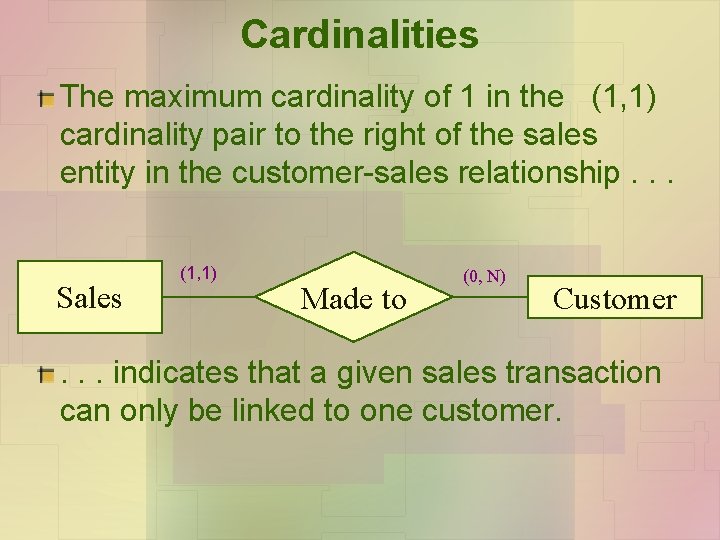
Cardinalities The maximum cardinality of 1 in the (1, 1) cardinality pair to the right of the sales entity in the customer-sales relationship. . . Sales (1, 1) Made to (0, N) Customer . . . indicates that a given sales transaction can only be linked to one customer.
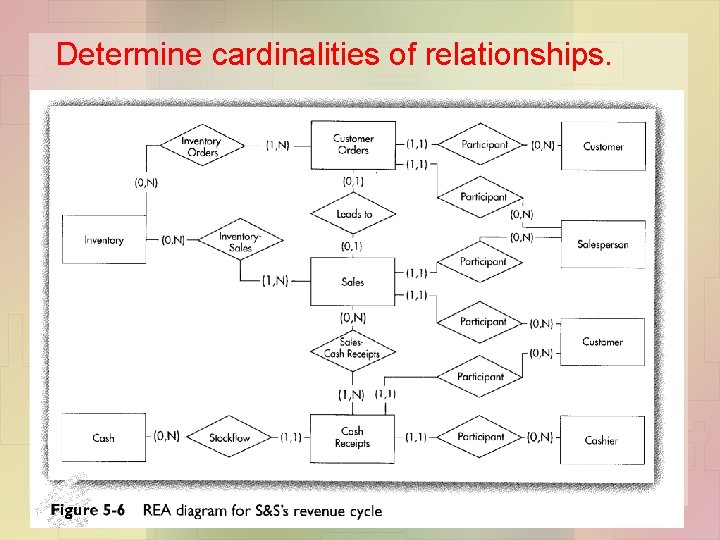
Determine Cardinalities • Cardinalities are not arbitrarily chosen by the database designer. • They reflect facts about the organization being modeled and its business practices obtained during the requirements analysis stage of the database design process.

Cardinalities: Types of Relationships • Three basic types - depending on the maximum cardinality associated with each entity. – A one-to-one relationship (1: 1) – A one-to-many relationship (1: N) – A many-to-many relationship (M: N)
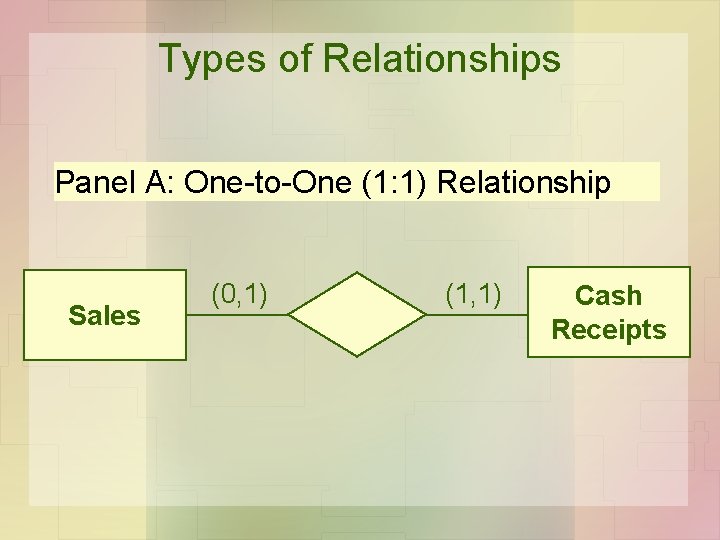
Types of Relationships Panel A: One-to-One (1: 1) Relationship Sales (0, 1) (1, 1) Cash Receipts
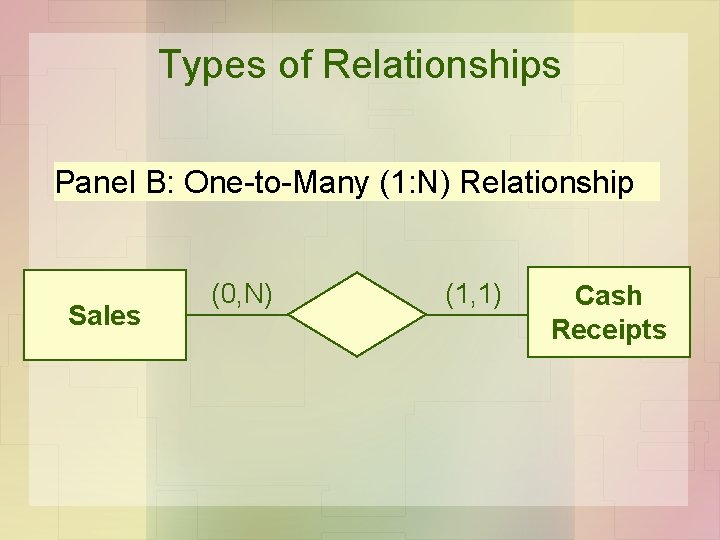
Types of Relationships Panel B: One-to-Many (1: N) Relationship Sales (0, N) (1, 1) Cash Receipts
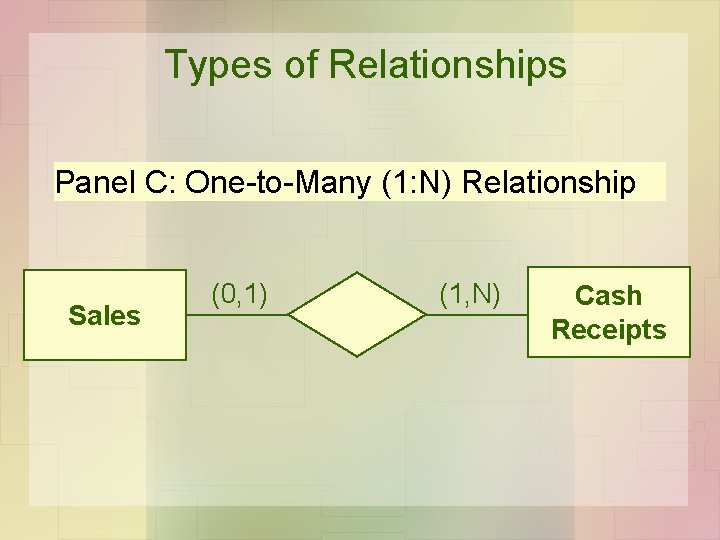
Types of Relationships Panel C: One-to-Many (1: N) Relationship Sales (0, 1) (1, N) Cash Receipts
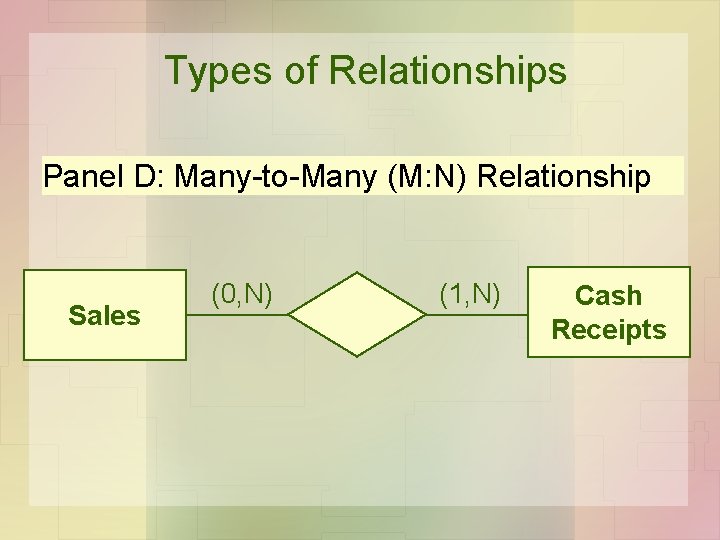
Types of Relationships Panel D: Many-to-Many (M: N) Relationship Sales (0, N) (1, N) Cash Receipts
Build a Set of Tables to Implement an REA Model of an AIS in a Relational Database
Implementing an REA Diagram in a Relational Database • An REA diagram can be used to design a well-structured relational database. • A well-structured relational database is one that is not subject to update, insert, and delete anomaly problems.

Three Step Process • Create a table for each distinct entity and for each many-to many relationship • Assign attributes to appropriate tables • Use foreign keys to implement one-to-one and one-to-many relationships
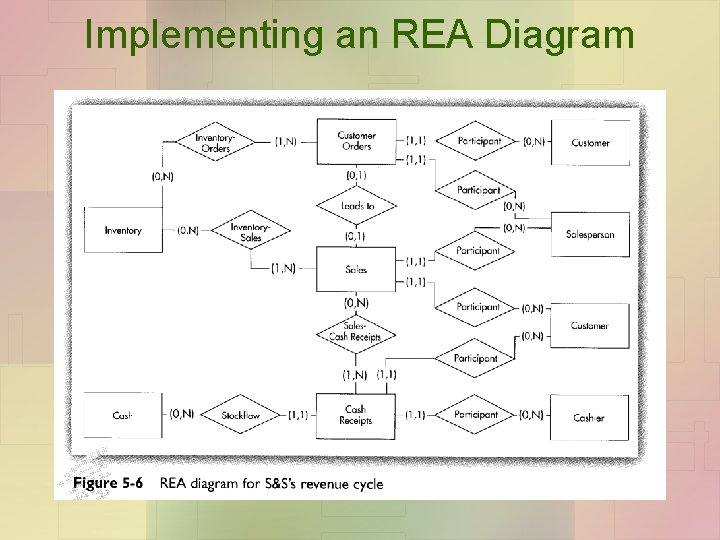
Implementing an REA Diagram
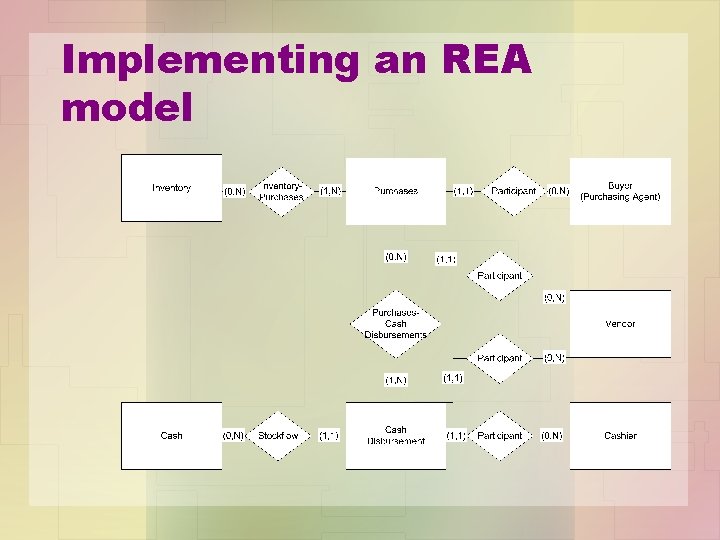
Implementing an REA model
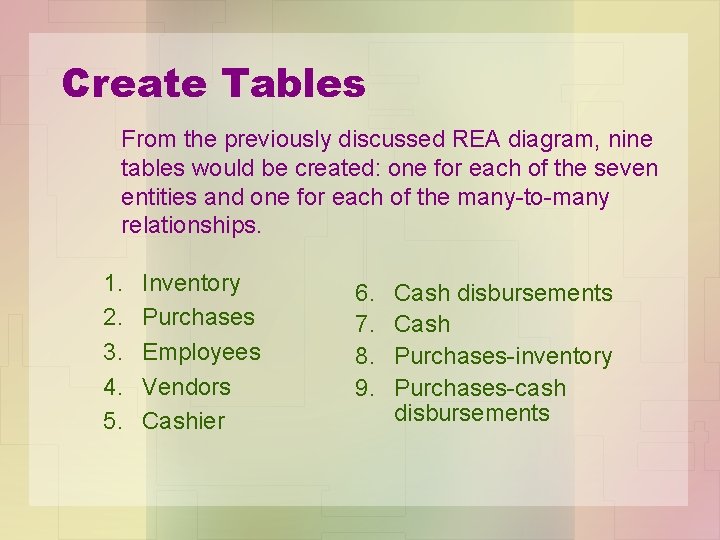
Create Tables From the previously discussed REA diagram, nine tables would be created: one for each of the seven entities and one for each of the many-to-many relationships. 1. 2. 3. 4. 5. Inventory Purchases Employees Vendors Cashier 6. 7. 8. 9. Cash disbursements Cash Purchases-inventory Purchases-cash disbursements
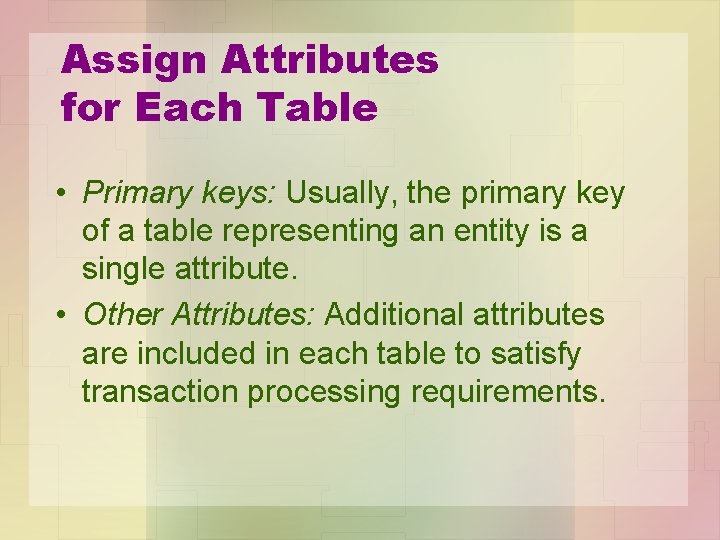
Assign Attributes for Each Table • Primary keys: Usually, the primary key of a table representing an entity is a single attribute. • Other Attributes: Additional attributes are included in each table to satisfy transaction processing requirements.
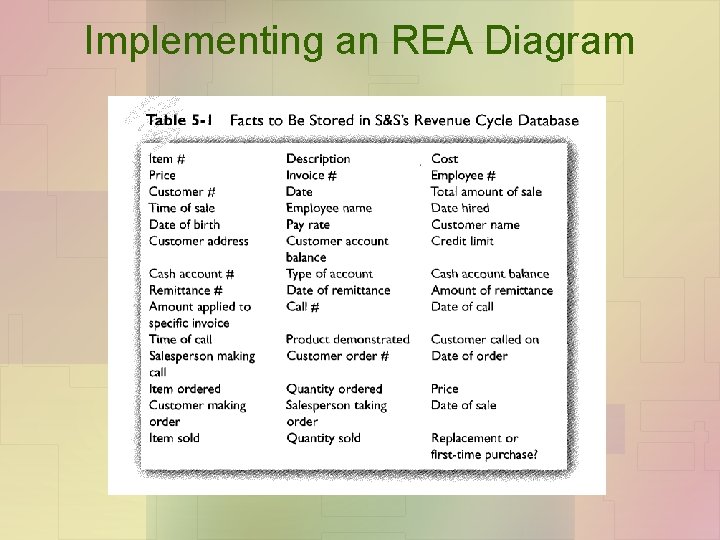
Implementing an REA Diagram
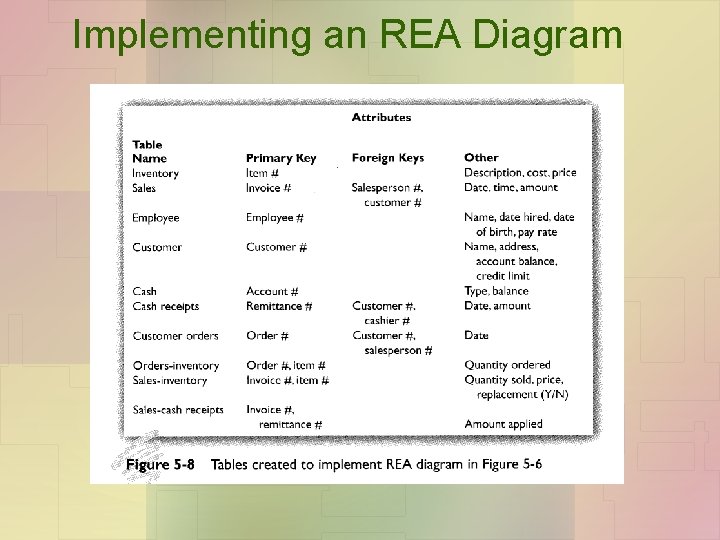
Implementing an REA Diagram

Documentation of Business Practices • REA diagrams are especially useful for documenting an advanced AIS built using databases. • REA diagrams provide information about the organization’s business practices
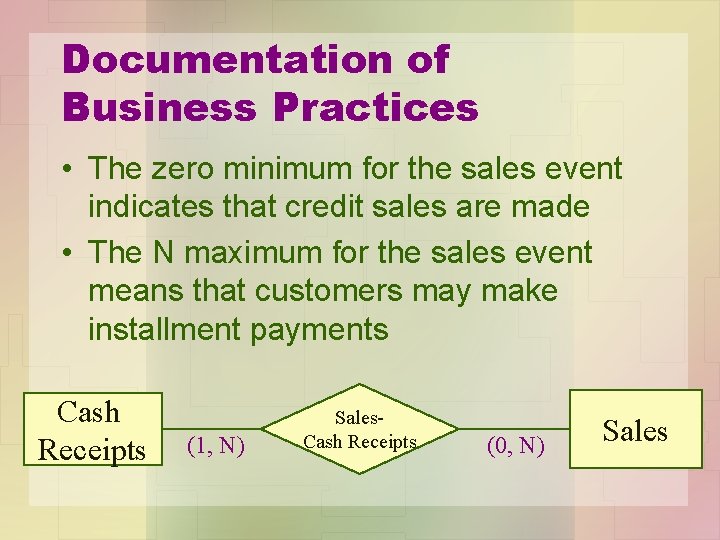
Documentation of Business Practices • The zero minimum for the sales event indicates that credit sales are made • The N maximum for the sales event means that customers may make installment payments Cash Receipts (1, N) Sales. Cash Receipts (0, N) Sales
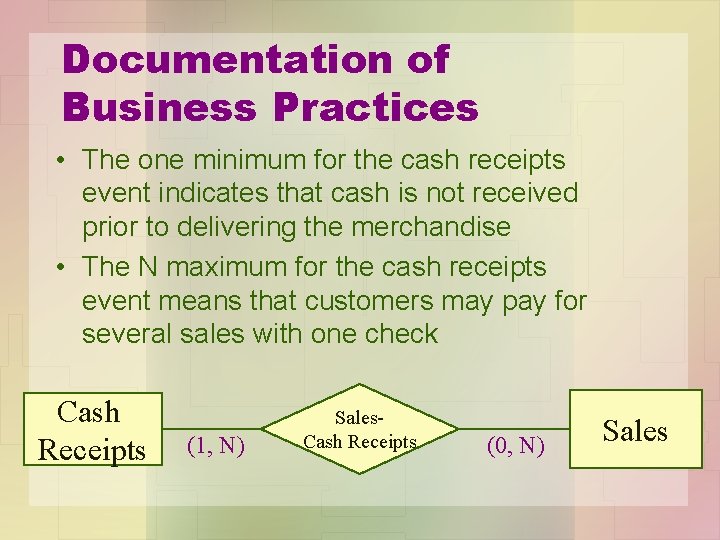
Documentation of Business Practices • The one minimum for the cash receipts event indicates that cash is not received prior to delivering the merchandise • The N maximum for the cash receipts event means that customers may pay for several sales with one check Cash Receipts (1, N) Sales. Cash Receipts (0, N) Sales
Extracting Information From the AIS • A complete REA diagram serves as a useful guide for querying an AIS database. • Queries can be used to generate journals and ledgers from a relational database built on the REA model.
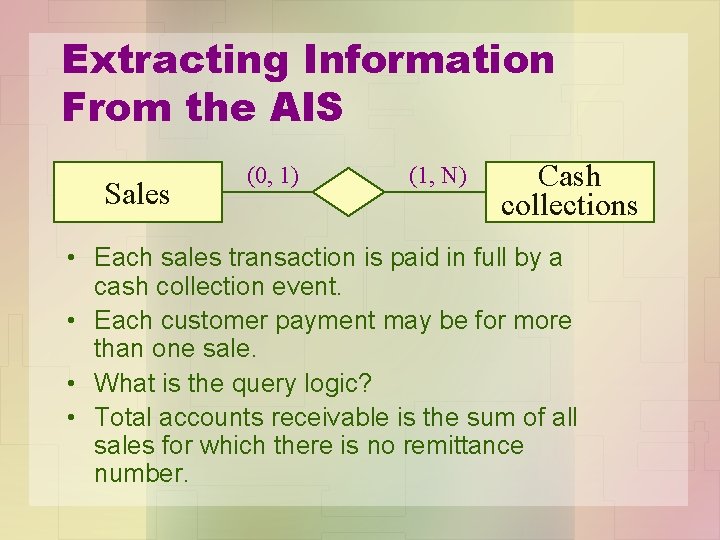
Extracting Information From the AIS Sales (0, 1) (1, N) Cash collections • Each sales transaction is paid in full by a cash collection event. • Each customer payment may be for more than one sale. • What is the query logic? • Total accounts receivable is the sum of all sales for which there is no remittance number.
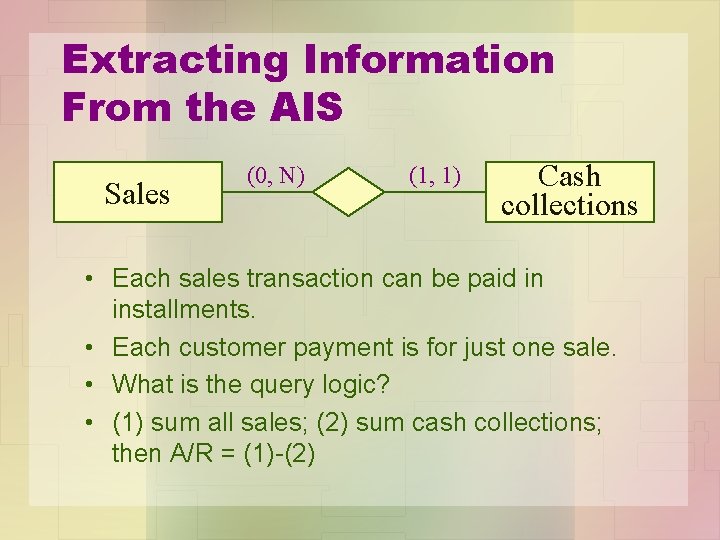
Extracting Information From the AIS Sales (0, N) (1, 1) Cash collections • Each sales transaction can be paid in installments. • Each customer payment is for just one sale. • What is the query logic? • (1) sum all sales; (2) sum cash collections; then A/R = (1)-(2)
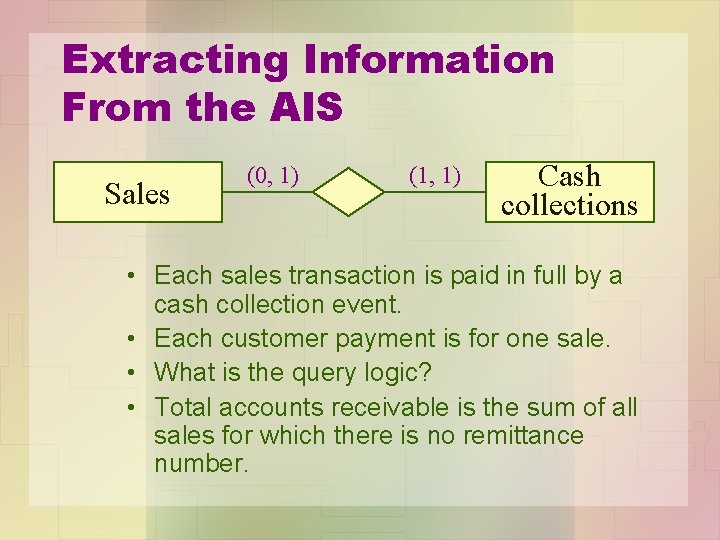
Extracting Information From the AIS Sales (0, 1) (1, 1) Cash collections • Each sales transaction is paid in full by a cash collection event. • Each customer payment is for one sale. • What is the query logic? • Total accounts receivable is the sum of all sales for which there is no remittance number.
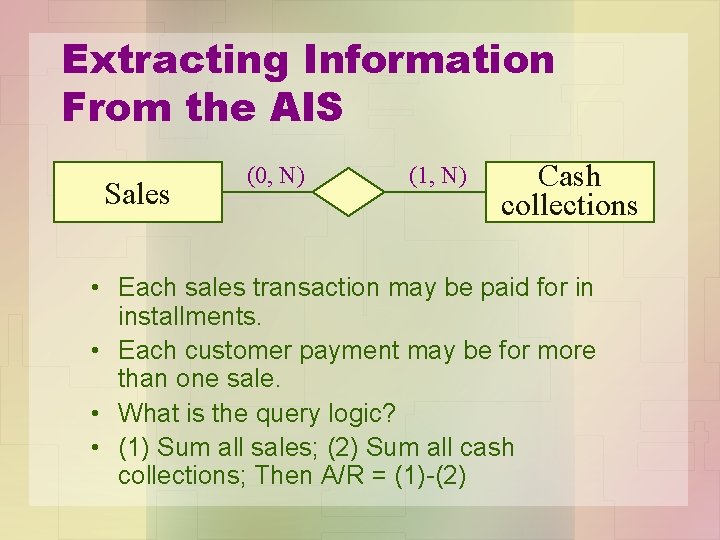
Extracting Information From the AIS Sales (0, N) (1, N) Cash collections • Each sales transaction may be paid for in installments. • Each customer payment may be for more than one sale. • What is the query logic? • (1) Sum all sales; (2) Sum all cash collections; Then A/R = (1)-(2)

Let’s Review with a Little Help From My Friends ….
An REA Model of an Economic Exchange William E. Mc. Carthy* Michigan State University (These slides may be copied as long as original source is cited) *http: //www. msu. edu/user/mccarth 4/
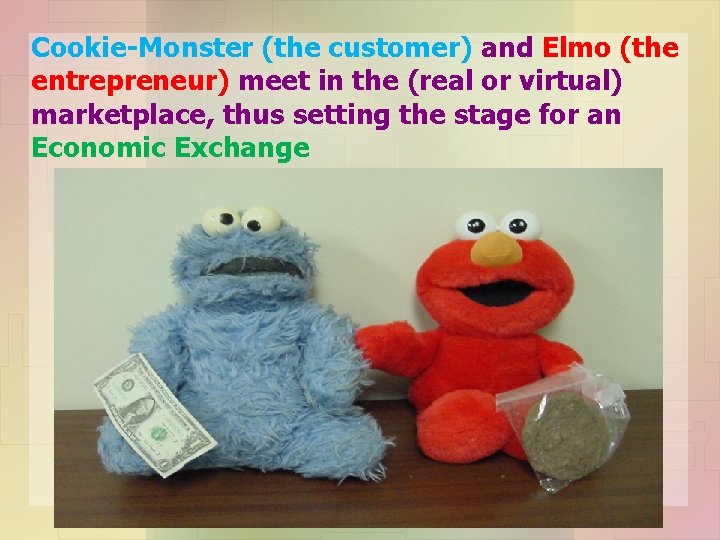
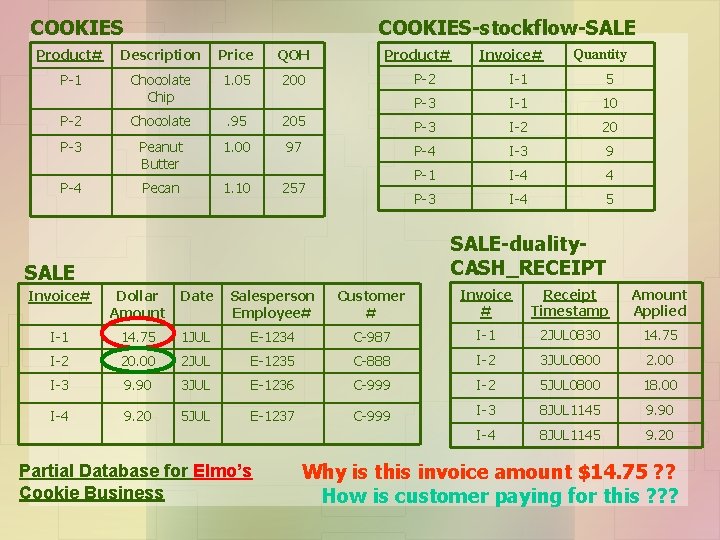
Cookie-Monster (the customer) and Elmo (the entrepreneur) meet in the (real or virtual) marketplace, thus setting the stage for an Economic Exchange
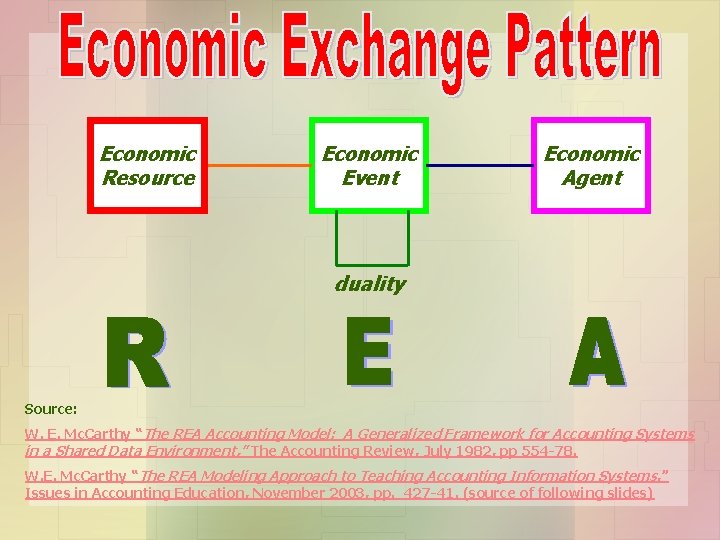
Economic Resource Economic Event Economic Agent duality Source: W. E. Mc. Carthy “The REA Accounting Model: A Generalized Framework for Accounting Systems in a Shared Data Environment, ” The Accounting Review, July 1982, pp 554 -78. W. E. Mc. Carthy “The REA Modeling Approach to Teaching Accounting Information Systems , ” Issues in Accounting Education, November 2003, pp. 427 -41. (source of following slides)
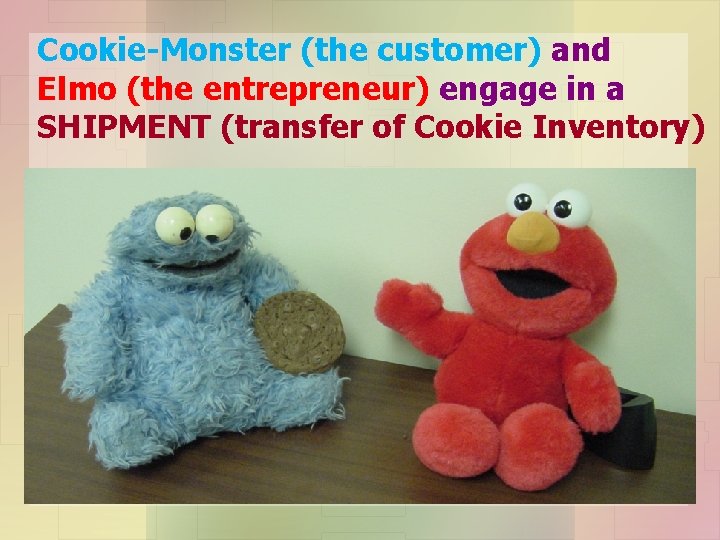
Cookie-Monster (the customer) and Elmo (the entrepreneur) engage in a SHIPMENT (transfer of Cookie Inventory)

Economic Resource inside participation Economic Agent Economic Event stock-flow Economic Agent Give Take outside participation duality outside participation Economic Agent Economic Event stock-flow Economic Resource inside participation Economic Agent REA model of cookie sale from entrepreneur’s (ELMO) perspective
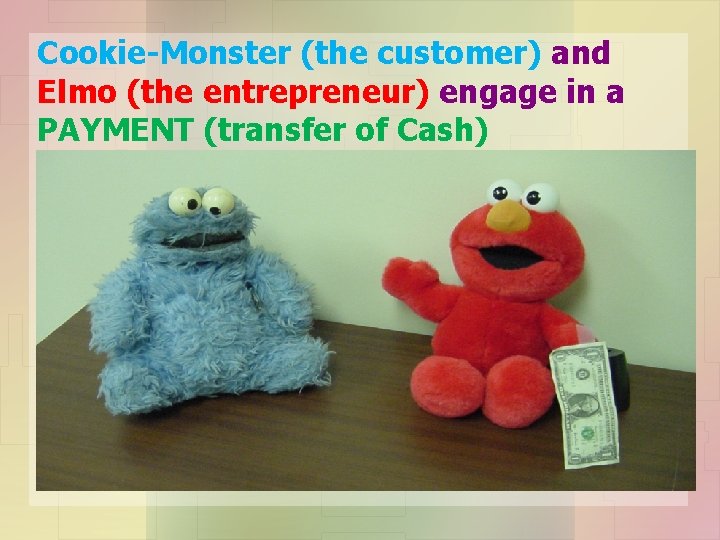
Cookie-Monster (the customer) and Elmo (the entrepreneur) engage in a PAYMENT (transfer of Cash)
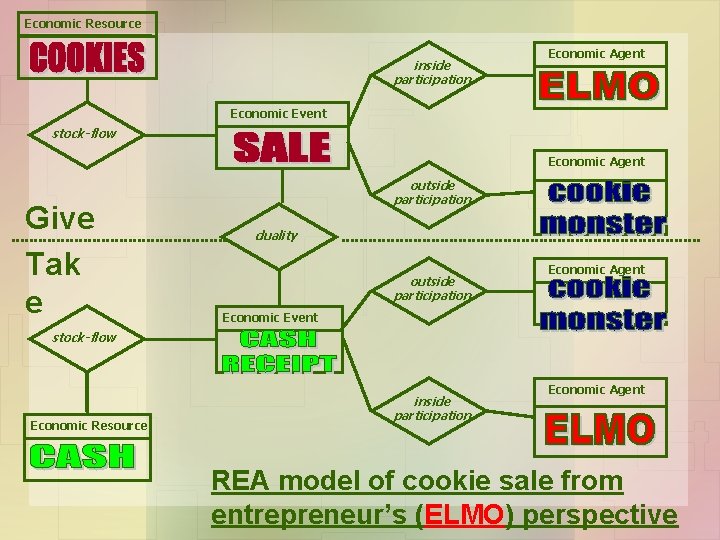
Economic Resource inside participation Economic Agent Economic Event stock-flow Economic Agent Give Tak e outside participation duality outside participation Economic Agent Economic Event stock-flow Economic Resource inside participation Economic Agent REA model of cookie sale from entrepreneur’s (ELMO) perspective
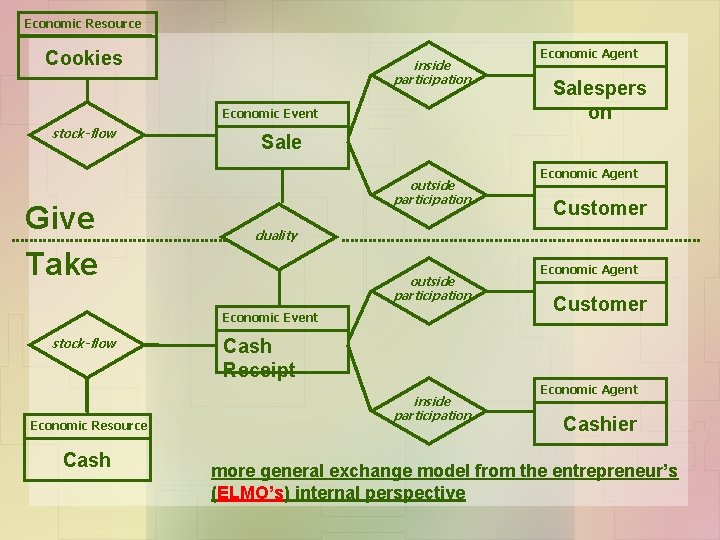
Economic Resource Cookies inside participation Economic Event stock-flow Give Take Economic Resource Cash Salespers on Sale outside participation Economic Agent Customer duality outside participation Economic Event stock-flow Economic Agent Customer Cash Receipt inside participation Economic Agent Cashier more general exchange model from the entrepreneur’s (ELMO’s) internal perspective
COOKIES-stockflow-SALE Product# Description Price QOH P-1 Chocolate Chip 1. 05 200 P-2 Chocolate . 95 P-3 Peanut Butter 1. 00 Pecan 1. 10 P-4 Product# Invoice# Quantity P-2 I-1 5 P-3 I-1 10 205 P-3 I-2 20 97 P-4 I-3 9 P-1 I-4 4 P-3 I-4 5 257 SALE-duality. CASH_RECEIPT SALE Invoice# Dollar Amount Date Salesperson Employee# Customer # Invoice # Receipt Timestamp Amount Applied I-1 14. 75 1 JUL E-1234 C-987 I-1 2 JUL 0830 14. 75 I-2 20. 00 2 JUL E-1235 C-888 I-2 3 JUL 0800 2. 00 I-3 9. 90 3 JUL E-1236 C-999 I-2 5 JUL 0800 18. 00 I-4 9. 20 5 JUL E-1237 C-999 I-3 8 JUL 1145 9. 90 I-4 8 JUL 1145 9. 20 Partial Database for Elmo’s Cookie Business Why is this invoice amount $14. 75 ? ? How is customer paying for this ? ? ?
A business process is a set of activities that takes one or more kinds of input and creates an output that is of greater value to the customer (Hammer and Champy) business process labor cash Acquisition Cycle cookie ingredients cash Conversion Cycle cookies Revenue Cycle value chain A value chain is a purposeful network of business processes aimed at assembling the individual components of a final product (i. e. , its portfolio of attributes) of value to the customer (Porter and Geerts/Mc. Carthy) Part of ELMO’s Value Chain for Providing Cookies
Semantic infrastructure of system matches extended REA pattern Enterprise Systems classification structure is from David, Mc. Carthy & Sommer, Communications of the ACM , May 2003, pp. 65 -9.
Different perspectives on REA modeling needed for enterprise modeling (value chains) and collaboration space (supply chains) • Enterprise modeling (as evidenced in normal ERP systems) is done from the perspective of one company or entrepreneur. Business processes are viewed as components of a single value chain. A single exchange (like the sale of a product for money) would be modeled twice, once in the enterprise system of each trading partner. • Collaboration space modeling (as evidenced in eb. XML or ISO Open-edi) is done from a perspective independent of each trading partner. A single exchange is modeled once in independent terms that can be then mapped into internal enterprise system components. Supply chains are networks of business processes that alternate internal transformations and external exchanges (definition due to Bob Haugen). • REA modeling works in both cases and the independent to trading partner mapping is absolutely straightforward and completely defined.
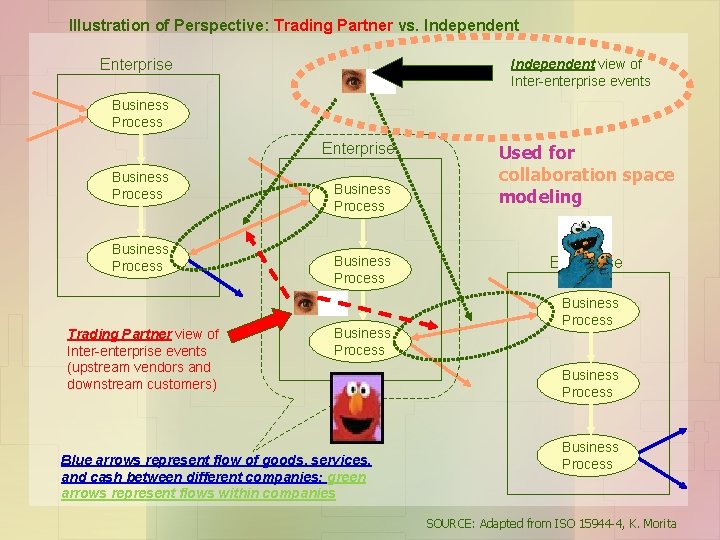
Illustration of Perspective: Trading Partner vs. Independent Enterprise Independent view of Inter-enterprise events Business Process Enterprise Business Process Trading Partner view of Inter-enterprise events (upstream vendors and downstream customers) Business Process Blue arrows represent flow of goods, services, and cash between different companies; green arrows represent flows within companies Used for collaboration space modeling Enterprise Business Process SOURCE: Adapted from ISO 15944 -4, K. Morita
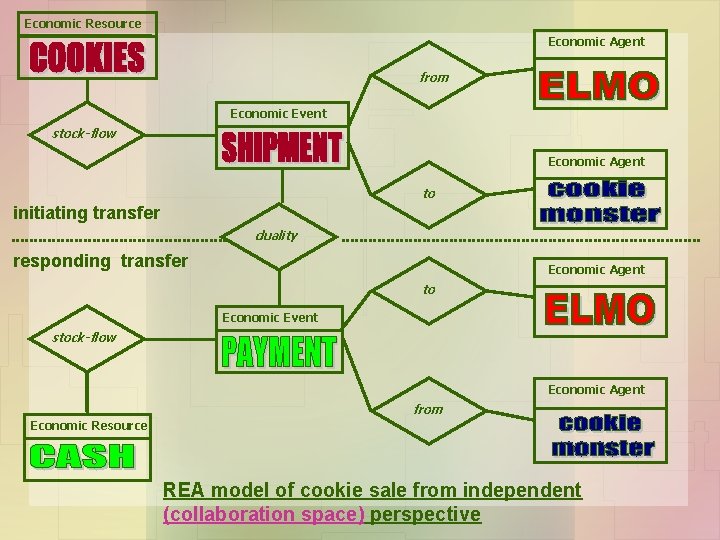
Economic Resource Economic Agent from Economic Event stock-flow Economic Agent to initiating transfer duality responding transfer Economic Agent to Economic Event stock-flow Economic Agent from Economic Resource REA model of cookie sale from independent (collaboration space) perspective
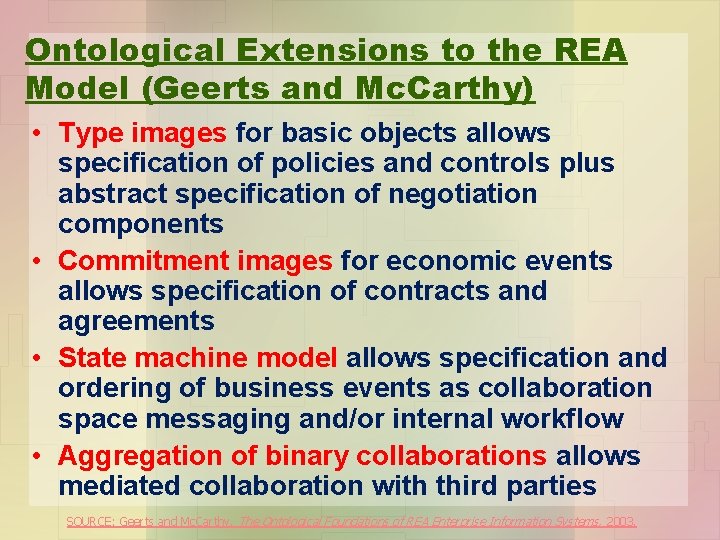
Ontological Extensions to the REA Model (Geerts and Mc. Carthy) • Type images for basic objects allows specification of policies and controls plus abstract specification of negotiation components • Commitment images for economic events allows specification of contracts and agreements • State machine model allows specification and ordering of business events as collaboration space messaging and/or internal workflow • Aggregation of binary collaborations allows mediated collaboration with third parties SOURCE: Geerts and Mc. Carthy, The Ontological Foundations of REA Enterprise Information Systems, 2003.
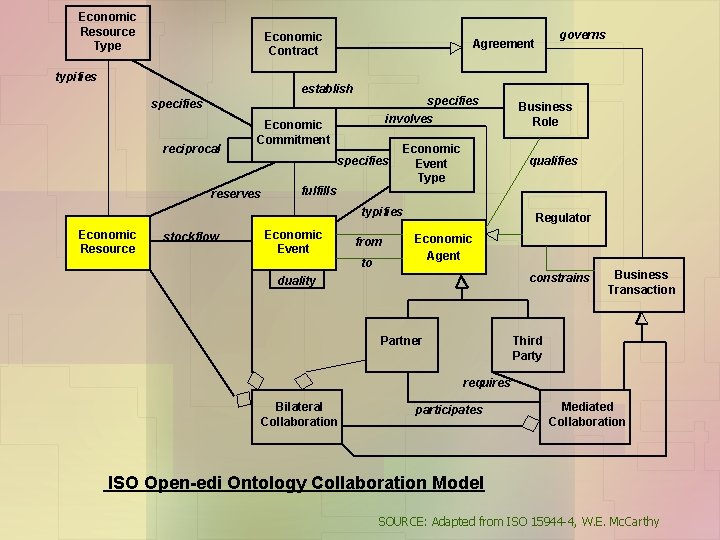
Economic Resource Type Economic Contract typifies establish specifies involves specifies reciprocal Economic Commitment reserves specifies fulfills Economic Event Type stockflow Economic Event from to Business Role qualifies typifies Economic Resource governs Agreement Regulator Economic Agent constrains duality Business Transaction Third Party Partner requires Bilateral Collaboration participates Mediated Collaboration ISO Open-edi Ontology Collaboration Model SOURCE: Adapted from ISO 15944 -4, W. E. Mc. Carthy
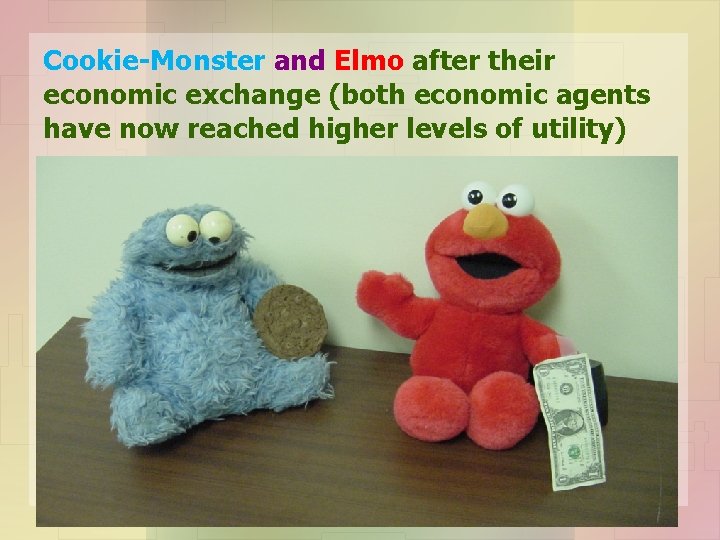
Cookie-Monster and Elmo after their economic exchange (both economic agents have now reached higher levels of utility)
Cookie Monster and Elmo are of course characters from the Public Broadcasting Service TV show Sesame Street*. Their use here is only illustrative. Cookie Monster is a great example of a typical buyer (has money, wants goods) because he is most happy when he has a cookie to eat. The use of Elmo as a typical seller (has goods, wants money) is only a convenient illustration. * see http: //www. sesameworkshop. org
Online resources: • AIS Romney 2006 notes Chapter 15 Database Design Using the REA • AIS Romney 2006 notes Chapter 16 Implementing an REA
- Slides: 94