The Q Factor A Comparison Between Chirped Pulse

The Q Factor: A Comparison Between Chirped Pulse and Cavity Fourier Transform Microwave Techniques Kevin O. Douglass, Gordon G. Brown, Brian C. Dian, Scott Geyer, Brooks H. Pate University of Virginia Department of Chemistry

Balle-Flygare Microwave Spectrometer Mini-FTMW in coaxial geometry T. J. Balle and W. H. Flygare, Rev. Sci. Instrum. 52, 33 (1981). R. D. Suenram, J. U. Grabow, A. Zuban, and I. Leonov, Rev. Sci. Instrum. 70, 2127 (1999) Broadband Microwave Spectrometer
 Frequency Accuracy and")
Performance Issues for Chirped Pulse FTMW Spectrometer I. Experimental performance 1) Frequency Accuracy and Measurement Precision 2) Relative Intensity Accuracy and Dynamic Range II. Comparisons to the cavity machine 1) Sensitivity for optimally polarized samples 2) Sensitivity for small dipole measurements (polarization efficiency)

Balle-Flygare Microwave Spectrometer Advantages: Disadvantages: • limited bandwidth • Theoretical √Q S/N gain FWHM 0. 814 MHz • Slow scan speed!! 18 13 34 • 4. 5: 1 signal to noise on O C S* Q ~104 ▪ 14 hours/ 11 GHz • 0. 000094% (5000 shots) • Difficult to obtain • Requires sub-m. W MW power for accurate intensities most molecules (m ~ 0. 1 D) • Miss weak lines not directly under cavity mode T. J. Balle and W. H. Flygare, Rev. Sci. Instrum. 52, 33 (1981). *R. D. Suenram, J. U. Grabow, A. Zuban, and I. Leonov, Rev. Sci. Instrum. 70, 2127 (1999)

Broadband Chamber Design Double ridge waveguide horns replace the narrow band cavity • Allows for broadband transmission and detection • 7. 5 – 18 GHz (with no moving parts) • Q≈1, theoretical 10, 000 averages are needed to compensate for the factor of (Q)1/2 loss in S/N (Survey scan in cavity FTMW typically uses 10 shots, therefore expect 100, 000 shots required for broadband spectrometer to compensate for cavity Q-gain)
 Frequency accuracy and")
Performance Issues for Chirped Pulse FTMW Spectrometer I. Experimental performance 1) Frequency accuracy and Measurement Precision 1. 2. Frequency reference is Rb-disciplined 10 MHz oscillator (SRS FS 725) For 20 ms FID acquisition with required digital signal processing the instrumental linewidth is 80 k. Hz 2) Relative Intensity Accuracy and Dynamic Range 1. Achieve large dynamic range through signal averaging using a 40 Gs/s 8 -bit digitizer and typically 10, 000 averages of the FID in the time domain II. Comparisons to the cavity machine 1) Sensitivity for optimally polarized samples 2) Sensitivity for small dipole measurements

Digital Signal Processing of the Lineshape in Broadband CP-FTMW Spectroscopy Cyclopropylacetylene 202 -101 13108. 39 MHz

60 x zoom Horizontal Dynamic Range Digital Filtering Rectangular Hamming Side lobe Suppression (d. B) Rec. 13 Hamm. 43 Kais. -Bes. 69 Tek Exp 67 Kaiser-Bessel Tek-exp Resolution Bandwidth (k. Hz) Rec. 44. 5 Hamm. 65 Kais. -Bes. 86 Tek Exp 71

OCS: Broadband Frequency Accuracy Noise Limit 10000 avg: pk-pk: ~ 850 n. V RMS: ~ 550 n. V Signal-to-Noise 10000 avg: pk-pk: ~ 91000: 1 RMS: ~ 140000: 1 This is real data!

OCS: Broadband Frequency Accuracy This is real data! Data Fit
 NIST Freq. (MHz) BB-NIST (k. Hz) OCS")
OCS: Natural Abundance Measurements BB Freq. (MHz) NIST Freq. (MHz) BB-NIST (k. Hz) OCS 12162. 9778 12162. 9790 OC 34 S 11865. 6638 O 13 CS 12123. 8458 Isotope F'<--F" OC 33 S exp. Nat. Abundance Lit. Nat. abundance % error -1. 2000 93. 74 --- 11865. 6628 1. 0000 4. 35373 4. 158 4. 70 12123. 8420 3. 8000 0. 96362 1. 053 -8. 48 0. 6804 0. 7399 -8. 04 12009. 824* 3/2<--3/2 12004. 0038 12004. 0029 0. 9000 0. 22607 0. 24 -5. 80 5/2<--3/2 12011. 2858 12011. 2849 0. 9000 0. 32848 0. 37 -11. 22 1/2<--3/2 12017. 1058 12017. 1050 0. 8000 0. 12583 0. 13 -3. 20 18 OCS 11409. 7097 0. 0000 0. 1808 0. 188 -3. 82 O 13 C 34 S 11823. 4638 11823. 4625 1. 3000 0. 03867 0. 04672 -17. 22 0. 0311 0. 03495 -11. 01 17 OCS 11767. 3346* 5/2<--5/2 11767. 1338 11767. 1315 2. 3000 0. 00991 0. 012 -17. 39 7/2<--5/2 11767. 4058 11767. 4015 4. 3000 0. 01342 0. 015 -10. 53 3/2<--5/2 11767. 5398 11767. 5330 6. 8000 0. 00777 0. 008 -2. 92 OC 36 S 11599. 3858 11599. 3816 4. 2000 0. 01533 0. 0167 -8. 21 18 OC 34 S 11119. 9337 11119. 9346 -0. 9000 0. 00966 0. 00834 15. 83 0. 00714 0. 00831 -14. 07 O 13 C 33 S 18 O 13 CS 11969. 1284* 3/2<--3/2 11963. 3078 11963. 3002 7. 6000 0. 00246 0. 00274 -10. 09 5/2<--3/2 11970. 6078 11970. 5845 23. 3000 0. 00318 0. 00416 -23. 58 1/2<--3/2 11976. 4160 11976. 4055 10. 5000 0. 0015 0. 00141 6. 11 11382. 1237 11382. 1280 -4. 3000 0. 00211 -5. 17 Abs avgs dev. 2. 67 k. Hz abs avg. percent error 9. 87
 Frequency Accuracy and")
Performance Issues for Chirped Pulse FTMW Spectrometer I. Experimental performance 1) Frequency Accuracy and Measurement Precision 2) Relative Intensity Accuracy and Dynamic Range II. Comparisons to our NIST-design cavity mini. FTMW machine 1) Sensitivity for optimally polarized samples 1. Power build up of molecular emission 1. 2) Heterodyne detect E field 1. Signal is √Q enhanced Sensitivity for small dipole measurements (polarization efficiency) 1. Q enhancement of input power
 (10 Shots) Frequency Resolution at")
Sensitivity Comparison Broadband vs. Cavity Machine (10, 000 shots) (10 Shots) Frequency Resolution at Baseline Equivalent in the Two Spectrometers Cyclopropanecarboxaldehyde For 11 GHz Spectrum: CP-FTMW: 10, 000 valve pulses Cavity FTMW: 220, 000 valve pulses 13 C-3 13 C-2 13 C-1
 (10 Shots) Cyclopropanecarboxaldehyde 13 C-3")
Sensitivity Comparison Broadband vs. Cavity Machine (10, 000 shots) (10 Shots) Cyclopropanecarboxaldehyde 13 C-3 13 C-2 13 C-1
 (10 Shots) Cyclopropanecarboxaldehyde Cavity")
Vertical Dynamic Range Broadband vs. Cavity Machine (10, 000 shots) (10 Shots) Cyclopropanecarboxaldehyde Cavity Machine Limited by 8 -bit Digitizer
 (10 Shots) Cavity Machine")
Vertical Dynamic Range Broadband vs. Cavity Machine (10, 000 shots) (10 Shots) Cavity Machine Limited by 8 -bit Digitizer Cyclopropanecarboxaldehyde
 (10 Shots) Cavity step size 100")
Suprane Broadband vs. Cavity Machine (10, 000 shots) (10 Shots) Cavity step size 100 k. Hz Cavity noise scaled to BB noise
 Measureme nt Range (GHz) Broadband Scan")
Time comparison (for equal sensitivity and optimal polarization) Measureme nt Range (GHz) Broadband Scan Rate (GHz/min) Cavity Scan Rate (GHz/min) Speed improvement factor 0. 0125 11 0. 2 19. 6 4 0. 1 7. 1 1 0. 022 1. 8 0. 75 0. 017 1. 3 0. 5 0. 011 0. 9 For detection of optimally polarized sample, the effective sensitivity of broadband FTMW spectroscopy surpasses cavity FTMW spectroscopy for bandwidths exceeding 500 MHz! Comparison Based on: Broadband machine: 10, 000 avgs. In 45 min. Cavity machine: 14. 6 Hours for 11 GHz

Example Measurement of low dipole moment • C-type transition for suprane (mc =0. 24 D ) Cavity 10 averages 210: 1 S/N 14. 6 Hrs Broadband 10000 averages 73: 1 S/N 45 min • Cavity only 3 times better • Broadband still has factor of 19. 6 to signal average for an equal time measurement • A factor of ~4 in S/N • Factor of 3 to come soon: 3 k. W amplifier • 1 m Off-axis Parabolic Mirror Coaxial Arrangement (factor of 10 increase in the number of molecules in detection volume)

Conclusions Complementary Performance of the Two Designs 1. CP-FTMW - Full spectrum in a single shot • • Advantages – Fast acquisition of 11 GHz spectrum » 10000: 1 S/N in 45 min – Can trade off sensitivity for acquisition time » 100: 1 S/N in 20 seconds Disadvantage – Requires high power for optimal polarization 2. Cavity - Measure a spectral narrow region (~500 k. Hz) • Advantages – High sensitivity from cavity-enhanced emission and passive power gain on sample polarization – particularly well-suited for molecules with small dipole moments • Disadvantages – Slow measurement of full 11 GHz spectrum (14. 6 hours) – “All or nothing” spectrum acquisition

Acknowledgements Dr. Richard Suenram Funding: • NSF Chemistry • SELIM Program • NSF MRI Program (with Tom Gallagher, UVa Physics) • University of Virginia • John D. and Catherine T. Macarthur Foundation • The Jeffress Trust

Summary • Frequency accuracy of CP-FTMW within ~3 k. Hz of narrowband cavity machine • For optimal excitation (“π/2”) – CP-FTMW at 11 GHz bandwidth achieves equal sensitivity in 10, 000 averages (45 min. vs. 14. 6 hrs. ) – Significantly better dynamic range • Cavity machine best suited for single frequency monitoring and small dipole moments

Pure Rotational Spectrum of Suprane 20 ms of FID Acquisition (80 k. Hz linewidth, FWHM) (45 min. acquisition) 0. 1% Suprane in He/Ne 100 Shots: 20 s acquisition ~ 2 mmol sample consumption
 (10 Shots) Cyclopropanecarboxaldehyde")
Vertical Dynamic Range Comparison Broadband vs. Cavity Machine (10, 000 shots) (10 Shots) Cyclopropanecarboxaldehyde

Expected Dipole Moment Cross-Over (Equal Sensitivity of an 11 GHz Spectrum in an Equal Time Measurement) • Current Machine: 300 W, 1 ms pulse, cable input – 0. 55 D • Next Upgrade: 3 k. W, 1 ms pulse, waveguide input – 0. 12 D • Potential Upgrades: – 3 k. W, 4 ms optimal pulse length (diode protection) – 1 m Off-axis Parabolic Mirror Coaxial Arrangement (factor of 10 increase in the number of molecules in detection volume) – 0. 006 D

Performance Issues for Chirped Pulse FTMW Spectrometer • Frequency Accuracy and Measurement Precision – Frequency reference is Rb-disciplined 10 MHz oscillator (SRS FS 725) – For 20 ms FID acquisition with required digital signal processing the instrumental linewidth is 80 k. Hz • Relative Intensity Accuracy and Dynamic Range – Achieve large dynamic range through signal averaging using a 40 Gs/s 8 -bit digitizer and typically 10, 000 averages of the FID in the time domain

Performance Issues for Chirped Pulse FTMW Spectrometer • Measurement Sensitivity for Optimally Polarized Samples • Sensitivity for Small Dipole Moments (Polarization Efficiency) Both of these issues are related to the free space arrangement of the broadband spectrometer where standard gain horns (20 d. Bi) are used to broadcast and receive the MW power. How important is the cavity for FTMW spectroscopy?

Sensitivity Comparison OCS: Broadband Cavity 0. 00834% Natural Abundance 10000 Avgs. 10 Avgs. 100 Avgs.

OCS: Broadband Cavity 10000 Avgs. 10 Avgs. 0. 00834% Natural Abundance

Narrowband FTMW cavity 30 MHz MW Synthesizer v 0 + 30 MHz ν 0 Single Sideband ν 0 Free Induction Decay Fourier Transform (30 MHz Carrier) Digitizer (8 Ms/s) T. J. Balle and W. H. Flygare, Rev. Sci. Instrum. 52, 33 (1981). R. D. Suenram, J. U. Grabow, A. Zuban, and I. Leonov, Rev. Sci. Instrum. 70, 2127 (1999)

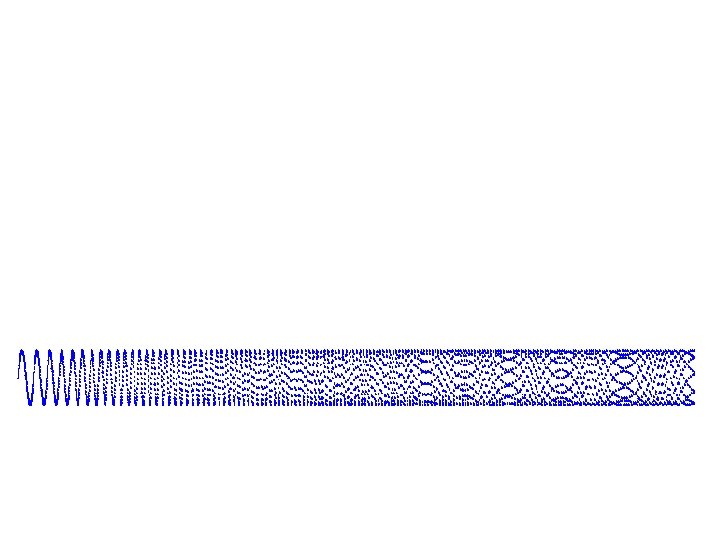
11 GHz CP-FTMW Spectrometer 2 GHz Bandwidth Arbitrary Waveform Generator 4 GS/s 9. 9 Chirped Pulse Frequency Sweep x 8 Multi-Nozzle Sample Feed TWT Amplifier IR Multipass 7. 5 - 18. 5 GHz Pulse Monitor Free Induction Decay 0. 5 – 11. 5 GHz 12 GHz Oscilloscope (40 Gs/s) 18. 99 FID acquisition and Fourier transform
 Cavity single Freq.")
Natural Abundance Determination Average abs. % error Cavity scan (10 avgs) Cavity single Freq. (100 avgs) Broadband (10, 000 avgs) 31. 03 24. 50 9. 87 Relative Abundances from Cavity FTMW Measurement are scaled to the 18 OCS signal (0. 188%) to avoid loss in dynamic range caused by limited digitizer range. Comparisons made assuming dipole moments are constant for all isotopomers
 2) •")
Role of the Cavity in FTMW Spectroscopy II. Passive power gain 1) 2) • Power buildup of molecular emission – Heterodyne detect E field – Signal is √Q enhanced Low input power for polarization Our Chirped Pulse Broadband Spectrometer loses both of these enhancements

11 GHz Chirped Pulse
- Slides: 36