The Process Sequence of interdependent and linked procedures


 energy")
 energy")


 energy")


 energy (LOW,")
 energy (LOW, MEDIUM, HIGH)")
 energy (LOW, MEDIUM, HIGH) Machines")

 energy (LOW, MEDIUM, HIGH) Machines")
 = F ( X 1, X 2, X 3)")
: Process Outcome a Result of Process Inputs The mathematical term")
")
")
")
: Process Outcome a Result of Process Inputs Measure: Prioritize potential")
: Process Outcome a Result of Process Inputs Measure: Prioritize potential")
: Process Outcome a Result of Process Inputs Measure: Prioritize potential")
: Process Outcome a Result of Process Inputs Measure: Prioritize potential")
: Process Outcome a Result of Process Inputs Analyze: Test x-Y")
: Process Outcome a Result of Process Inputs Analyze: Test x-Y")
: Process Outcome a Result of Process Inputs Analyze: Test x-Y")
: Process Outcome a Result of Process Inputs Improve: Implement solutions")
: Process Outcome a Result of Process Inputs Improve: Implement solutions")
: Process Outcome a Result of Process Inputs Improve: Implement solutions")
: Process Outcome a Result of Process Inputs Control: Monitor important")
: Process Outcome a Result of Process Inputs Control: Monitor important")
: Process Outcome a Result of Process Inputs Control: Monitor important")
: Process Outcome a Result of Process Inputs Control:")
: Process Outcome a Result of Process Inputs Control:")


 techniques enable designers to determine simultaneously the individual and interactive")


- Slides: 70
The Process Sequence of interdependent and linked procedures which, at every stage, consume one or more resources • employee time, • energy, • machines, • money to convert inputs • data, • material, • parts, into outputs. These outputs then serve as inputs for the next stage until a known goal or end result is reached.
The Expertise Manufacturing and Auto BHEL HM-Mitsubishi Hundai MUL LUCAS-TVS Transport Etihad Airlines Fly Dubai Go. Indigo IRS Vijay Tanks Air India Qantas Govt Services Marriot TVS S&S KSEB Air India NPCL Power Projects Oil & Gas ARIES Marine, UAE NITC, Iran Mactaggart Scott, UK ONGC PEMCO, Qatar Education NIT BIM, Trichy Thought Works
The Expertise • M. Tech – Quality, Reliability, OR • Certified Quality Engineer / MBB– ASQ • More than 3000 Improvement Projects • Last 1 year revenue impact above 2 Billion USD • Application in 30 domains with support consultants • Lead consultant for Qualimations in Gulf/India/Africa • 20 years application and support
The Process Sequence of interdependent and linked procedures which, at every stage, consume one or more resources • employee time, • energy, • machines, • money to convert inputs • data, • material, • parts, into outputs. These outputs then serve as inputs for the next stage until a known goal or end result is reached.
The Process Sequence of interdependent and linked procedures which, at every stage, consume one or more resources • employee time, • energy, • machines, • money inputs into • data, • material, • parts, outputs. These outputs then serve as inputs for the next stage until a known goal or end result is reached.
The Process Sequence of interdependent and linked procedures which, at every stage, consume one or more resources • employee time, • energy, • machines, • money inputs into • data, • material, • parts, outputs. These outputs then serve as inputs for the next stage until a known goal or end result is reached. f
The Process Sequence of interdependent and linked procedures which, at every stage, consume one or more resources • employee time, • energy, • machines, • money inputs • data, • material, • parts, outputs.
The Process Sequence of interdependent and linked procedures which, at every stage, consume one or more resources • employee time, • energy, • machines, • money outputs. inputs • data, • material, • parts, Vibration Climate Holidays Breakdown
The Process Controllable Factors • employee time, • energy, • machines, • money inputs Outputs • data, • material, • parts, Characteristics Vibration Climate Holidays Breakdown Non Controllable Factors
The Process Controllable Factors inputs data, material, parts, Employee time energy Machines Money Outputs Characteristics Vibration Climate Holidays Breakdown Non Controllable Factors
The Process Controllable Factors Target Employee time energy Machines Money 3. 75 mm inputs data, material, parts, Outputs 0. 03 mm Vibration Climate Holidays Breakdown Non Controllable Factors USL: 3. 78 LSL: 3. 72
The Process Controllable Factors Target Employee time energy Machines Money 3. 75 mm inputs data, material, parts, Outputs 0. 03 mm Vibration Climate Holidays Breakdown Non Controllable Factors USL: 3. 78 LSL: 3. 72
The Process Controllable Factors Target Employee time energy Machines Money 3. 75 mm inputs data, material, parts, Outputs 0. 03 mm Vibration Climate Holidays Breakdown Non Controllable Factors USL: 3. 78 LSL: 3. 72
The Process Controllable Factors Target Employee time energy Machines Money 3. 75 mm inputs data, material, parts, Outputs 0. 03 mm Vibration Climate Holidays Breakdown Non Controllable Factors USL: 3. 78 LSL: 3. 72
The Process Controllable Factors Target Employee time energy Machines Money 3. 75 mm inputs data, material, parts, Outputs 0. 03 mm Vibration Climate Holidays Breakdown Non Controllable Factors USL: 3. 78 LSL: 3. 72
The Process Controllable Factors Process characteristics Outputs Target 3. 75 mm Employee time (LESS, HIGH) energy (LOW, MEDIUM, HIGH) Machines ( M 1, M 2) Money (LOW, HIGH) inputs Data (TABULATED, NONTABULATED) Material (TYPE 1, TYPE 2), Parts( PARTA, PARTB), Incoming source of variation Vibration ( DEPENDEND ON TIME) Climate (DEPENDED ON SEASON) Holidays (DIFFERS) Breakdown (RESOURSE ON MAINTANENCE) Non Controllable Factors Cost 0. 03 mm USL: 3. 78 LSL: 3. 72 Product characteristics A product characteristic is a feature of the product that must be controlled, such as a dimension, a color, or contamination. Each product characteristic should have at least one process characteristic that is associated with it. The process characteristic is the feature or element of the process that affects or controls the product characteristic in question. For example, a product characteristic might be a drilled/bored hole of a certain size and location, and the associated process characteristics might be proper drill size, drill sharpness, and the method used to locate the hole in the machine. The goal should be to identify, optimize and control the process characteristics so as to avoid having to inspect product characteristics. That's whatprocess control is all about.
The Process Controllable Factors Outputs Target 3. 75 mm Employee time (LESS, HIGH) energy (LOW, MEDIUM, HIGH) Machines ( M 1, M 2) Money (LOW, HIGH) inputs Data (TABULATED, NONTABULATED) Material (TYPE 1, TYPE 2), Parts( PARTA, PARTB), 0. 03 mm Vibration ( DEPENDEND ON TIME) Climate (DEPENDED ON SEASON) Holidays (DIFFERS) Breakdown (RESOURSE ON MAINTANENCE) Non Controllable Factors USL: 3. 78 LSL: 3. 72
The Process Controllable Factors Outputs Target 3. 75 mm Employee time (LESS, HIGH) energy (LOW, MEDIUM, HIGH) Machines ( M 1, M 2) Money (LOW, HIGH) inputs Data (TABULATED, NONTABULATED) Material (TYPE 1, TYPE 2), Parts( PARTA, PARTB), 0. 03 mm Vibration ( DEPENDEND ON TIME) Climate (DEPENDED ON SEASON) Holidays (DIFFERS) Breakdown (RESOURSE ON MAINTANENCE) Non Controllable Factors USL: 3. 78 LSL: 3. 72
The Process Outputs Target 0. 03 mm USL: 3. 78 Sigma=3. 25 LSL: 3. 72 USL: 3. 78 Sigma=3. 03 LSL: 3. 72 USL: 3. 78 LSL: 3. 72 Sigma=2. 56
The Process Outputs Target 0. 03 mm USL: 3. 78 Sigma=3. 25 LSL: 3. 72 USL: 3. 78 Sigma=3. 03 LSL: 3. 72 USL: 3. 78 LSL: 3. 72 Sigma=2. 56
The Process Controllable Factors Outputs Target 3. 75 mm Employee time (LESS, HIGH) energy (LOW, MEDIUM, HIGH) Machines ( M 1, M 2) Money (LOW, HIGH) inputs Data (TABULATED, NONTABULATED) Material (TYPE 1, TYPE 2), Parts( PARTA, PARTB), 0. 03 mm Vibration ( DEPENDEND ON TIME) Climate (DEPENDED ON SEASON) Holidays (DIFFERS) Breakdown (RESOURSE ON MAINTANENCE) Non Controllable Factors USL: 3. 78 LSL: 3. 72
The Process Outputs Controllable Factors Target Process 3. 75 mm Average Employee time (LESS, HIGH) energy (LOW, MEDIUM, HIGH) Machines ( M 1, M 2) Money (LOW, HIGH) inputs Data (TABULATED, NONTABULATED) Material (TYPE 1, TYPE 2), Parts( PARTA, PARTB), 0. 03 mm Vibration ( DEPENDEND ON TIME) Climate (DEPENDED ON SEASON) Holidays (DIFFERS) Breakdown (RESOURSE ON MAINTANENCE) Non Controllable Factors Process variation USL: 3. 78 LSL: 3. 72
Outputs Process Average The Process Controllable Factors Target 3. 75 mm Employee time (LESS, HIGH) energy (LOW, MEDIUM, HIGH) Machines ( M 1, M 2) Money (LOW, HIGH) inputs Data (TABULATED, NONTABULATED) Material (TYPE 1, TYPE 2), Parts( PARTA, PARTB), 0. 03 mm Vibration ( DEPENDEND ON TIME) Climate (DEPENDED ON SEASON) Holidays (DIFFERS) Breakdown (RESOURSE ON MAINTANENCE) Non Controllable Factors Process variation USL: 3. 78 LSL: 3. 72
Outputs Process Average The Process Controllable Factors Target 3. 75 mm Employee time (LESS, HIGH) energy (LOW, MEDIUM, HIGH) Machines ( M 1, M 2) Money (LOW, HIGH) inputs Data (TABULATED, NONTABULATED) Material (TYPE 1, TYPE 2), Parts( PARTA, PARTB), 0. 03 mm Vibration ( DEPENDEND ON TIME) Climate (DEPENDED ON SEASON) Holidays (DIFFERS) Breakdown (RESOURSE ON MAINTANENCE) Non Controllable Factors Process variation USL: 3. 78 LSL: 3. 72
The Process Problem Process Average Outputs 3. 75 mm Target 0. 03 mm Process variation USL: 3. 78 LSL: 3. 72
The Process Problem Process Average Outputs 3. 75 mm Target 0. 03 mm Process variation USL: 3. 78 LSL: 3. 72
The Process Problem Outputs Expected Process Average Outputs Current Target 3. 75 mm Target 0. 03 mm Process variation USL: 3. 78 LSL: 3. 72
The Process Outputs Current Process Average Controllable Factors Employee time (LESS, HIGH) energy (LOW, MEDIUM, HIGH) Machines ( M 1, M 2) Money (LOW, HIGH) Target 3. 75 mm inputs Data (TABULATED, NONTABULATED) Material (TYPE 1, TYPE 2), Parts( PARTA, PARTB), Vibration ( DEPENDEND ON TIME) Climate (DEPENDED ON SEASON) Holidays (DIFFERS) Breakdown (RESOURSE ON MAINTANENCE) Non Controllable Factors 0. 03 mm Process variation USL: 3. 78 LSL: 3. 72
The Process Controllable Factors Outputs Objective Employee time (LESS, HIGH) energy (LOW, MEDIUM, HIGH) Machines ( M 1, M 2) Money (LOW, HIGH) inputs Data (TABULATED, NONTABULATED) Material (TYPE 1, TYPE 2), Parts( PARTA, PARTB), Supplier Process average (center) Process Variation (Minimal) Vibration ( DEPENDEND ON TIME) Climate (DEPENDED ON SEASON) Holidays (DIFFERS) Breakdown (RESOURSE ON MAINTANENCE) Non Controllable Factors
Process Controllable Factors Outputs Objective Employee time (LESS, HIGH) energy (LOW, MEDIUM, HIGH) Machines ( M 1, M 2) Money (LOW, HIGH) inputs Data (TABULATED, NONTABULATED) Material (TYPE 1, TYPE 2), Parts( PARTA, PARTB), Supplier Process average (center) Process Variation (Minimal) Vibration ( DEPENDEND ON TIME) Climate (DEPENDED ON SEASON) Holidays (DIFFERS) Breakdown (RESOURSE ON MAINTANENCE) Non Controllable Factors
Process Control R chart control X chart control
Process Controllable Factors Outputs Objective Employee time (LESS, HIGH) energy (LOW, MEDIUM, HIGH) Machines ( M 1, M 2) Money (LOW, HIGH) inputs Data (TABULATED, NONTABULATED) Material (TYPE 1, TYPE 2), Parts( PARTA, PARTB), Supplier Process average (center) Process Variation (Minimal) Vibration ( DEPENDEND ON TIME) Climate (DEPENDED ON SEASON) Holidays (DIFFERS) Breakdown (RESOURSE ON MAINTANENCE) Non Controllable Factors Y = f(x): Process Outcome a Result of Process Inputs
Process Control Output Quality (Y) = F ( X 1, X 2, X 3) X 2: [ F 1, F 2, F 3, F 4…. ] Supplier Slot width Controllable Factors Sheet Metal Gage Input 3. 06 mm +/-. 03 mm Output x 1 x 2 Non Controllable Factors 2. 04 mm +/-0. 3 mm x 3 Measure of quality Quality of Slot width Y = f(x): Process Outcome a Result of Process Inputs
DMAIC Y = f(x): Process Outcome a Result of Process Inputs The mathematical term Y = f(x), which translates as simply Y is a function of x, illustrates the idea that the important process outcomes (Ys) are a result of the drivers (x‘s) within processes. The goal of DMAIC is to identify which few process and input variables mainly influence the process output measures. Each DMAIC phase can therefore be described by how it contributes to this goal: Define: Understand the project Y and how to measure it. Measure: Prioritize potential x‘s and measure x‘s and Y. Analyze: Test x-Y relationships and verify/quantify important x‘s. Improve: Implement solutions to improve Y and address important x‘s. Control: Monitor important x‘s and the Y over time.
DMAIC Y = f(x 1, x 2, x 3, x 4, x 5………………. xn) Define: Understand the project Y and how to measure it. Y = f(x 1, x 2, x 3, x 4, x 5………………. xn) The project charter delivers the Y by clearly stating what the business or process problem is. It also expresses the Y as a measurable process metric that tells how well the process is performing today (the baseline) and how performance should be after process improvement (the goal). VOC is used to verify the importance of the Y metric and to set specifications for the Y. Since the output column usually shows multiple Ys, VOC is again needed to determine which Y should be included in the project. q Voice of Customer q SIPOC (suppliers, inputs, process, outputs, customers) diagram clearly links the project Y to the process output. The output column of the SIPOC shows which Y is a result of the process. In the input column, the SIPOC provides a list of potential Xs.
DMAIC Y = f(x 1, x 2, x 3, x 4, x 5………………. xn) Define: Understand the project Y and how to measure it. Y = f(x 1, x 2, x 3, x 4, x 5………………. xn) The business case finally links the project Y to the so called “Big Y. ” This means it shows how achieving the project Y contributes to higher-level business objectives like financial targets, customer satisfaction or strategically relevant goals (on time to market, on-time delivery, inventory level, etc. ). The project team can close the Define phase when it has a measurable, clearly defined Y with set specifications that help to distinguish between desired and not desired process performance.
DMAIC Y = f(x 1, x 2, x 3, x 4, x 5………………. xn) Define: Understand the project Y and how to measure it. DMAIC Phase Steps Tools Used D – Define Phase: Define the project goals and customer (internal and external) deliverables. Define Resources Project Charter Process Flowchart SIPOC Diagram Stakeholder Analysis Evaluate Key Organizational Support DMAIC Work Breakdown Structure Develop Project Plan and Milestones CTQ Definitions Voice of the Customer Gathering Define Customers and Requirements (CTQs) Develop Problem Statement, Goals and Benefits Identify Champion, Process Owner and Team Develop High Level Process Map Y = f(x 1, x 2, x 3, x 4, x 5………………. xn)
DMAIC Y = f(x): Process Outcome a Result of Process Inputs Measure: Prioritize potential x‘s and measure x‘s and Y. The Measure phase usually starts with a fishbone diagram and/or a detailed process mapping. Given the clearly defined Y from the Define phase, the fishbone helps to identify all potential causes (x‘s) of this Y; the detailed process mapping also shows which process x‘s mostly influence the process Y. At the end of this step, the project team should have a full picture of potential x‘s that it might next have to reduce to a manageable and measurable few.
DMAIC Y = f(x): Process Outcome a Result of Process Inputs Measure: Prioritize potential x‘s and measure x‘s and Y. It is always important to remember that the brainstorming, as well as the reduction of potential x‘s, happens based on process expertise, not yet on facts and data. As the next step, the team sets up a data collection plan that allows for measuring both x‘s and Y in such a way that the data collected can later be used to identify cause-and-effect (i. e. , x-Y) relationships with the help of graphical and statistical tools. Of course, for all x‘s and Ys to be measured, an operational definition and – if possible – a gage R&R study should be conducted in order to guarantee reliable data. Having the x‘s and Y data collected, the team would now start identifying patterns in data. Usually control charts, time series plots, and frequency plots are used to separate common from special cause variation. X‘s that influence special cause variation are identified, and if they can be explained and avoided in the future, they are removed from the data set. Additionally, Pareto analyses where the Y is stratified by categories of one x help to further scope the project.
DMAIC Y = f(x): Process Outcome a Result of Process Inputs Measure: Prioritize potential x‘s and measure x‘s and Y. The final step in the Measure phase is to determine the baseline capability of the process Y: Yield, Cpk or process sigma values indicate how well the process Y is performing today. This also sometimes leads to re-setting the initially stated goals in the project charter. The Measure phase ends with related data for the Y and the most important x‘s, where x‘s of special cause variation have already been removed from the data set.
DMAIC Y = f(x): Process Outcome a Result of Process Inputs Measure: Prioritize potential x‘s and measure x‘s and Y. M – Measure Phase: Measure the process to determine current performance; quantify the problem. Define Defect, Opportunity, Unit and Metrics Detailed Process Map of Appropriate Areas Develop Data Collection Plan Validate the Measurement System Collect the Data Begin Developing Y=f(x) Relationship Determine Process Capability and Sigma Baseline Process Flowchart Data Collection Plan/Example Benchmarking Measurement System Analysis/Gage R&R Voice of the Customer Gathering Process Sigma Calculation Y = f(x 1, x 2, x 3, x 4, x 5………………. xn)
DMAIC Y = f(x): Process Outcome a Result of Process Inputs Analyze: Test x-Y relationships and verify/quantify important x‘s. In terms of x‘s and Ys, the Analyze phase is quite simple: All graphical tools (e. g. , stratified frequency plots, pie charts, scatter plots, etc. ) and statistical tools (hypothesis tests, regression analysis, design of experiments) that Green Belts and Black Belts learn during training have just one goal: Verifying and quantifying X-Y relationships.
DMAIC Y = f(x): Process Outcome a Result of Process Inputs Analyze: Test x-Y relationships and verify/quantify important x‘s. The large number of different tools available is simply because different data types (continuous or discrete) of x and Y require different tools, as illustrated in the figure below. In addition to this data door, the tools of the process door (waste analysis, valueadded analysis) supplement the quantitative data analysis with a more qualitative analysis and confirmation of important process x‘s. At the end of the Analyze phase, the critical few x‘s that contribute most to the problem of the process Y are known.
DMAIC Y = f(x): Process Outcome a Result of Process Inputs Analyze: Test x-Y relationships and verify/quantify important x‘s. A – Analyze Phase: Analyze and determine the root cause(s) of the defects. Define Performance Objectives Identify Value/Non-Value Added Process Steps Identify Sources of Variation Determine Root Cause(s) Determine Vital Few x’s, Y=f(x) Relationship Histogram Pareto Chart Hypothesis Testing Scatter Plot Regression Analysis Cause and Effect/Fishbone Diagram 5 Whys Process Map Review and Analysis Statistical Analysis Y = f(x 1, x 2, x 3, x 4, x 5………………. xn)
DMAIC Y = f(x): Process Outcome a Result of Process Inputs Improve: Implement solutions to improve Y and address important x‘s. Analog to the Measure phase, the Improve phase also starts with getting a full picture. This time it is a full picture of potential solutions that – by addressing the critical few x‘s – can help improve the Y. Brainstorming and creativity techniques help to generate these potential solutions. In order to reduce these solutions to those that should be implemented, each solution is rated against specific criteria.
DMAIC Y = f(x): Process Outcome a Result of Process Inputs Improve: Implement solutions to improve Y and address important x‘s. Two important criteria are how much a solution contributes to improving the Yand how much it addresses specific x‘s. (Of course other criteria, like easiness of implementation, costs, also are important. ) Before starting the implementation of the improved process, a failure modes and effect analysis helps to identify ways that the process Y can fail and the potential causes (newly or previously identified x‘s) and how to prevent these failures from happening. At the end of the Improve phase, short-term data (e. g. , from a pilot program) demonstrates that the identified solution or solution package has really improved the Y.
DMAIC Y = f(x): Process Outcome a Result of Process Inputs Improve: Implement solutions to improve Y and address important x‘s. I – Improve Phase: Improve the process by eliminating defects. Perform Design of Experiments Develop Potential Solutions Define Operating Tolerances of Potential System Assess Failure Modes of Potential Solutions Validate Potential Improvement by Pilot Studies Correct/Re-Evaluate Potential Solution Brainstorming Mistake Proofing Design of Experiments Pugh Matrix QFD/House of Quality Failure Modes and Effects Analysis (FMEA) Simulation Software Y = f(x 1, x 2, x 3, x 4, x 5………………. xn)
DMAIC Y = f(x): Process Outcome a Result of Process Inputs Control: Monitor important x‘s and the Y over time. The Control phase ensures that the new performance of the Y is sustained over time. In order to achieve this, a process management chart is developed that shows the new process flow, offers critical check points during the process, and has recommended actions in case the process does not continue on target. In a process management chart, the previously identified x‘s are called leading indicators (i. e. , checkpoints during the process) and the Y is the lagging indicator (i. e. , the final checkpoint at the end of a process cycle).
DMAIC Y = f(x): Process Outcome a Result of Process Inputs Control: Monitor important x‘s and the Y over time. Additionally, a performance measurement and monitoring system or dashboard is established that helps the process owner to measure and control the critical leading (x‘s) and lagging (Y) indicators on a continuous base. Control charts are again the best tool to show the performance of the Y over time. After the handover of these tools to the process owner, the project is closed by evaluating the achieved results in terms of x‘s that were identified and the improvement in the Y.
DMAIC Y = f(x): Process Outcome a Result of Process Inputs Control: Monitor important x‘s and the Y over time. C – Control Phase: Control future process performance. Define and Validate Monitoring and Control System Develop Standards and Procedures Implement Statistical Process Control Determine Process Capability Develop Transfer Plan, Handoff to Process Owner Verify Benefits, Cost Savings/Avoidance, Profit Growth Close Project, Finalize Documentation Process Sigma Calculation Control Charts (Variable and Attribute) Cost Savings Calculations Control Plan Communicate to Business, Celebrate Y = f(x 1, x 2, x 3, x 4, x 5………………. xn)
VOC-Voice of Customer Y = f(x): Process Outcome a Result of Process Inputs Control: Monitor important x‘s and the Y over time. Voice of the Customer is a market research technique that produces a detailed set of customer wants and needs, organized into a hierarchical structure, and then prioritized in terms of relative importance and satisfaction with current alternatives. Voice of the Customer studies typically consist of both qualitative and quantitative research steps. They are generally conducted at the start of any new product, process, or service design initiative in order to better understand the customer's wants and needs, and as the key input for new product definition, Quality Function Deployment (QFD), and the setting of detailed design specifications. Y = f(x 1, x 2, x 3, x 4, x 5………………. xn)
VOC-Voice of Customer Y = f(x): Process Outcome a Result of Process Inputs Control: Monitor important x‘s and the Y over time. Y = f(x 1, x 2, x 3, x 4, x 5………………. xn)
You are in charge of a process that needs to be optimized. You suspect that two factors contribute to yield , but are not sure if one or both of them contribute. To save time and money you test factor A at 5 levels and factor B at 7 levels with no repetitions. Find the significance of factors A and B. Number of manufactured goods. .
You are in charge of a process that needs to be optimized. You suspect that two factors contribute to errors , but are not sure if one or both of them contribute. To save time and money you test factor A at 5 levels and factor B at 7 levels with no repetitions. Find the significance of factors A and B. The level of significance is 95% (alpha = 0. 05). Number of manufactured goods. .
You are in charge of a process that needs to be optimized. You suspect that two factors contribute to errors , but are not sure if one or both of them contribute. To save time and money you test factor A at 5 levels and factor B at 7 levels with no repetitions. Find the significance of factors A and B. The level of significance is 95% (alpha = 0. 05). Number of manufactured goods. .
You are in charge of a process that needs to be optimized. You suspect that two factors contribute to errors , but are not sure if one or both of them contribute. To save time and money you test factor A at 5 levels and factor B at 7 levels with no repetitions. Find the significance of factors A and B. The level of significance is 95% (alpha = 0. 05). Number of manufactured goods. . Fcrit 2, 78 2. 51
You are in charge of a process that needs to be optimized. You suspect that two factors contribute to errors , but are not sure if one or both of them contribute. To save time and money you test factor A at 5 levels and factor B at 7 levels with no repetitions. Find the significance of factors A and B. The level of significance is 95% (alpha = 0. 05). Number of manufactured goods. . H 0 Ha Both are the same. There is no relation. One is different are different. There is a relation. F-statistic F 0 < Fcrit F 0 > Fcrit P-value p > alpha p < alpha Hypothesis
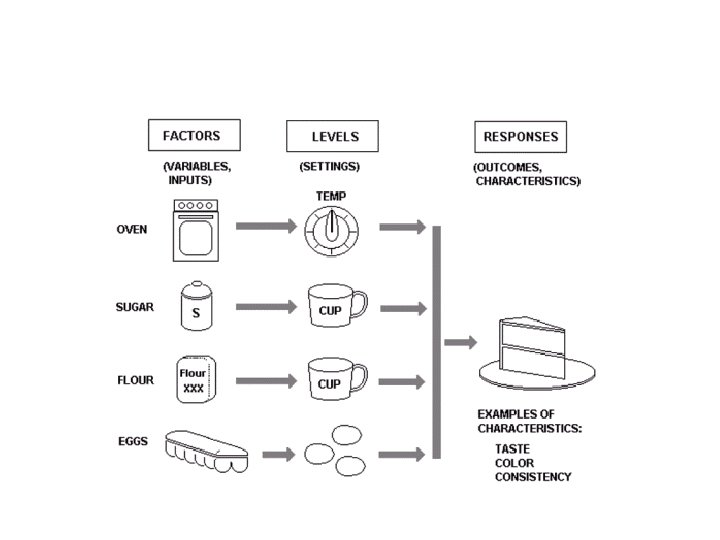
Factor Response • • • Temperature Concentration Speed Feed Operator • Yield
Factor/Level Response • Temperature – 30 deg – 50 deg – 75 deg • Concentration – 8% – 12% – 16% • Speed • Feed • Operator • Yield
Factor/Level Response • Temperature – 30 deg – 50 deg – 75 deg • Concentration – 8% – 12% – 16% • Yield
Design of Experiments (DOE) techniques enable designers to determine simultaneously the individual and interactive effects of many factors that could affect the output results in any design. DOE also provides a full insight of interaction between design elements; therefore, helping turn any standard design into a robust one. DOE helps to pin point the sensitive parts and sensitive areas in your designs that cause problems in Yield. Designers then are able to fix them and produce robust and higher yield designs prior going into production.
Dr. Taguchi pointed out that • For long term effect of quality, it must be designed into the products. • All activities of a manufacturing organization have roles to play in building quality into the products. • Return on investment is much higher when quality issues are addressed further up-front in engineering.
• Experiment planning is the necessary first step (with many people/team and use consensus decisions) • Design smallest experiments with key factors • Run experiments in random order • Predict and verify expected results before implementation.
What are key process output variables? Key process output variables (sometimes referred to as Key Characteristics) are traits or features of a part, piece of material, assembly, subsystem, or system whose variation has a significant influence on fit, performance, reliability, manufacturability, or assembly. In short, they are characteristics that have a big impact on efficiency and/or customer satisfaction. Variation in key process output variables leads to lower levels of quality and reliability and, ultimately, higher costs. Examples of key process output variables are: - Slip torque of an actuator - Gap between car body and rear quarter glass panel - Cabin wind noise - Fill volume for a bottled beverage
What are key process input variables? Key process input variables are process inputs that have a significant impact on the variation found in a key process output variable. That is, if the key process input variables were controlled (e. g. held constant), the process would produce predictable and consistent outputs. For example, if the flatness of a clutch disk has a significant impact on the slip torque of an actuator, then clutch disk flatness would be a key process input variable. As another example, my wife likes to experiment with baking the healthiest cookies possible by substituting fat free yogurt for butter. Clearly, the absence of butter has a large impact on the consistency and taste of the cookies. By finding an acceptable butter/yogurt mix and then holding this key process input variable constant, I should expect consistent cookie consistency!
How are key process input variables identified? Since we have limited resources, the challenge is to determine which variables are important enough to control. While considerable effort is spent on trial-and-error approaches, these are extremely inefficient and almost never result in optimal solutions. Fortunately, a tool exists that is perfect for this problem. Design of Experiments (DOE) is a tool that allows us to conduct structured experimentation to efficiently model process behavior and understand the cause-and-effect relationships present. Many types of experiments are available and their appropriate use depends on the experiment objectives, the number of factors to be investigated, the types of factors, etc. Most products and processes must satisfy multiple customer requirements (and so there are multiple key process output variables). For example, a part may need to possess a specific strength and flexibility. Often, optimizing one performance metric will degrade another. DOE can be used to jointly optimize systems where multiple objectives are present--that is, find the sweet spot. Rigorous use of DOE is invaluable in determining not only which input variables must be controlled to produce consistent outputs but to what extent those variables must be controlled. That is, we may quantify the sensitivity of the output variable to changes in the input variable. And this is exactly the information that is needed to deploy effective control charts.
· Determine what to verify/measure · Determine how many to verify/measure, i. e. statistical significance · Determine when to verify/measure · Define acceptance/rejection criteria · Define required documentation
The Six Sigma View of Business