The Prescription Opioid and Heroin Crisis An Epidemic


, by age")


 , US Hispanics (USH)")


 Source: United States General Accounting Office: Dec.")


: 123. 40")
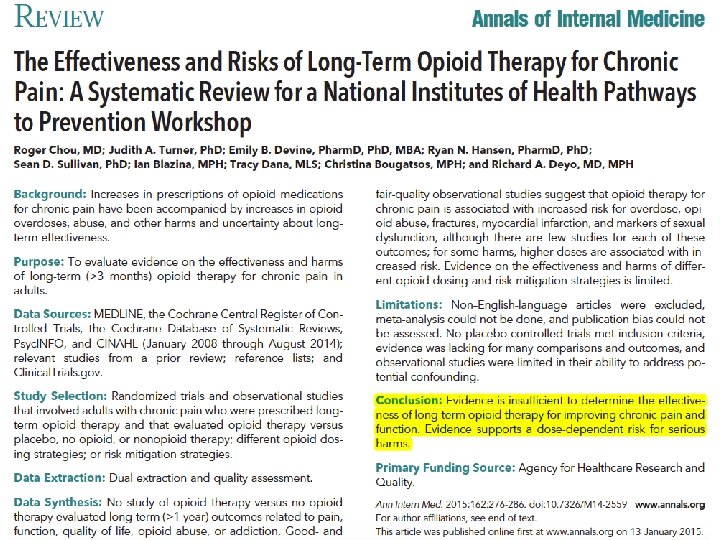

 “Nonpharmacologic therapy and nonopioid pharmacologic therapy are preferred for chronic")
 • Developed without input from experts with ties to opioid")
 “We recommend against initiation of long-term opioid therapy for chronic pain”")


- Slides: 52
The Prescription Opioid and Heroin Crisis: An Epidemic of Addiction Andrew Kolodny, M. D. . Executive Director, Physicians for Responsible Opioid Prescribing Co-Director, Opioid Policy Research Collaborative, Heller School for Social Policy and Management, Brandeis University
Conflict of Interests I have no relevant financial relationships to disclose. 2
Opium 3
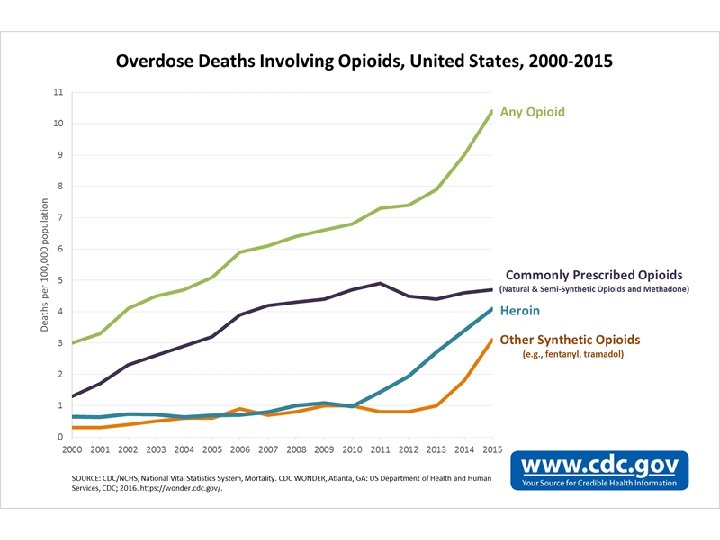
Unintentional Drug Overdose Deaths United States, 1970– 2007 52, 404 drug overdose deaths in 2015 Cocaine Heroin Year National Vital Statistics System, http: //wonder. cdc. gov
Unintentional Drug Overdose Deaths United States, 1970– 2007 52, 404 drug overdose deaths in 2015 Cocaine Heroin Year National Vital Statistics System, http: //wonder. cdc. gov
Unintentional Drug Overdose Deaths United States, 1970– 2007 52, 404 drug overdose deaths in 2015 Cocaine Heroin Year National Vital Statistics System, http: //wonder. cdc. gov
Unintentional Drug Overdose Deaths United States, 1970– 2007 52, 404 drug overdose deaths in 2015 Cocaine Heroin Year National Vital Statistics System, http: //wonder. cdc. gov
Unintentional Drug Overdose Deaths United States, 1970– 2007 52, 404 drug overdose deaths in 2015 Cocaine Heroin Year National Vital Statistics System, http: //wonder. cdc. gov
Unintentional Drug Overdose Deaths United States, 1970– 2007 52, 404 drug overdose deaths in 2015 Cocaine Heroin Year National Vital Statistics System, http: //wonder. cdc. gov
Unintentional Drug Overdose Deaths United States, 1970– 2007 52, 404 drug overdose deaths in 2015 Cocaine Heroin Year National Vital Statistics System, http: //wonder. cdc. gov
Unintentional Drug Overdose Deaths United States, 1970– 2007 52, 404 drug overdose deaths in 2015 Cocaine Heroin Year National Vital Statistics System, http: //wonder. cdc. gov
Unintentional Drug Overdose Deaths United States, 1970– 2007 52, 404 drug overdose deaths in 2015 Cocaine Heroin Year National Vital Statistics System, http: //wonder. cdc. gov
Heroin treatment admissions : 2003 -2013 SOURCE: Center for Behavioral Health Statistics and Quality, Substance Abuse and Mental Health Services Administration, Treatment Episode Data Set (TEDS). Data received through 01. 23. 15.
Death rates from overdoses of heroin or prescription opioid pain relievers (OPRs), by age group SOURCE: CDC. Increases in Heroin Overdose Deaths — 28 States, 2010 to 2012 MMWR. 2014, 63: 849 -854 15
Primary non-heroin opiates/synthetics admission rates, by State (per 100, 000 population aged 12 and over) 16
Primary non-heroin opiates/synthetics admission rates, by State (per 100, 000 population aged 12 and over) 17
Primary non-heroin opiates/synthetics admission rates, by State (per 100, 000 population aged 12 and over) 18
Primary non-heroin opiates/synthetics admission rates, by State (per 100, 000 population aged 12 and over) 19
Primary non-heroin opiates/synthetics admission rates, by State (per 100, 000 population aged 12 and over) 20
Primary non-heroin opiates/synthetics admission rates, by State (per 100, 000 population aged 12 and over) 21
Non-heroin opioid treatment admissions: 2013 SOURCE: Center for Behavioral Health Statistics and Quality, Substance Abuse and Mental Health Services Administration, Treatment Episode Data Set (TEDS). Data received through 01. 23. 15.
All-cause mortality, ages 45– 54 for US White non-Hispanics (USW) , US Hispanics (USH) France (FRA), Germany (GER), the United Kingdom (UK), Canada (CAN), Australia (AUS), and Sweden (SWE). 23 Source: Anne Case, Angus Deaton. Rising morbidity and mortality in midlife among white non-Hispanic Americans in the 21 st century. Proceedings of the National Academy of Sciences. November 2, 2015 (online ahead of print).
Mortality by cause, white non-Hispanics ages 45– 54 Source: Anne Case, Angus Deaton. Rising morbidity and mortality in midlife among white non. Hispanic Americans in the 21 st century. Proceedings of the National Academy of Sciences. 24 November 2, 2015 (online ahead of print).
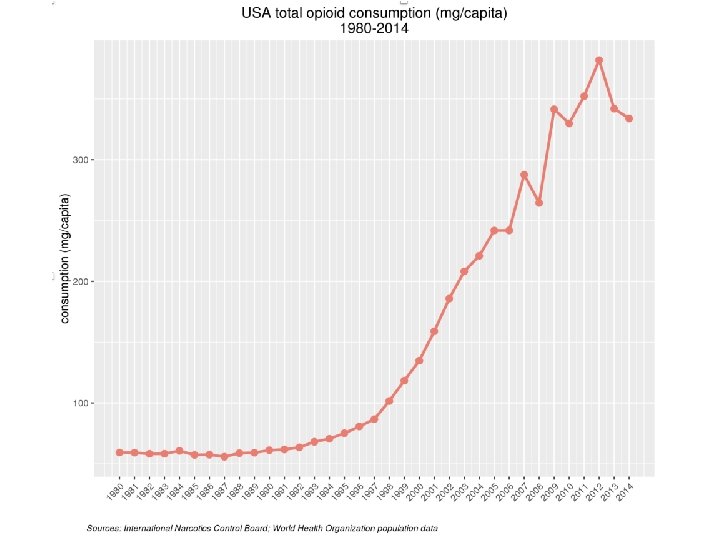
Unintentional overdose deaths involving opioid analgesics parallel per capita sales of opioid analgesics in morphine equivalents by year, U. S. , 1997 -2007 * Number of Deaths Opioid sales (mg/person) Source: National Vital Statistics System, multiple cause of death dataset, and DEA ARCOS * 2007 opioid sales figure is preliminary.
8 Rates of Opioid Sales, OD Deaths, and Treatment, 1999– 2010 Opioid Sales KG/10, 000 Opioid Deaths/100, 000 Opioid Treatment Admissions/10, 000 7 6 Rate 5 4 3 2 1 0 1999 CDC. MMWR 2011 2000 2001 2002 2003 2004 2005 Year 2006 2007 2008 2009 2010
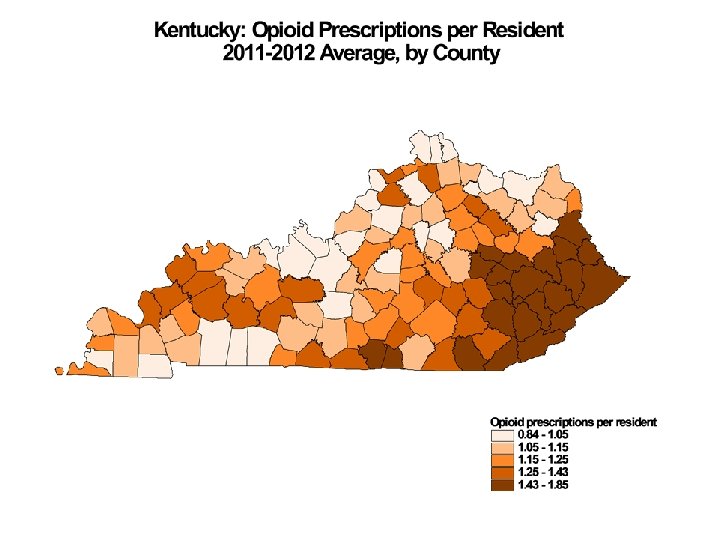
Opioid Prescribing by Morphine Mg Equivalents by County 2015 Source: MMWR / July 7, 2017 / Vol. 66 / No. 26 US Department of Health and Human Services/Centers for Disease Control and Prevention
Estimated Age-adjusted Death Rates for Drug Poisoning by County, United States: 2015 Source: Rossen LM, Bastian B, Warner M, Khan D, and Chong Y. Drug poisoning mortality: United States, 1999– 2015. National Center for Health Statistics. 2017.
Prescription Opioid-related Death Rates per 100, 000 Population by County, 2011 -2012 and 2013 -2014
Heroin-related Death Rates per 100, 000 Population by County, 2011 -2012 and 2013 -2014
Opioid prescribing in the U. S. peaked ~ 2011 Prescribing has declined slightly since 2011 Prescribing levels in 2015 were 3 times higher than 1999 Source: Guy GP Jr. , Zhang K, Bohm MK, et al. Vital Signs: Changes in Opioid Prescribing in the United States, 2006– 2015. MMWR Morb Mortal Wkly Rep 2017; 66: 697– 704.
34
35
Dollars Spent Marketing Oxy. Contin (1996 -2001) Source: United States General Accounting Office: Dec. 2003, “Oxy. Contin Abuse and Diversion and Efforts to Address the Problem. ”
Industry-funded “educational” messages • Physicians are needlessly allowing patients to suffer because of “opiophobia. ” • Opioid addiction is rare in patients. • Opioids can be easily discontinued. • Opioids are safe and effective for chronic pain. 37
Industry-funded organizations campaigned for greater use of opioids • Pain Patient Groups • Professional Societies • The Joint Commission • The Federation of State Medical Boards 38
“The risk of addiction is much less than 1%” Porter J, Jick H. Addiction rare in patients treated with narcotics. N Engl J Med. 1980 Jan 10; 302(2): 123 Cited 824 times (Google Scholar) 39
N Engl J Med. 1980 Jan 10; 302(2): 123. 40
43
CDC Opioid Guideline (2016) “Nonpharmacologic therapy and nonopioid pharmacologic therapy are preferred for chronic pain. ”
CDC Opioid Guideline (2016) • Developed without input from experts with ties to opioid makers • Rejected use of so-called risk assessment tools • Defined > 50 mg ME as high dose and > 90 mg ME to be avoided. • For acute pain: “Three days or less will often be sufficient. ”
VA/DOD Guideline (2017) “We recommend against initiation of long-term opioid therapy for chronic pain” “Risks for overdose and death significantly increase at a range of 20 - 50 mg morphine equivalent daily dose” “We recommend against opioid doses over 90 mg morphine equivalent daily dose for treating chronic pain”
Controlling the epidemic: A Three-pronged Approach • Prevent new cases of opioid addiction. • Treat people who are already addicted. • Reduce supply from pill mills and the blackmarket. 47
How the opioid lobby frames the problem: Source: Slide presented by Dr. Lynn Webster at FDA meeting on hydrocodone upscheduling, Jan 25 th, 2013.
This is a false dichotomy Opioid harms are not limited to so-called “drug abusers” 35% met DSM V criteria for an opioid use disorder 1 Pain Patients “Drug Abusers” 92% of opioid OD decedents were prescribed opioids for chronic pain. 2 1. Boscarino JA, Rukstalis MR, Hoffman SN, et al. Prevalence of prescription opioid-use disorder among chronic pain patients: comparison of the DSM-5 vs. DSM-4 diagnostic criteria. J Addict Dis. 2011; 30: 185 -194. 2. Johnson EM, Lanier WA, Merrill RM, et al. Unintentional Prescription Opioid-Related Overdose Deaths: Description of Decedents by Next of Kin or Best Contact, Utah, 2008 -2009. J Gen Intern Med. 2012 Oct 16.
Buprenorphine Experience in France • Introduced in the mid 90 s • 79% decline in OD deaths in 6 years • Use of mono product (not formulated with naloxone) associated with diversion and injection use Source: Auriacombe et al. French field experience with buprenorphine. Am J Addict. 2004
Summary • The U. S. is in the midst of a severe epidemic of opioid addiction • To bring the epidemic to an end: – We must prevent new cases of opioid addiction – We must ensure access to treatment for people already addicted