The Positive Muon as a Condensed Matter Probe

The Positive Muon as a Condensed Matter Probe Francis Pratt ISIS Facility, Rutherford Appleton Laboratory, UK

• Introduction The muon and its properties The range of m. SR techniques • Molecular Magnetism Critical behaviour in a layered magnet Spin fluctuations in a highly ideal 1 DHAF • Molecular Superconductors Stability of the vortex lattice Universal scaling of the electrodynamic response • Dynamical Processes in Polymers Charge mobility in polymers Polymer surface dynamics

Familiar Particles and Muons

Familiar Particles and Muons

Familiar Particles and Muons A positive muon behaves like an unstable light isotope of hydrogen

Primary International Facilities for m. SR TRIUMF ISIS PSI JPARC Continuous sources Pulsed sources

Producing Muons at ISIS 50 m

View of the ISIS Experimental Hall
 Pions produced from proton beam striking carbon")
The m. SR Sequence of Events 1) Pions produced from proton beam striking carbon target e. g. 2) Pion decay: p + p p + n + p+ p + n n + p+ p+ m++nm (lifetime 26 ns) the muons are 100% spin polarised 3) Muon implantation into sample of interest 4) Muons experience their local environment: spin precession and relaxation 5) Muon decay: m+ e++ne+nm (lifetime 2. 2 ms) we detect the asymmetric positron emission
; the muon")
Nature of the Muon Probe States Paramagnetic states Muonium (Mu = m+e); the muon analogue of the neutral hydrogen atom … highly reactive in many molecular systems, leading to the formation of molecular radicals, e. g. Diamagnetic states 1) Bare interstitial m+ 2) Chemically bonded closed shell states, e. g.
 Ionisation energy loss to below 35")
Formation of Muon Probe States m+ (Me. V) Ionisation energy loss to below 35 ke. V Radiolytic e- m+
 Ionisation energy loss")
Formation of Muon Probe States Charge exchange cycle m+ (Me. V) Ionisation energy loss to below 35 ke. V e- capture m+ 13. 5 e. V e- loss Radiolytic e- Mu
 Ionisation energy loss")
Formation of Muon Probe States Charge exchange cycle m+ (Me. V) Ionisation energy loss to below 35 ke. V Thermal Mu PARAMAGNETIC e- capture m+ 13. 5 e. V Mu e- loss Radiolytic e. Thermal m+ DIAMAGNETIC
 Ionisation energy loss")
Formation of Muon Probe States Charge exchange cycle m+ (Me. V) Ionisation energy loss to below 35 ke. V Thermal Mu PARAMAGNETIC e- capture m+ 13. 5 e. V Mu e- loss Chemical reaction Radiolytic e. Thermal m+ DIAMAGNETIC Mu Radical PARAMAGNETIC
 Ionisation energy loss")
Formation of Muon Probe States Charge exchange cycle m+ (Me. V) Ionisation energy loss to below 35 ke. V Thermal Mu PARAMAGNETIC e- capture m+ 13. 5 e. V Mu e- loss Delayed Mu formation Radiolytic em+ Thermal DIAMAGNETIC Ionization/ reaction Chemical reaction Mu Radical PARAMAGNETIC
 = 1+ a cos q")
Positron Emission and Detection W(q) = 1+ a cos q
 = 1+ a cos q LF/ZF B Sm F")
Positron Emission and Detection W(q) = 1+ a cos q LF/ZF B Sm F
 = 1+ a cos q LF/ZF B TF Sm")
Positron Emission and Detection W(q) = 1+ a cos q LF/ZF B TF Sm F B U Sm D F

Muon Instruments at ISIS

m. SRRRR… • Muon Spin Rotation • Muon Spin Relaxation • Muon Spin Resonance • Muon Spin Repolarisation

Muon Spin Rotation

Energy Levels

Energy Levels Single frequency w. D/2 p = 13. 55 k. Hz/G

Energy Levels

Energy Levels Pair of frequencies A = w 1 + w 2

Energy Levels

Energy Levels Still one pair of frequencies at high B A = w 1 + w 2

TF Muon Spin Rotation Spectoscopy of Muoniated Molecular Radicals 2 k. G TF TTF Singly occupied molecular orbital of muoniated radical Magn. Res. Chem. 38, S 27 (2000)

Muon Spin Relaxation

RF Resonance • B swept to match a level splitting with the RF frequency also • 90⁰ pulse techniques • Spin echoes • Spin Decoupling

Paramagnetic/Diamagnetic State Conversion measured with RF Polybutadiene above and below the Glass Transition T>Tg D → P T<Tg P → D

Level Crossing Resonance DM=1 m. LCR Resonances classified in terms of M = me + mm + mp DM = 1 muon spin flip: B 0 = Am / 2 gm (needs anisotropy) DM = 0 muon-proton spin flip-flop: B 0 = (Am- Ak ) / 2(gm- gk) (to first order)

Quadrupolar Level Crossing Resonance 14 N m+ quadrupolar m. LCR in TTF-TCNQ T>TCDW T<TCDW Quadrupolar splitting depends on electric field gradient at the nucleus

Repolarisation of Mu • • Progressive quenching of the muon spin from its dipolar and hyperfine couplings Useful for orientationally disordered systems with residual anisotropy

Repolarisation of Mu Quenching of the superhyperfine coupling to nuclear spins Sensitive to total number of spins e. g. protonation/deprotonation studies

Molecular Magnetism
 Mohamed Kurmoo, University of")
Critical Fluctuations in a Co Glycerolate Layered Magnet Co (S=3/2) Mohamed Kurmoo, University of Strasbourg

Critical Exponents Measured with m. SR Magnetic order: Local susceptibility: Relaxation rate: M (TN - T) b c (T - TN ) -g l | T -TN | -w

Comparison with Established Universality Classes Scaling relations: a = 2 – 2 b – g n = (2 b + g)/d Dynamic exponent: z = d(2 b + w)/(2 b + g) = 1. 25(6) h = 2 – g/n (c. f. z=d/2=1. 5 for 3 D AF)

Quantum Critical Fluctuations in a Highly Ideal Heisenberg Antiferromagnetic Chain Molecular radical providing the S=1/2 Heisenberg spins Structure of DEOCC-TCNQF 4 viewed along the chain axis Cyanine dye molecule providing the bulky diamagnetic spacers

Just How Ideal is DEOCC-TCNQF 4? Zero field muon spin relaxation for DEOCC-TCNQF 4 at 20 m. K and 1 K. Comparison of DEOCC-TCNQF 4 with other benchmark 1 DHAF magnets. J = 110 K but no LRMO down to 20 m. K ! i. e. TN / J < 2 x 10 -4

T-dependent Relaxation from Spinons T dependent m. SR relaxation rate l at 3 m. T with contributions from q=p/a and q=0. The 1 DHAF spin excitation spectrum contributing to l.

Anisotropic Spin Diffusion The B dependence of l at 1 K. The dotted line illustrates the behaviour expected for ballistic spin transport. The solid line is a fit to an anisotropic spin diffusion model. The form of the spin correlation function S(t) that is consistent with the data. Crossover between 1 D and 3 D diffusion takes place for time scales longer than ~10 ns.
 |J'| (m. K) J (K)")
Summary of 1 DHAF Magnetic Parameters TN (m. K) |J'| (m. K) J (K) TN/J (10 -2) |J'/J| (10 -3) Experiment Estimate <20 7 2. 2 <7 110 <0. 018 0. 006 0. 020 <0. 06 Sr 2 Cu. O 3 Cu. Pz. N KCu. F 3 5. 4 K 107 39 K 2 K 46 21 K 2200 10. 3 406 0. 25 1. 0 9. 6 0. 93 4. 4 52 DEOCC-TCNQF 4 looks like the best example of the 1 D Heisenberg Antiferromagnet yet discovered PRL 96, 247203 (2006)

Molecular Superconductors

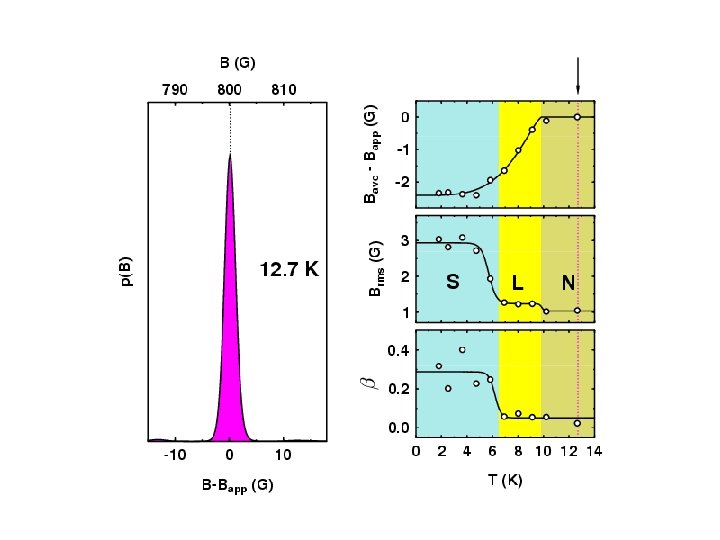
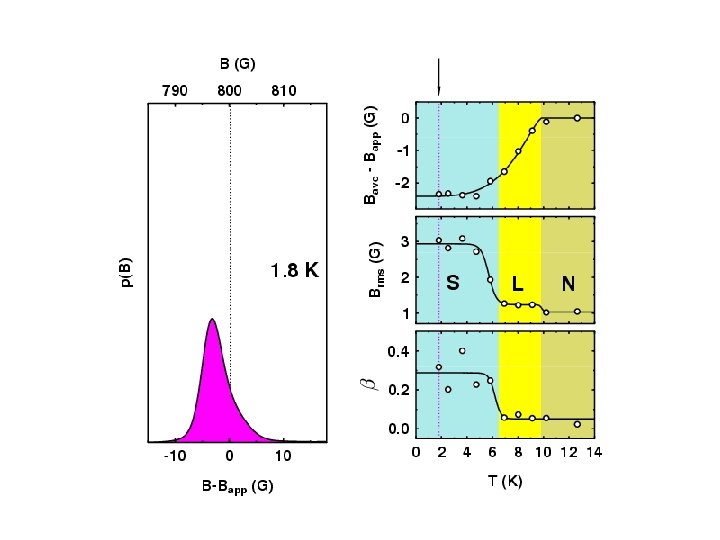
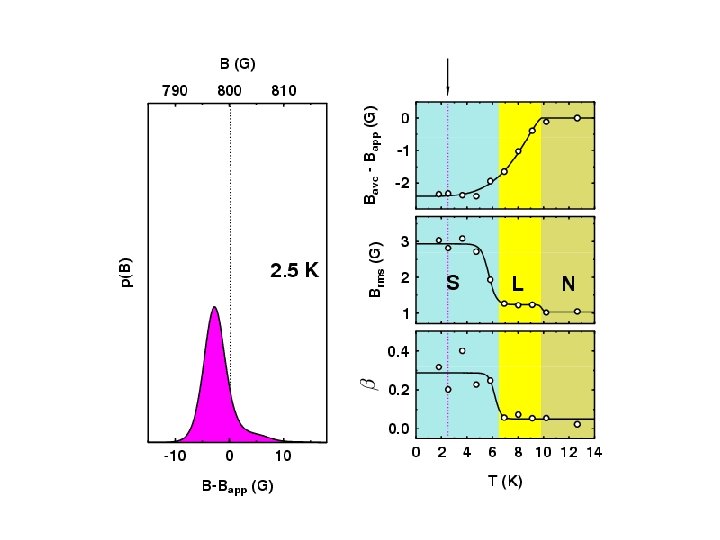
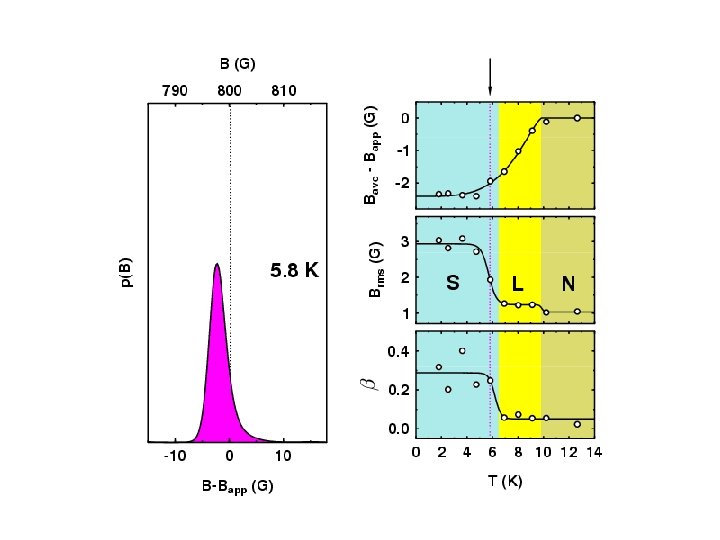
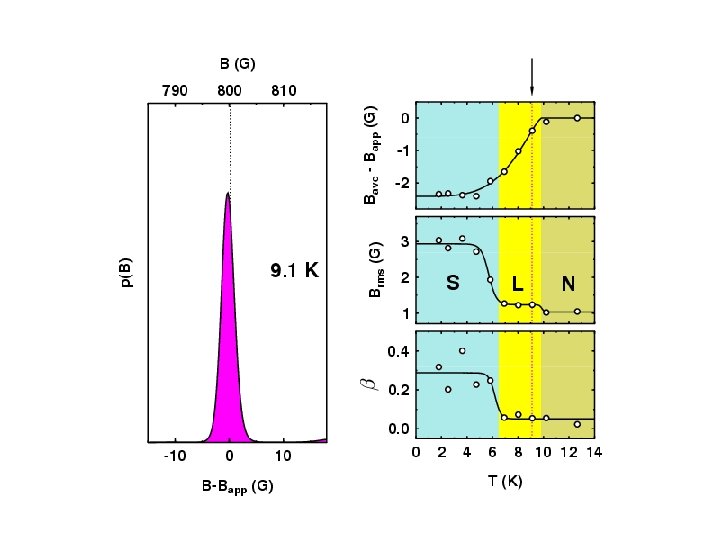
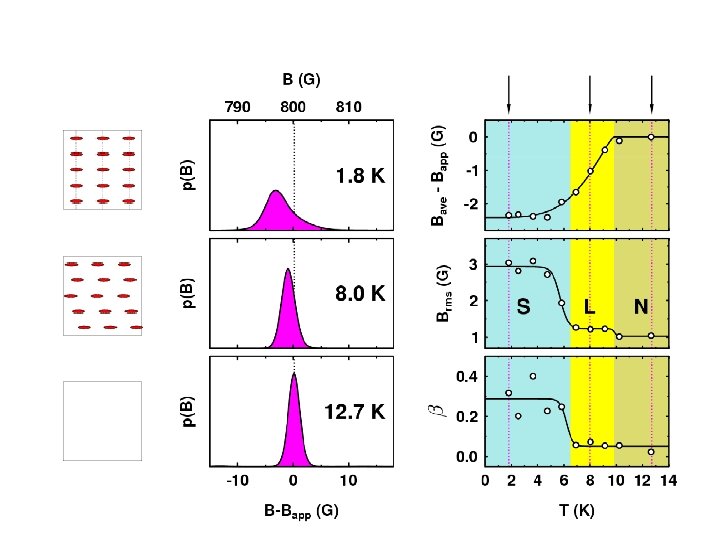
Measuring Properties of Type II Superconductors H < Hc 1 : Meissner state Surface measurement: l Abrikosov Vortex Lattice Hc 1 < Hc 2 : Vortex state Bulk measurement: l, x saddles RMS Width: Lineshape: (skewness) Brms or s b = (Bave - Bpk) / Brms minima cores

Muon Spin Rotation Spectrum
2 3 D")
Melting/Decoupling of the Vortex Lattice in the Organic Superconductor ET 2 Cu(SCN)2 3 D Flux Lattice Decoupled 2 D Layers


Overall Vortex Phase Diagrams d 8 -ETSCN h 8 -ETSCN

Scaling Properties in the Electrodynamic Response of Molecular Superconductors Famous ‘Uemura Plot’ for cuprates and other superconductors Tc s (m. SR relaxation rate) Equivalently: Tc ns/m* Tc rs (superfluid strength) Tc 1/l 2 (l is penetration depth) What about molecular superconductors? n/m* is small and doesn’t vary much, so they should sit in one small region of the plot

rs across the range of Molecular Superconductors

Uemura Plot for the Molecular Superconductors Molecular systems have their own empirical scaling law: Tc follows 1/l 3 rather than 1/l 2 ⇒ Tc (ns/mb) 3/2

Closer look at Superconducting Parameters vs Conductivity Note the completely opposite rs - s 0 scaling between molecular and cuprate superconductors Key: s 0 - 1. 05 s 0 - 0. 77 1. 2. 3. 4. 5. 6. 7. 8. k-BETS 2 Ga. Cl 4 2 D TMTSF 2 Cl. O 4 1 D a-ET 2 NH 4 Hg(SCN)4 2 D b-ET 2 IBr 2 2 D l-BETS 2 Ga. Cl 4 2 D k-ET 2 Cu(NCS)2 2 D K 3 C 60 3 D Rb 3 C 60 3 D 1 D, 2 D & 3 D systems SC properties correlate with highest s direction s 0+ 0. 75 PRL 94, 097006 (2005)

Is there a single controlling parameter? • The simplicity of the scaling suggests a single dominant control parameter • U/W is a likely candidate for molecular systems, which are generally rather close to a Mott insulator phase • Real pressure as well as ‘chemical pressure’ can be used to tune U/W • Increasing pressure decreases U/W, increases s 0 and decreases Tc and rs , following the trends expected from the scaling curves

Dynamical Mean-Field Theory for Calculating effect of U/W on rs Loss of quasiparticle spectral weight is expected as the Mott-Hubbard transition is approached
 Powell and")
Superfluid Strength vs U/W Merino and Mc. Kenzie PRB 61, 7996 (2000) Powell and Mc. Kenzie PRL 94, 047004 (2005) RVB DMFT rs Z Feldbacher et al, PRL 93, 136405 (2004) DMFT Experimental picture

Dynamical Processes in Polymers

Conducting Polymers Muon both generates a polaron and probes its motion, e. g. for PPV:

Diffusion and the Risch-Kehr Model Stochastic model describing muon relaxation due to intermittent hyperfine coupling with a diffusing polaron The relaxation function takes the form: (Risch-Kehr function) with the relaxation parameter G following a 1/B law at high field:

Polyaniline Data are well fitted by the Risch-Kehr function

Polyaniline 1/B law predicted by RK model is seen for G at higher B Cutoff at low B reflects interchain hopping

Polyaniline Effect of ring librational modes at higher temperatures

Two types of PPV polymer with different side chains Similar on-chain behaviour

Interchain Diffusion Rate D Inter-chain behaviour highly dependent on sidegroups
 muons penetrate ~1 -2 mm 10 -15% stopping")
Slow Muons Normal (4 Me. V) muons penetrate ~1 -2 mm 10 -15% stopping width, so thinnest sample is ~100 mm, (a bit less with flypast mode) For studying nanoscale structures and phenomena need muons with energies in the region of ke. V rather than Me. V Two methods for producing slow muons : 1) Degrading the energy in a cold moderator layer (PSI) 2) Laser ionization of thermal muonium (RIKEN-RAL)

Surface and Interface Dynamics in Polymers Surface Layer Model Substrate Bulk polymer Surface layer Supported polystyrene films (overlaid data from 6 groups using various different techniques) Forrest and Dalnoki-Veress, Adv. Coll. Int. Sci. 94, 167 (2001) Thin film properties dominated by higher mobility surface layer

Calculated Range for Muons in Polystyrene using TRIM. SP Surface Layer Model Substrate Bulk polymer Surface layer Thin film properties dominated by higher mobility surface layer
 Surface Layer")
Polystyrene Film Sample used for LEM Study PRB 72, R 121401 (2005) Surface Layer Model Mw = 62, 600, Mw/Mn=1. 04 Substrate 1 mm thick by 50 mm diameter copper substrate Bulk polymer Surface layer Film prepared by spin-coating from a 15% solution of PS in cyclohexanone Film thickness of 0. 46 mm was estimated from ellipsometry Thin film properties dominated by higher mobility surface layer

Measured ZF Relaxation in PS Surface Layer Model Substrate Bulk polymer Surface layer Thin film properties dominated by higher mobility surface layer

Measured Relaxation in the Bulk Polymer Model Fast fluctuation regime: Indirect coupling to segmental dynamics: WLF law for segmental dynamics:

Depth Scan at Tq Surface Layer Model d ~ 35 nm at Tq Substrate Bulk polymer Surface layer Thin film properties dominated by higher mobility surface layer
 follows from linear dispersion")
Size of the Surface Dynamical Region Surface melting model: d(T) follows from linear dispersion of surface capillary waves Herminghaus et al PRL 93, 017801 (2004)

Size of the Surface Dynamical Region Substrate Glassy polymer Molten layer T 1 Substrate Glassy polymer Molten layer T 2 Substrate Molten layer T 1 T 2 T 3 Surface melting model: d(T) follows from linear dispersion of surface capillary waves Herminghaus et al PRL 93, 017801 (2004)

Summary • Flexible local magnetic probe • Magnetism, superconductivity and various dynamical phenomena • Also applications in semiconductors and using the muon as a hydrogen analogue • Single crystal samples not essential • Overlap and complementarity with other techniques such as neutron scattering

Acknowledgements m. SR Steve Blundell Oxford Molecular Magnets Mohamed Kurmoo Strasbourg Seishi Takagi Kyushu Naoki Toyota Tohoku Molecular Superconductors & Takahiko Sasaki Polymers Slow Muons Steve Lee St. Andrews Andy Monkman Durham Andrew Holmes Cambridge Hazel Assender Oxford Elvezio Morenzoni PSI


Introduction to Muon Techniques For a short review see: S. J. Blundell, Contemp. Phys. 40, 175 (1999)
- Slides: 89