The Position vs Time Graph Motion graphs are


 to")


- Slides: 24
The Position vs. Time Graph • Motion graphs are an important tool used to show the relationships between position, speed, and time. A runner can learn more about performance by studying data and graphs.
The Position vs. Time Graph • • Position vs. time data tells you the runner’s position at different points in time. The runner is at 50 meters after 10 sec. , 100 meters after 20 sec. and 150 meters at 30 sec.
Graphs Show Relationships • • A good way to show a relationship between two variables is to use a graph. A graph makes it easy to see if changes in one variable cause changes in the other variable (the effect).
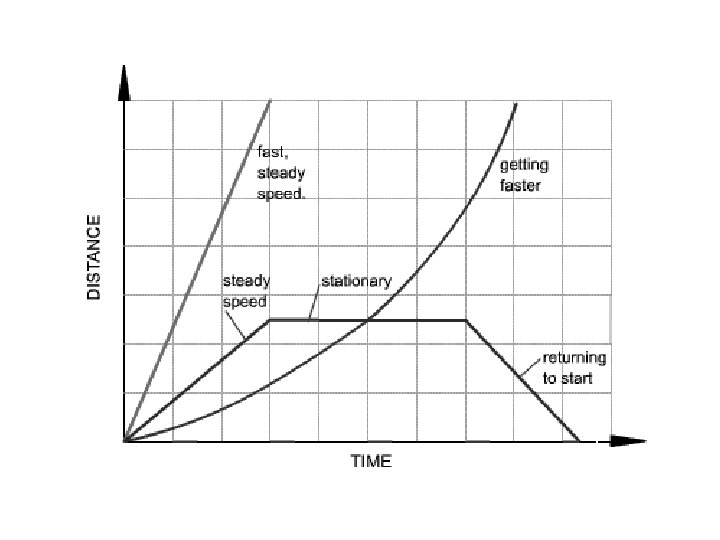
A straight line indicates… • Constant Speed Why is the line in a constant speed graph straight and diagonal? • The object is traveling the same distance in the same amount of time.
Slope • You can use position vs. time graphs to quickly compare the speeds of different objects. A steeper line on a position vs. time graph means a faster speed.
Comparing speeds on a Distance – Time Graph • Find the average speed of each line. • Compare the steepness of each line. The steeper line indicates: Faster Speeds
Slope • • The “steepness” of a line is called its slope. Visualize a triangle with the slope as the hypotenuse. The rise is equal to the height of the triangle. The run is equal to the length along the base of the triangle.
Slope • • The slope is the ratio of the “rise” (vertical change) to the “run” (horizontal change). The slope is therefore a distance divided by a time, which equals speed.
A curved line indicates… • Changing Speed
Distance-Time Graph and Changing Speed What do the different lines indicate when an object is changing speed? Downward Curve • Slowing down Horizontal Line • Stopping Upward Curve • Speeding Up
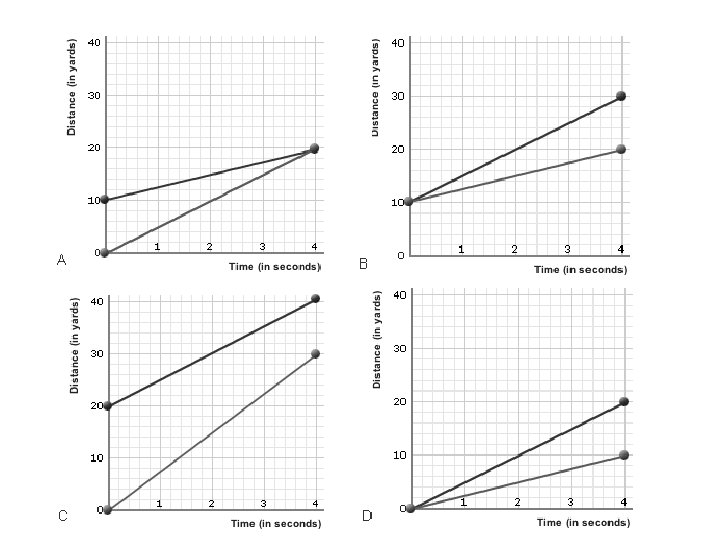
Examine the graphs… • Which graph shows that one of the runners started 10 yards further ahead of the other? • Explain you answer.
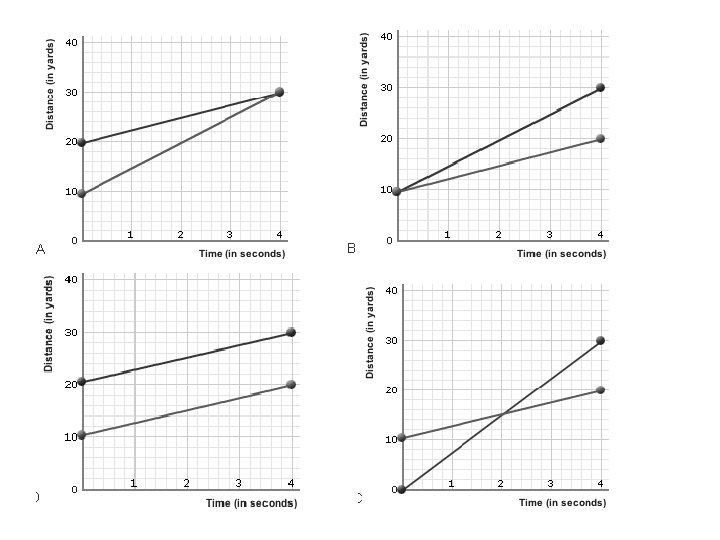
Examine the graphs… • In which of the following graphs are both runners moving at the same speed? • Explain your answer.
Graph A matches description _____ because _________________. Graph B matches description _____ because _________________. Graph C matches description _____ because _________________. Graph D matches description _____ because _________________.
Practice Constant Speed
Practice Changing Speed
Practice Average Speed B. Airplane C. Car D. Racehorse The distance-time graph shows the distance that eight different objects cover in 120 seconds or less. Each letter corresponds to a specific object. Figure out the correct average speed for each object. E. Bike Rider