The Population vs The Sample The population Number

The Population vs. The Sample The population Number = N Mean = m Standard deviation = s Cannot afford to measure parameters of the whole population We will likely never know these (population parameters - these are things that we want to know about in the population)

3 General Kinds of Sampling 1. Haphazard sampling – Based on convenience and/or self-selection – Street-corner interview, mall intercept interview – Television call-in surveys, questionnaires published in newspapers, magazines, or online – Problem: not rigorous, not systematic, not representative, not unbiased

3 General Kinds of Sampling 2. Quota sampling – Categories and proportions in the population – More representative than haphazard sampling – Interviewers have too much discretion 3. Probability sampling – A sample of a population in which each person has a known chance of being selected – Basically an equal chance at the start
 typically")
Size of a Probability Sample • Depends on: – Accuracy (margin of error) typically +/-3% – Confidence level: probability that the results are outside the specified level of accuracy – Variability: researchers usually assume maximum variability for a binomial variable • Does not depend on – Size of the total population

Sampling Technique in Surveys • Random sampling – Telephone surveys: random-digit dialing – Face-to-face surveys: too expensive and timeconsuming • Multistage cluster sampling – e. g. randomly choose 5 provinces, then 6 counties within each chosen province, and then 4 villages within each chosen county – Most practical for face-to-face surveys

The Population vs. The Sample The population Number = N Mean = m Standard deviation = s Cannot afford to measure parameters of the whole population So we draw a random sample. We will likely never know these (population parameters - these are things that we want to know about in the population)

The Population vs. The Sample The sample Sample size = n Sample mean = x Sample standard deviation = s Cannot afford to measure parameters of the whole population So we draw a random sample.

The Population vs. The Sample Does m = x? Probably not. We need to be confident that x does a good job of representing m. The population Number = N Mean = m Standard deviation = s The sample Sample size = n Sample mean = x Sample standard deviation = s

Connecting the Population Mean to the Sample Mean How closely does our sample mean resemble the population mean (a “population parameter” in which we are ultimately interested)? Population parameter = sample statistic + random sampling error (or “standard error”) Random sampling error = (variation component). or “standard error” (sample size component) Use a square-root function of sample size s = me asure of vari ation Standard error (OR random sampling error) = Population mean = x+ s. Ö (n-1) The sample Sample size = n Sample mean = x Sample standard deviation = s s. Ö (n-1) The population mean likely falls within some range around the sample mean— plus or minus a standard error or so.

To Compute Standard Deviation • Population standard deviation • Sample standard deviation

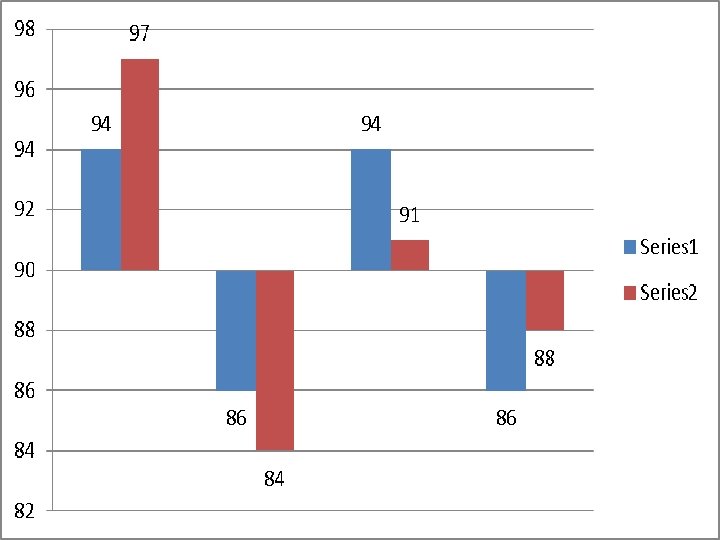
Why Use Squared Deviations? • Why not just use differences? – Student A’s exam scores/(Stock A’s prices): – 94, 86, 94, 86 • Why not just use absolute values? – Student B’s exam scores/(Stock B’s prices): – 97, 84, 91, 88 – Which one is more spread out /unstable /risky /volatile?

is the formula for: A. Population standard deviation B. Sample standard deviation C. Standard error D. Random sampling error E. Population mean
- Slides: 13