
The Participating Funding Arrangement PFA High Deductible Reimbursement
The Participating Funding Arrangement (PFA) High Deductible Reimbursement Models for Employers and Consumers
Where Claims Come From?
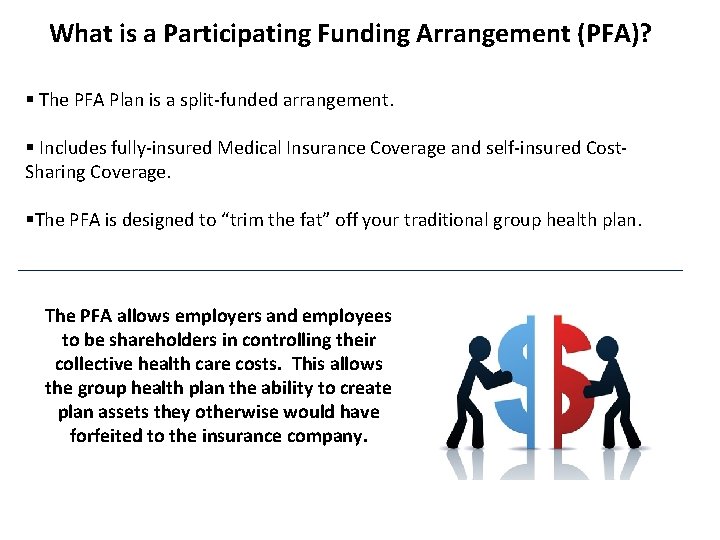
What is a Participating Funding Arrangement (PFA)? § The PFA Plan is a split-funded arrangement. § Includes fully-insured Medical Insurance Coverage and self-insured Cost. Sharing Coverage. §The PFA is designed to “trim the fat” off your traditional group health plan. The PFA allows employers and employees to be shareholders in controlling their collective health care costs. This allows the group health plan the ability to create plan assets they otherwise would have forfeited to the insurance company.
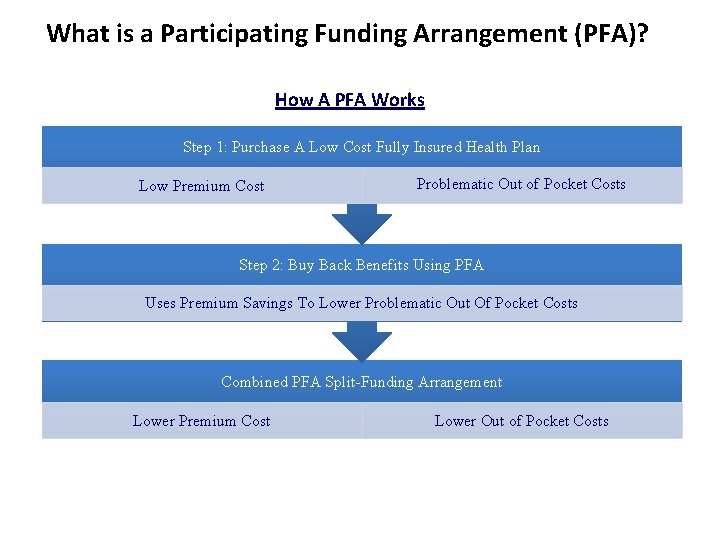
What is a Participating Funding Arrangement (PFA)? How A PFA Works Step 1: Purchase A Low Cost Fully Insured Health Plan Low Premium Cost Problematic Out of Pocket Costs Step 2: Buy Back Benefits Using PFA Uses Premium Savings To Lower Problematic Out Of Pocket Costs Combined PFA Split-Funding Arrangement Lower Premium Cost Lower Out of Pocket Costs
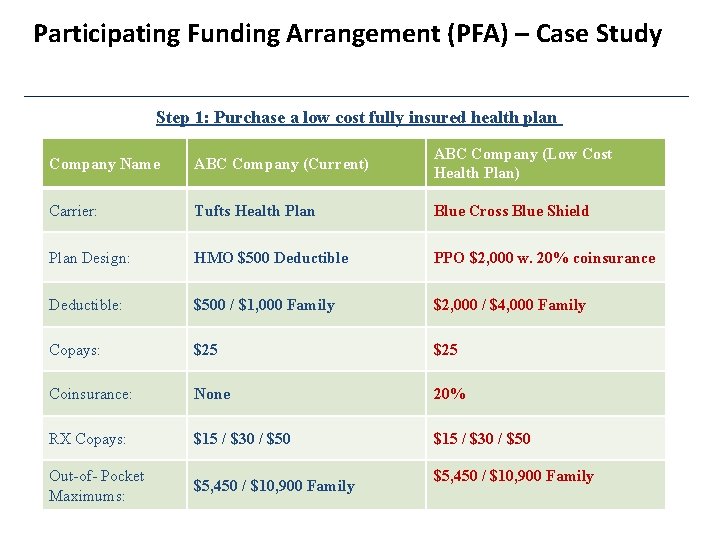
Participating Funding Arrangement (PFA) – Case Study Step 1: Purchase a low cost fully insured health plan Company Name ABC Company (Current) ABC Company (Low Cost Health Plan) Carrier: Tufts Health Plan Blue Cross Blue Shield Plan Design: HMO $500 Deductible PPO $2, 000 w. 20% coinsurance Deductible: $500 / $1, 000 Family $2, 000 / $4, 000 Family Copays: $25 Coinsurance: None 20% RX Copays: $15 / $30 / $50 Out-of- Pocket Maximums: $5, 450 / $10, 900 Family
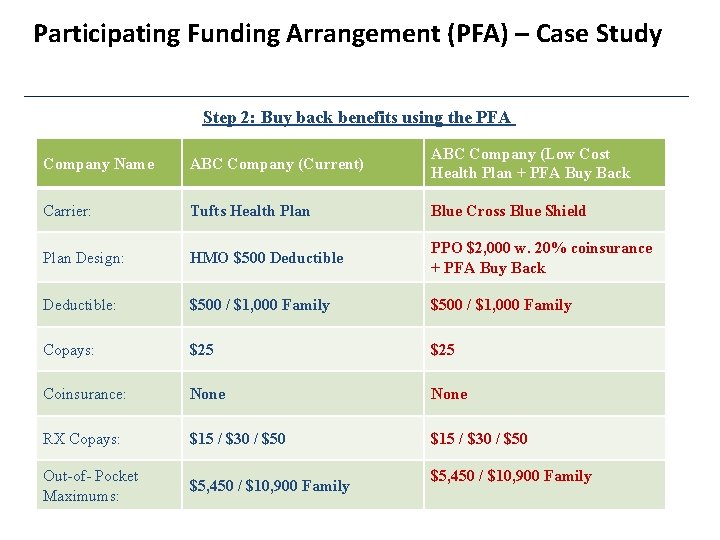
Participating Funding Arrangement (PFA) – Case Study Step 2: Buy back benefits using the PFA Company Name ABC Company (Current) ABC Company (Low Cost Health Plan + PFA Buy Back Carrier: Tufts Health Plan Blue Cross Blue Shield Plan Design: HMO $500 Deductible PPO $2, 000 w. 20% coinsurance + PFA Buy Back Deductible: $500 / $1, 000 Family Copays: $25 Coinsurance: None RX Copays: $15 / $30 / $50 Out-of- Pocket Maximums: $5, 450 / $10, 900 Family

Participating Funding Arrangement (PFA) – Case Study Sold PFA Plan Design & Premium Costs – Combined Savings Combined PFA Savings Analysis PPO $2, 000 w. 20% coinsurance Premium $660, 000. 00 PFA Expected Premium (Claims + Administration) $156, 570. 00 Combined Premium Costs $816, 570. 00 Current Tufts Health Plan Premium $880, 000. 00 PFA Savings $63, 430. 00 (Under Current Premium)

Participating Funding Arrangement (PFA) – Case Study PFA Premium Comparison $ 900, 000. 00 $ 880, 000. 00 $ 860, 000. 00 Traditional $500 Deductible Plan $ 880, 000. 00 $ 840, 000. 00 $ 820, 000. 00 $ 817, 000. 00 $ 800, 000. 00 PFA $500 Deductible Plan $ 780, 000. 00 $ 760, 000. 00 $ 740, 000. 00 $ 720, 000. 00 $ 700, 000. 00 Traditional $500 Deductible Plan PFA $500 Deductible Plan
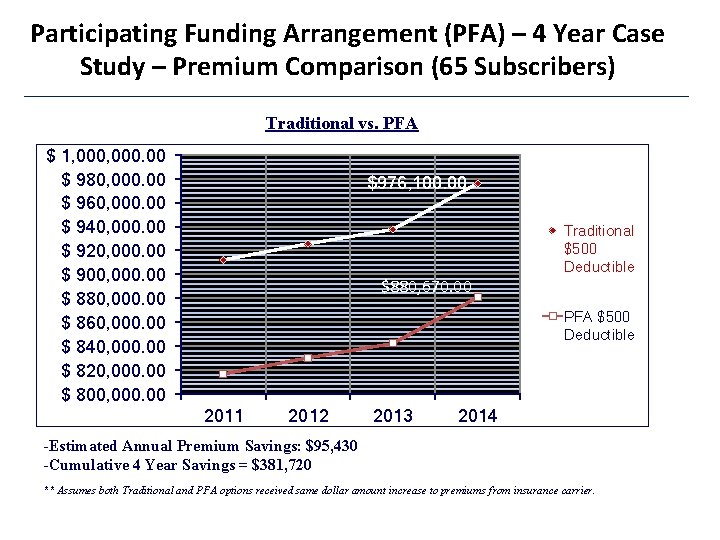
Participating Funding Arrangement (PFA) – 4 Year Case Study – Premium Comparison (65 Subscribers) Traditional vs. PFA $ 1, 000. 00 $ 980, 000. 00 $ 960, 000. 00 $ 940, 000. 00 $ 920, 000. 00 $ 900, 000. 00 $ 880, 000. 00 $ 860, 000. 00 $ 840, 000. 00 $ 820, 000. 00 $ 800, 000. 00 $976, 100. 00 $880, 670. 00 Traditional $500 Deductible PFA $500 Deductible 2011 2012 2013 2014 -Estimated Annual Premium Savings: $95, 430 -Cumulative 4 Year Savings = $381, 720 ** Assumes both Traditional and PFA options received same dollar amount increase to premiums from insurance carrier.
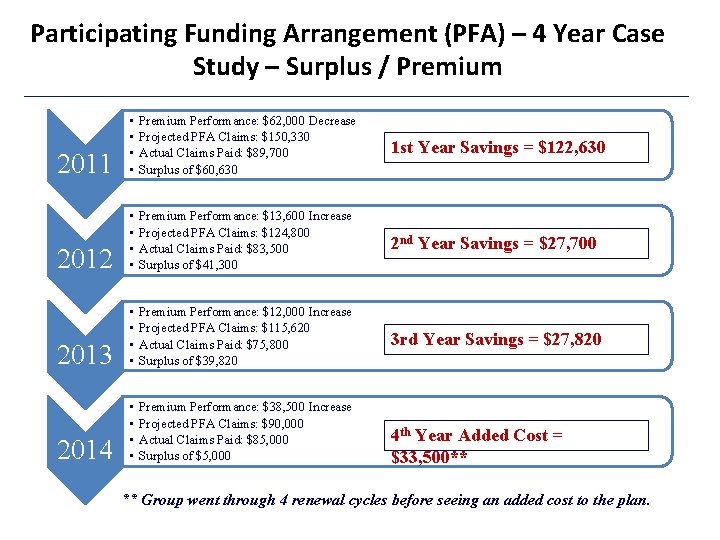
Participating Funding Arrangement (PFA) – 4 Year Case Study – Surplus / Premium 2011 • • Premium Performance: $62, 000 Decrease Projected PFA Claims: $150, 330 Actual Claims Paid: $89, 700 Surplus of $60, 630 1 st Year Savings = $122, 630 2012 • • Premium Performance: $13, 600 Increase Projected PFA Claims: $124, 800 Actual Claims Paid: $83, 500 Surplus of $41, 300 2 nd Year Savings = $27, 700 2013 • • Premium Performance: $12, 000 Increase Projected PFA Claims: $115, 620 Actual Claims Paid: $75, 800 Surplus of $39, 820 3 rd Year Savings = $27, 820 2014 • • Premium Performance: $38, 500 Increase Projected PFA Claims: $90, 000 Actual Claims Paid: $85, 000 Surplus of $5, 000 4 th Year Added Cost = $33, 500** ** Group went through 4 renewal cycles before seeing an added cost to the plan.
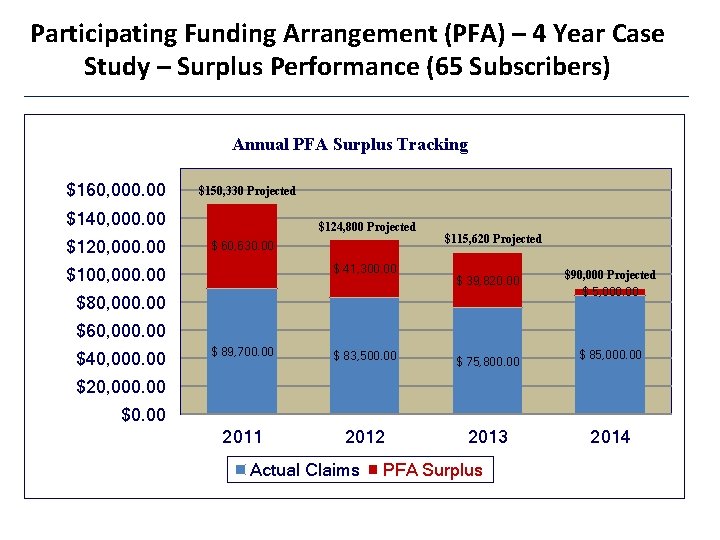
Participating Funding Arrangement (PFA) – 4 Year Case Study – Surplus Performance (65 Subscribers) Annual PFA Surplus Tracking $160, 000. 00 $150, 330 Projected $140, 000. 00 $124, 800 Projected $ 60, 630. 00 $ 41, 300. 00 $100, 000. 00 $115, 620 Projected $ 39, 820. 00 $80, 000. 00 $90, 000 Projected $ 5, 000. 00 $60, 000. 00 $40, 000. 00 $ 89, 700. 00 $ 83, 500. 00 $ 75, 800. 00 2011 2012 2013 $ 85, 000. 00 $20, 000. 00 $0. 00 Actual Claims PFA Surplus 2014
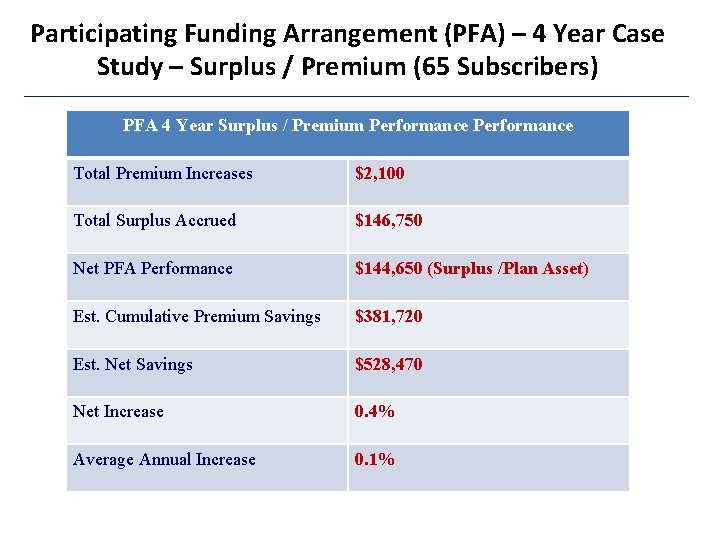
Participating Funding Arrangement (PFA) – 4 Year Case Study – Surplus / Premium (65 Subscribers) PFA 4 Year Surplus / Premium Performance Total Premium Increases $2, 100 Total Surplus Accrued $146, 750 Net PFA Performance $144, 650 (Surplus /Plan Asset) Est. Cumulative Premium Savings $381, 720 Est. Net Savings $528, 470 Net Increase 0. 4% Average Annual Increase 0. 1%
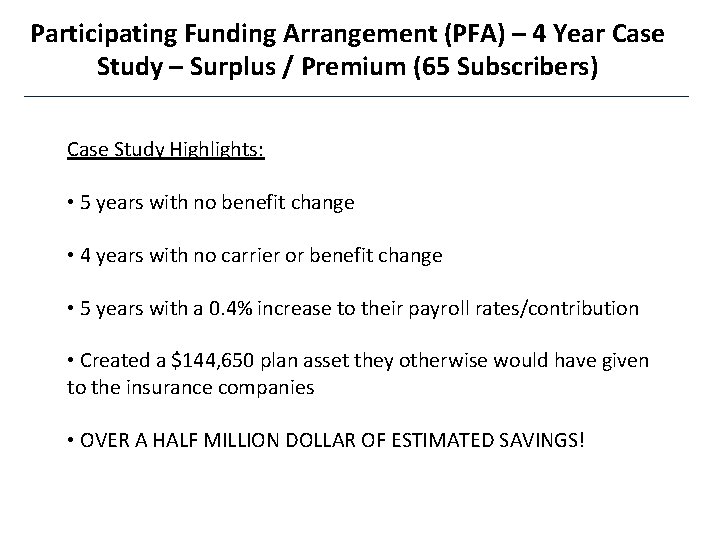
Participating Funding Arrangement (PFA) – 4 Year Case Study – Surplus / Premium (65 Subscribers) Case Study Highlights: • 5 years with no benefit change • 4 years with no carrier or benefit change • 5 years with a 0. 4% increase to their payroll rates/contribution • Created a $144, 650 plan asset they otherwise would have given to the insurance companies • OVER A HALF MILLION DOLLAR OF ESTIMATED SAVINGS!
3 “ROI” Based Reimbursement Strategies Employers Can Implement NOW To Reduce Health Care Costs Reimbursement Specialists, Inc. A Comprehensive Benefit Administrators Company
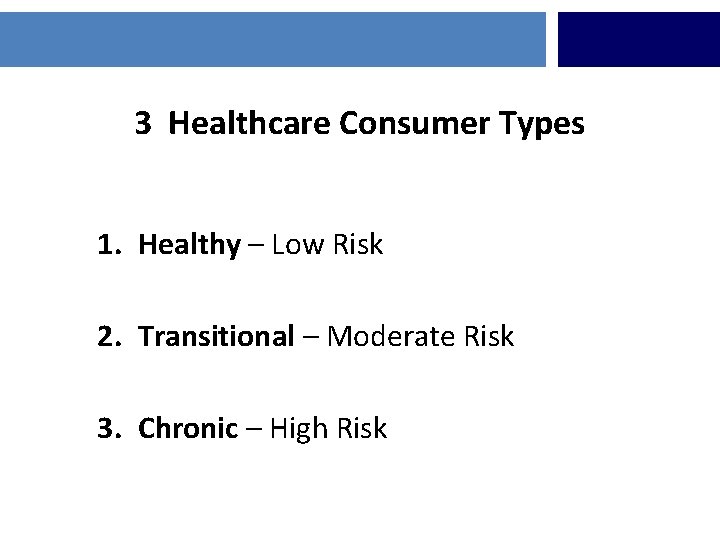
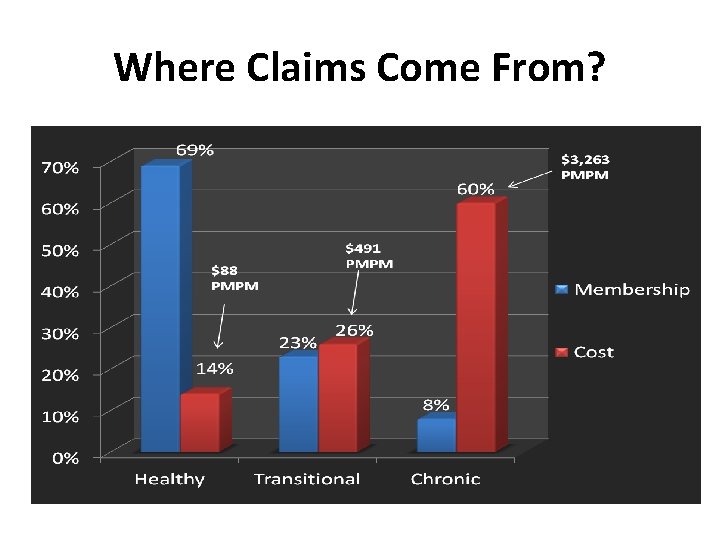
3 Healthcare Consumer Types 1. Healthy – Low Risk 2. Transitional – Moderate Risk 3. Chronic – High Risk
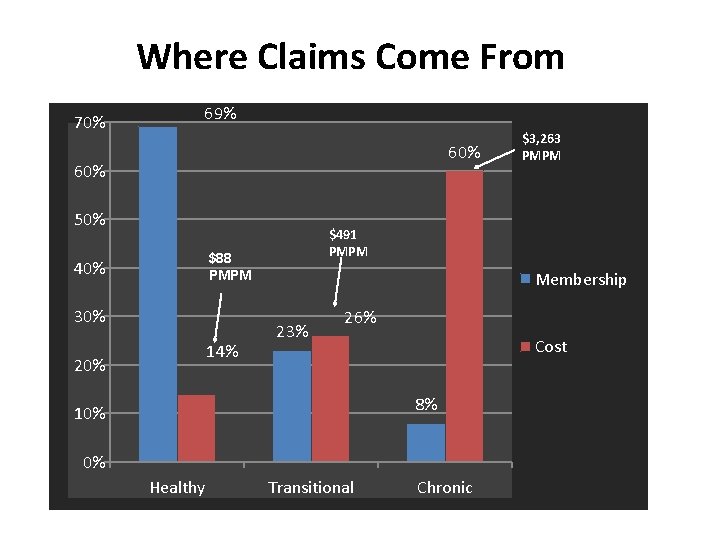
Where Claims Come From 70% 69% 60% 50% $491 PMPM $88 PMPM 40% 30% 14% 20% Membership 23% 26% Cost 8% 10% 0% Healthy $3, 263 PMPM Transitional Chronic
One Size Doesn’t Fit ALL • There is no silver bullet to controlling health care costs. • You need multiple strategies and tools working in synergy with the traditional health insurance AND medical delivery system. • You need to impact all 3 consumer types in order to effect costs in a meaningful way.
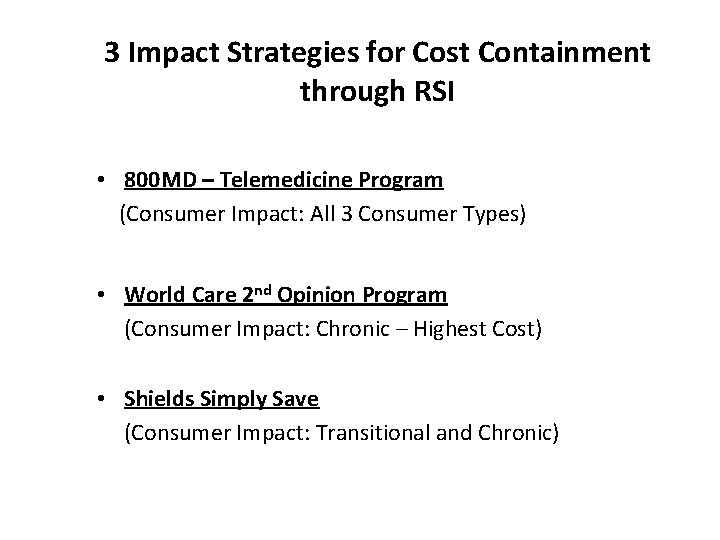
3 Impact Strategies for Cost Containment through RSI • 800 MD – Telemedicine Program (Consumer Impact: All 3 Consumer Types) • World Care 2 nd Opinion Program (Consumer Impact: Chronic – Highest Cost) • Shields Simply Save (Consumer Impact: Transitional and Chronic)
800 MD - Telemedicine • 70% of Office Visits can be handled via Telemedicine • According to the US Census Bureau the average working-aged adult has 3. 9 visits per year. • According to the Agency for Healthcare Research and Quality, an average visit to a doctor’s office costs $199 and an outpatient hospital visit is $1, 275. • Weighted average cost = $240 Per Visit. • Average cost of Telemedicine = $38 Consult Fee AND is not run through traditional insurance.
800 MD Cost Containment Goal: Change the Delivery System • 3 years for full implementation with employees. • Impact 1 out of every 5 office visits. • Employer Pays the full $38 Charge for 800 MD Consult Fee (Optional and Flexible) Sample Company: (200 Employees with 400 Members) - Total Annual Premium = $2, 000 - 400 x 3. 9 visits = 1560 visits per year - 1560 / 5 = 312 visits - 312 visits x $240 = $74, 880 - 312 visit x $38 = -$11, 856 Total Estimated Savings = $63, 024 **Savings is the equivalent to removing a high claimant off of your “Large Loss Report” or 3. 2% of total Premium
World Care 2 nd Opinion • Get it right the first time. • 15% of the time diagnosis changes. • 70% of the time treatment modified. • Eliminates the waste on high cost treatments. • 8 working day average turnaround time.
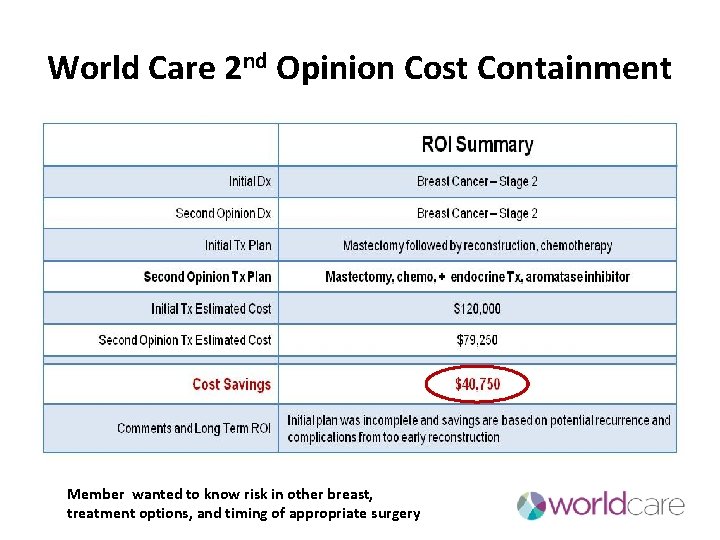
World Care 2 nd Opinion Cost Containment Member wanted to know risk in other breast, treatment options, and timing of appropriate surgery
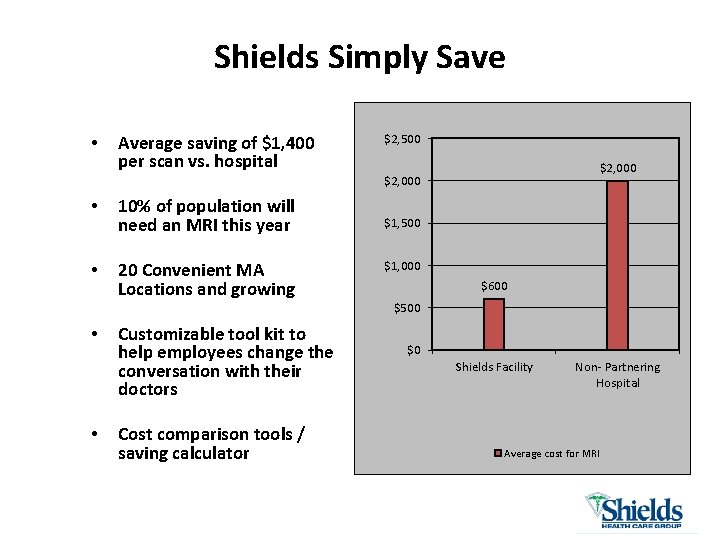
Shields Simply Save • Average saving of $1, 400 per scan vs. hospital $2, 500 $2, 000 • 10% of population will need an MRI this year • 20 Convenient MA Locations and growing • • Customizable tool kit to help employees change the conversation with their doctors Cost comparison tools / saving calculator $1, 500 $1, 000 $600 $500 $0 Shields Facility Non- Partnering Hospital Average cost for MRI
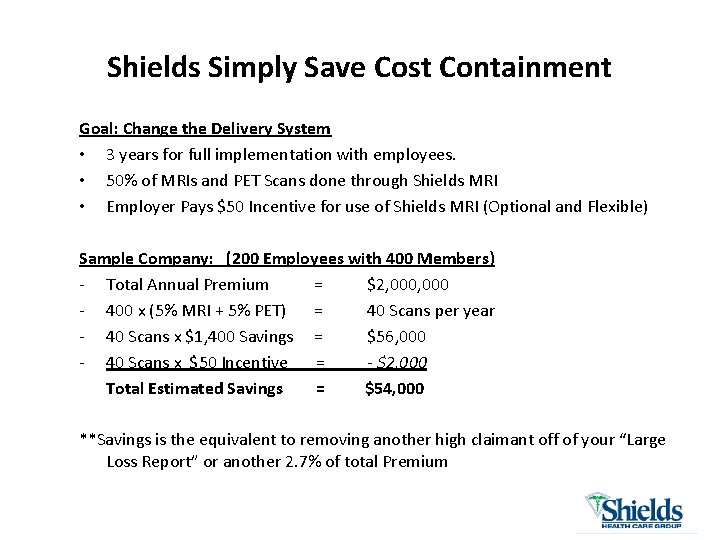
Shields Simply Save Cost Containment Goal: Change the Delivery System • 3 years for full implementation with employees. • 50% of MRIs and PET Scans done through Shields MRI • Employer Pays $50 Incentive for use of Shields MRI (Optional and Flexible) Sample Company: (200 Employees with 400 Members) - Total Annual Premium = $2, 000 - 400 x (5% MRI + 5% PET) = 40 Scans per year - 40 Scans x $1, 400 Savings = $56, 000 - 40 Scans x $50 Incentive = - $2, 000 Total Estimated Savings = $54, 000 **Savings is the equivalent to removing another high claimant off of your “Large Loss Report” or another 2. 7% of total Premium
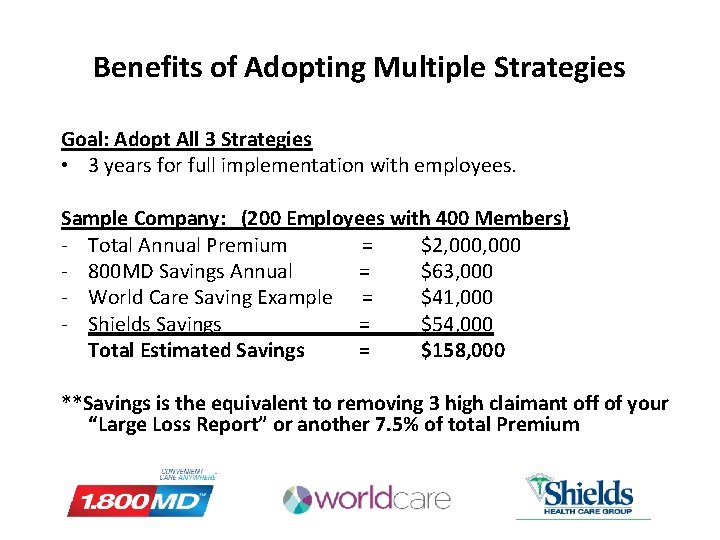
Benefits of Adopting Multiple Strategies Goal: Adopt All 3 Strategies • 3 years for full implementation with employees. Sample Company: (200 Employees with 400 Members) - Total Annual Premium = $2, 000 - 800 MD Savings Annual = $63, 000 - World Care Saving Example = $41, 000 - Shields Savings = $54, 000 Total Estimated Savings = $158, 000 **Savings is the equivalent to removing 3 high claimant off of your “Large Loss Report” or another 7. 5% of total Premium
Questions ?
Thank You! Michael Mc. Kenna President and CEO Comprehensive Benefit Administrators 93 Longwater Circle Norwell, Ma 02061 Toll Free: (877) 993 -5600 ext. 207 Fax: (774) 463 -0208 mmckenna@cbacompanies. com
- Slides: 27