
THE OPTICAL MODULE OF THE BAIKALGVD Aleksei Sheifler

THE OPTICAL MODULE OF THE BAIKAL-GVD Aleksei Sheifler VLVνT-2015 in Roma, Italy 14 September
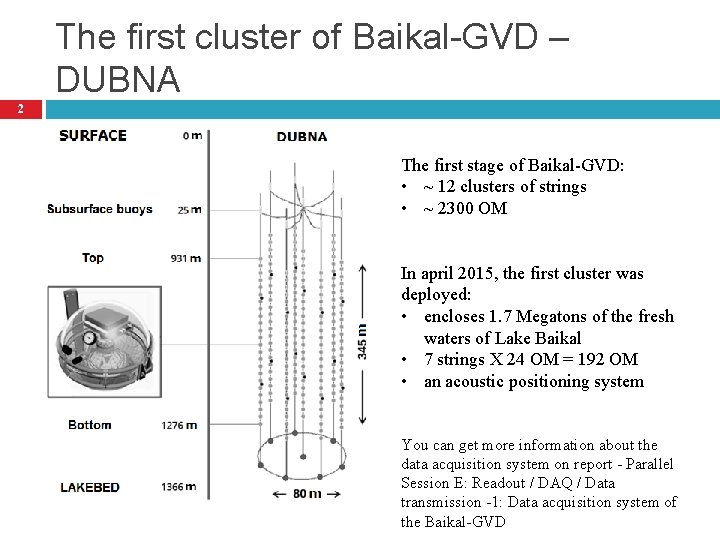
The first cluster of Baikal-GVD – DUBNA 2 The first stage of Baikal-GVD: • ~ 12 clusters of strings • ~ 2300 OM In april 2015, the first cluster was deployed: • encloses 1. 7 Megatons of the fresh waters of Lake Baikal • 7 strings X 24 OM = 192 OM • an acoustic positioning system You can get more information about the data acquisition system on report - Parallel Session E: Readout / DAQ / Data transmission -1: Data acquisition system of the Baikal-GVD
Plan 3 Design, components, basic characteristics, tests of the main components. Optical module integration test: � test facility, inspection procedures, � results. You can get more information about the time and amplitude calibration on report - Parallel Session F: Time and amplitude calibration of the Baikal. GVD neutrino telescope Conclusion.
4 Design components, basic characteristics, tests of the main components
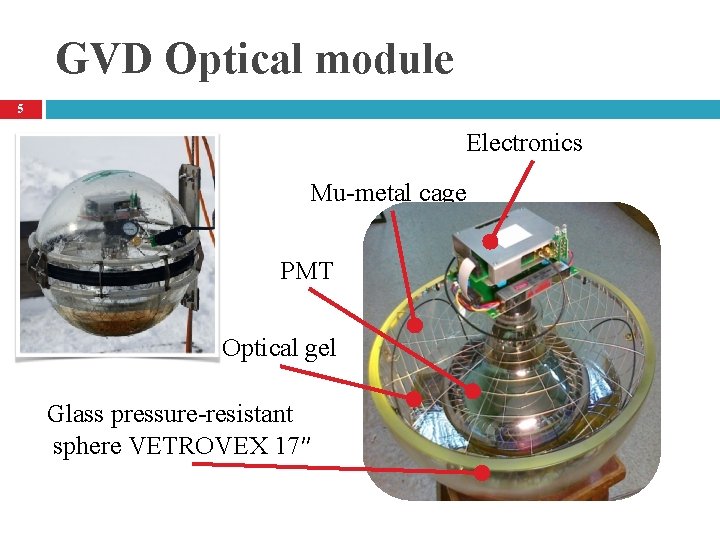
GVD Optical module 5 Electronics Mu-metal cage PMT Optical gel Glass pressure-resistant sphere VETROVEX 17″
Electronics 6
Electronics 7 2 -channel amplifier: Output channel and PMT noise monitoring channel.
Electronics 8 Test pulse is mixed with PMT signals. 2 LEDs L 7113: 470 nm, ~6 ns - Intensities regulation: 1…~108 photons - Flashes delay regulation: 0 … 1000 ns
Electronics 9 Control of electronics operation and monitoring of PMT parameters is carried out via bus RS-485 interface.
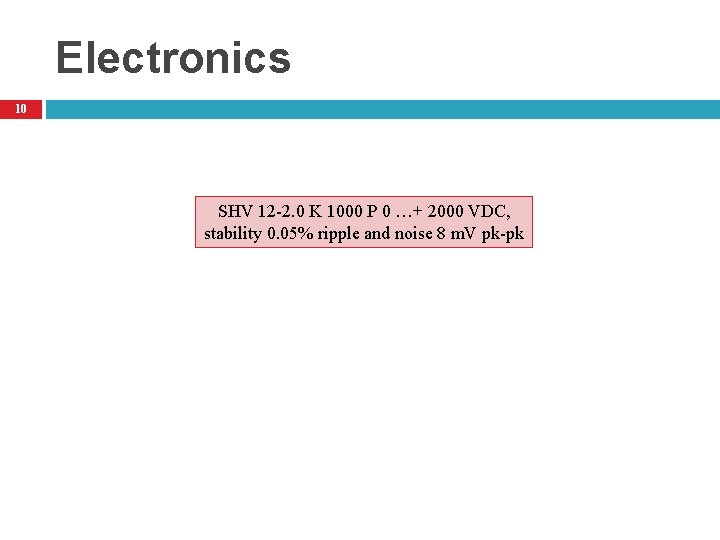
Electronics 10 SHV 12 -2. 0 K 1000 P 0 …+ 2000 VDC, stability 0. 05% ripple and noise 8 m. V pk-pk
Electronics 11 Power consumption – max 0. 3 A, 12 V
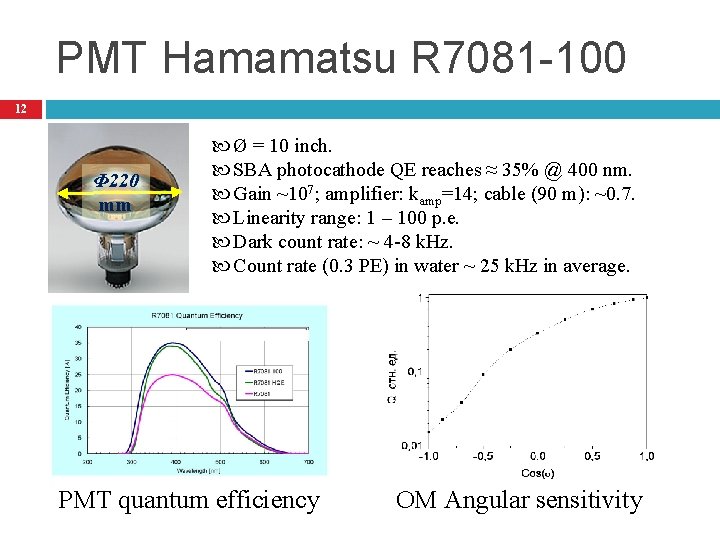
PMT Hamamatsu R 7081 -100 12 Φ 220 mm Ø = 10 inch. SBA photocathode QE reaches ≈ 35% @ 400 nm. Gain ~107; amplifier: kamp=14; cable (90 m): ~0. 7. Linearity range: 1 – 100 p. e. Dark count rate: ~ 4 -8 k. Hz. Count rate (0. 3 PE) in water ~ 25 k. Hz in average. PMT quantum efficiency OM Angular sensitivity
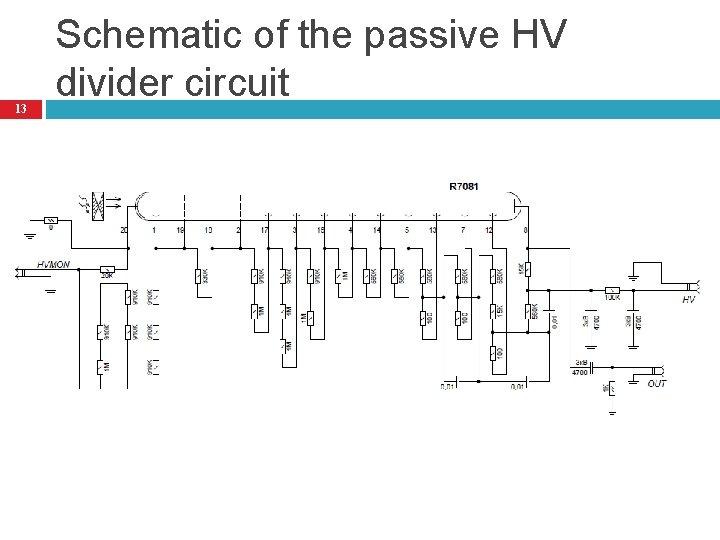
13 Schematic of the passive HV divider circuit
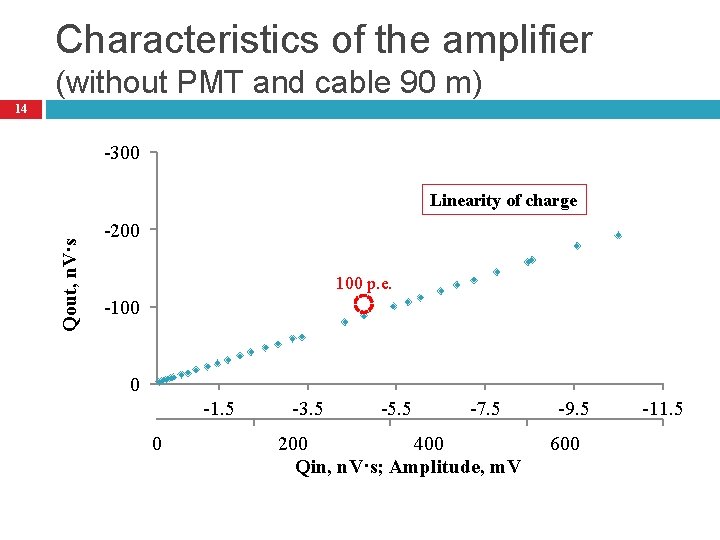
Characteristics of the amplifier (without PMT and cable 90 m) 14 -300 Qout, n. V·s Linearity of charge -200 100 p. e. -100 0 -1. 5 0 -3. 5 -5. 5 -7. 5 200 400 Qin, n. V·s; Amplitude, m. V -9. 5 600 -11. 5
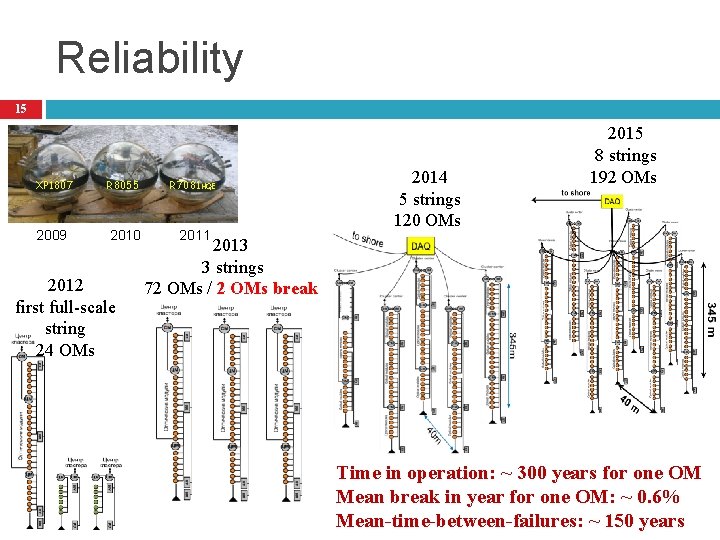
Reliability 15 XP 1807 R 8055 R 7081 HQE 2009 2010 2011 2012 first full-scale string 24 ОМs 2014 5 strings 120 OMs 2015 8 strings 192 OMs 2013 3 strings 72 OMs / 2 OMs break Time in operation: ~ 300 years for one OM Mean break in year for one OM: ~ 0. 6% Mean-time-between-failures: ~ 150 years
16 Checking the assembled optical module • • • test facility inspection procedures results
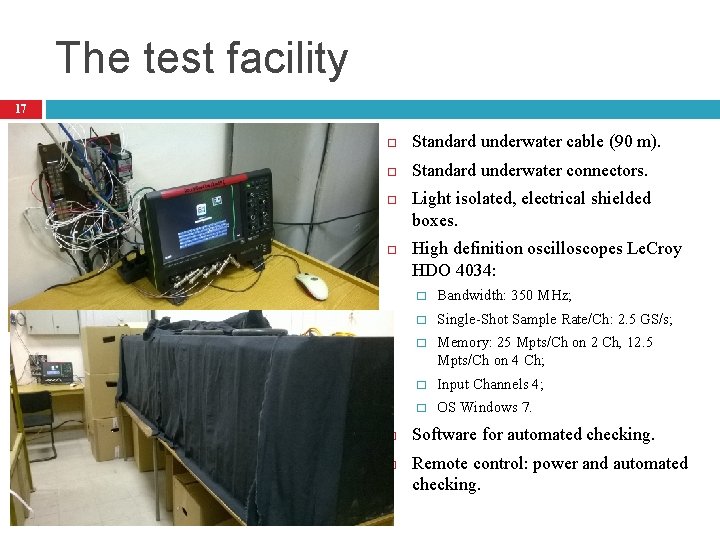
The test facility 17 Standard underwater cable (90 m). Standard underwater connectors. Light isolated, electrical shielded boxes. High definition oscilloscopes Le. Croy HDO 4034: � Bandwidth: 350 MHz; � Single-Shot Sample Rate/Ch: 2. 5 GS/s; � Memory: 25 Mpts/Ch on 2 Ch, 12. 5 Mpts/Ch on 4 Ch; � Input Channels 4; � OS Windows 7. Software for automated checking. Remote control: power and automated checking.
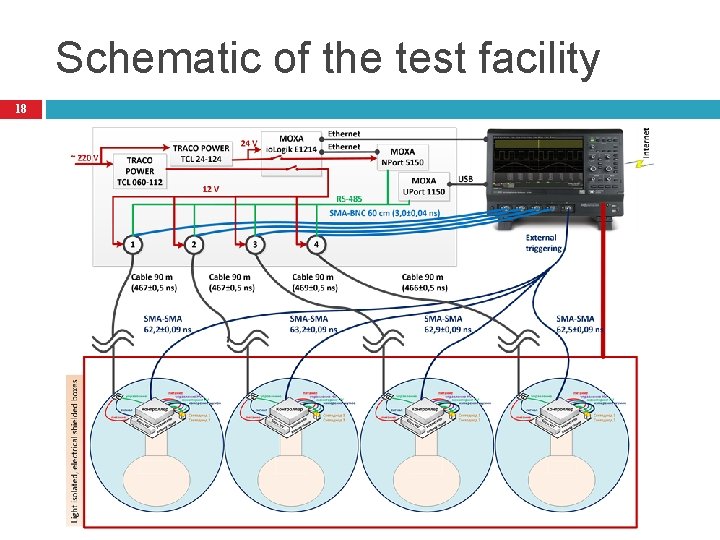
Schematic of the test facility 18
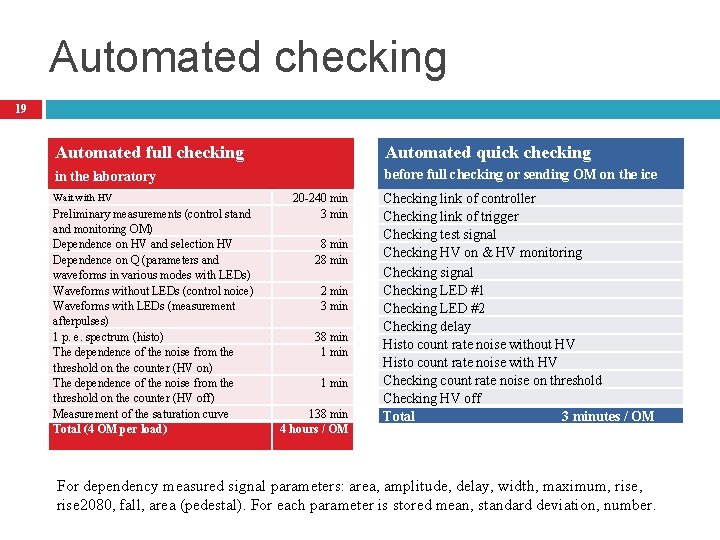
Automated checking 19 Automated full checking Automated quick checking in the laboratory before full checking or sending OM on the ice Wait with HV Preliminary measurements (control stand monitoring OM) Dependence on HV and selection HV Dependence on Q (parameters and waveforms in various modes with LEDs) Waveforms without LEDs (control noice) Waveforms with LEDs (measurement afterpulses) 1 p. e. spectrum (histo) The dependence of the noise from the threshold on the counter (HV on) The dependence of the noise from the threshold on the counter (HV off) Measurement of the saturation curve Total (4 OM per load) 20 -240 min 3 min 8 min 2 min 38 min 138 min 4 hours / ОМ Checking link of controller Checking link of trigger Checking test signal Checking HV on & HV monitoring Checking signal Checking LED #1 Checking LED #2 Checking delay Histo count rate noise without HV Histo count rate noise with HV Checking count rate noise on threshold Checking HV off Total 3 minutes / OM For dependency measured signal parameters: area, amplitude, delay, width, maximum, rise 2080, fall, area (pedestal). For each parameter is stored mean, standard deviation, number.
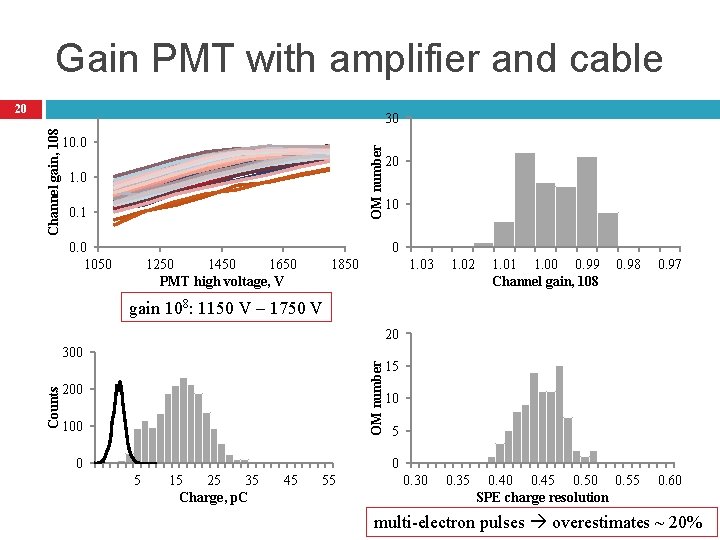
Gain PMT with amplifier and cable 20 10. 0 OM number Channel gain, 108 30 1. 0 0. 1 0. 0 1050 20 10 0 1250 1450 1650 PMT high voltage, V 1850 1. 03 1. 02 1. 01 1. 00 0. 99 Channel gain, 108 0. 97 0. 40 0. 45 0. 50 0. 55 SPE charge resolution 0. 60 gain 108: 1150 V – 1750 V -6. 2 13. 8 33. 8 20 53. 8 OM number Counts 300 200 100 0 15 10 5 15 25 35 Charge, p. C 45 55 0. 30 0. 35 multi-electron pulses overestimates ~ 20%
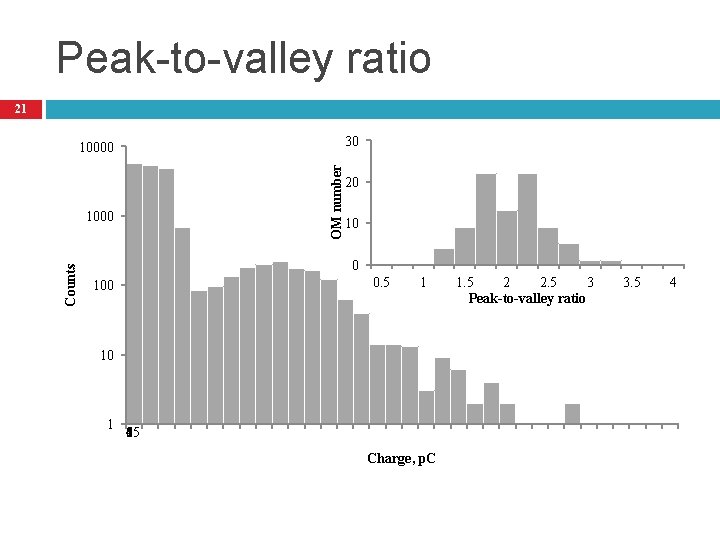
Peak-to-valley ratio 21 30 OM number 10000 Counts 1000 20 10 0 0. 5 100 1 10 1 565 15 25 35 45 55 Charge, p. C 1. 5 2 2. 5 3 Peak-to-valley ratio 3. 5 4
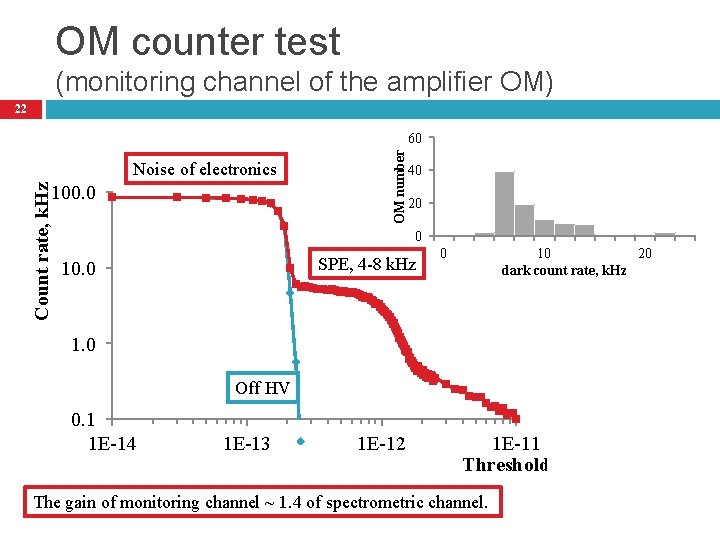
OM counter test (monitoring channel of the amplifier OM) 22 Noise of electronics Count rate, k. Hz 100. 0 OM number 60 40 20 0 SPE, 4 -8 k. Hz 10. 0 0 10 20 dark count rate, k. Hz 1. 0 Off HV 0. 1 1 E-14 1 E-13 1 E-12 1 E-11 Threshold, m. V The gain of monitoring channel ~ 1. 4 of spectrometric channel.
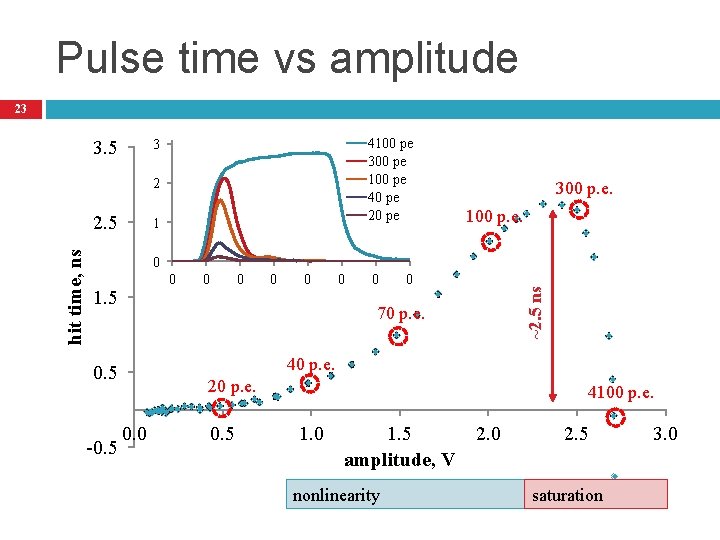
Pulse time vs amplitude 23 3. 5 4100 pe 300 pe 100 pe 40 pe 20 pe 3 2 1 100 p. e. 0 0 1. 5 0 0 0 70 p. e. 40 p. e. 0. 5 -0. 5 0 ~2. 5 ns hit time, ns 2. 5 300 p. e. 20 p. e. 0. 0 0. 5 4100 p. e. 1. 0 1. 5 amplitude, V nonlinearity 2. 0 2. 5 saturation 3. 0
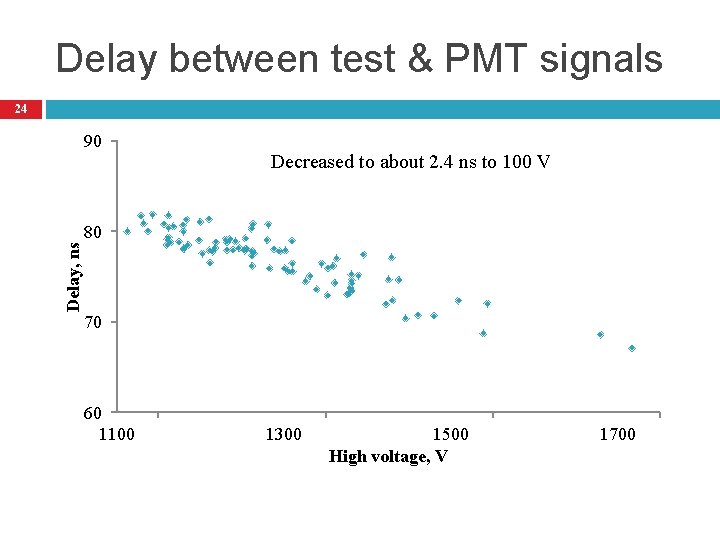
Delay between test & PMT signals 24 Delay, ns 90 Decreased to about 2. 4 ns to 100 V 80 70 60 1100 1300 1500 High voltage, V 1700
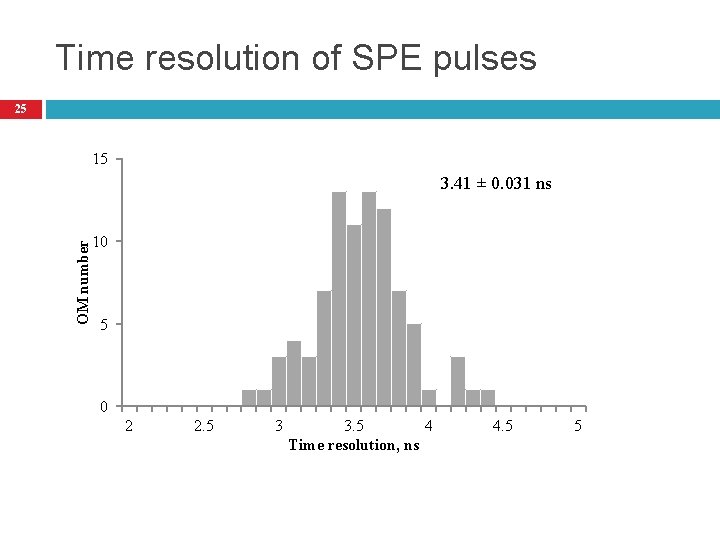
Time resolution of SPE pulses 25 15 OM number 3. 41 ± 0. 031 ns 10 5 0 2 2. 5 3 3. 5 4 Time resolution, ns 4. 5 5
26 Afterpulse Due to ionization of residual gases by electrons accelerated in the space between dynodes
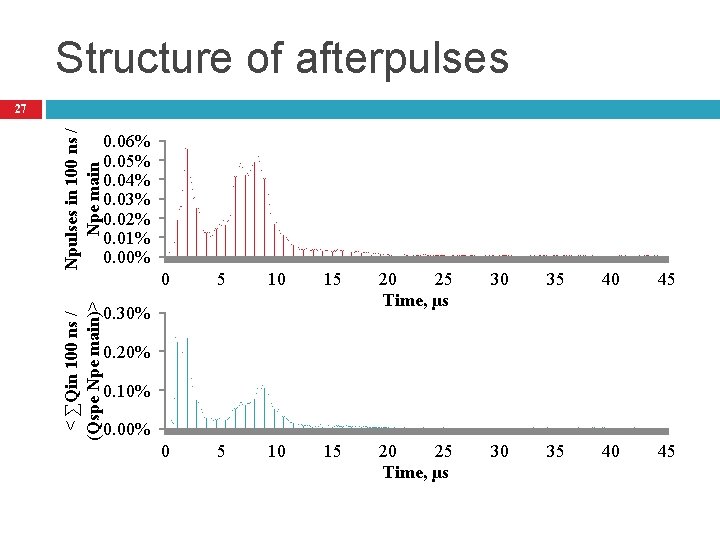
Structure of afterpulses Npulses in 100 ns / Npe main 0. 06% 0. 05% 0. 04% 0. 03% 0. 02% 0. 01% 0. 00% < ∑Qin 100 ns / (Qspe Npe main)> 27 0. 30% 0 5 10 15 20 25 Time, µs 30 35 40 45 0. 20% 0. 10% 0. 00%
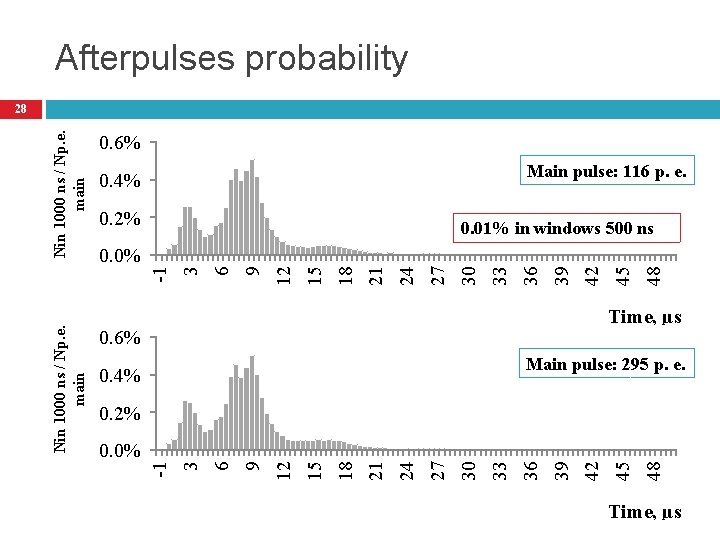
Afterpulses probability 0. 6% Main pulse: 116 p. e. 0. 4% 0. 2% 48 45 42 39 36 33 30 27 24 21 18 15 12 9 6 3 -1 0. 0% 0. 01% in windows 500 ns Time, µs 0. 6% Main pulse: 295 p. e. 0. 4% 48 45 42 39 36 33 30 27 24 21 18 15 12 9 6 0. 0% 3 0. 2% -1 Nin 1000 ns / Np. e. main 28 Time, µs
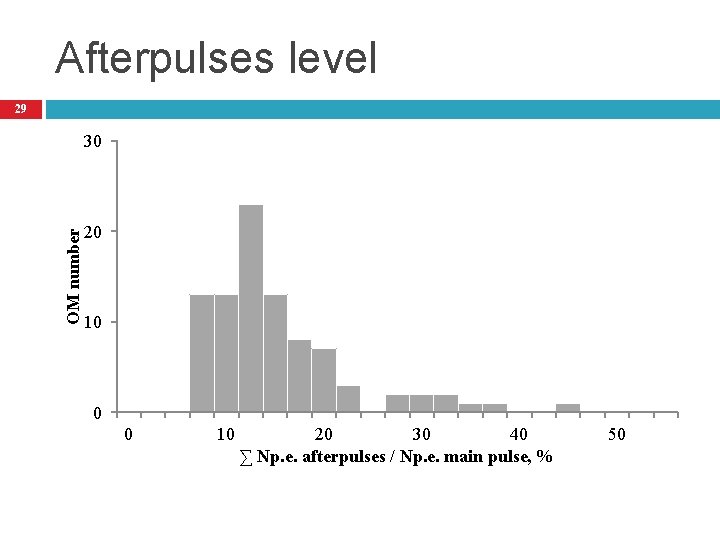
Afterpulses level 29 OM number 30 20 10 0 0 10 20 30 40 ∑ Np. e. afterpulses / Np. e. main pulse, % 50
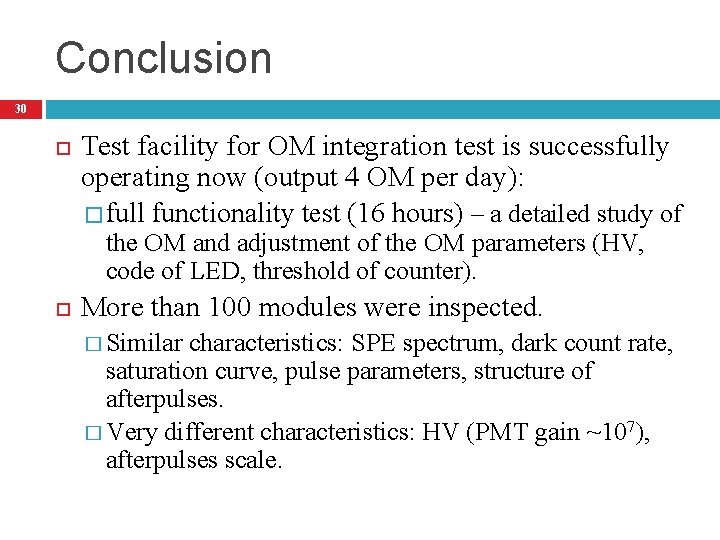
Conclusion 30 Test facility for OM integration test is successfully operating now (output 4 OM per day): � full functionality test (16 hours) – a detailed study of the OM and adjustment of the OM parameters (HV, code of LED, threshold of counter). More than 100 modules were inspected. � Similar characteristics: SPE spectrum, dark count rate, saturation curve, pulse parameters, structure of afterpulses. � Very different characteristics: HV (PMT gain ~107), afterpulses scale.

THANK YOU Aleksei Sheifler
- Slides: 31