
The Ohio State University Senate Fiscal Committee Office
- Slides: 10
The Ohio State University Senate Fiscal Committee Office of Investments Update November 3, 2009 Jonathan D. Hook Vice President & Chief Investment Officer 1
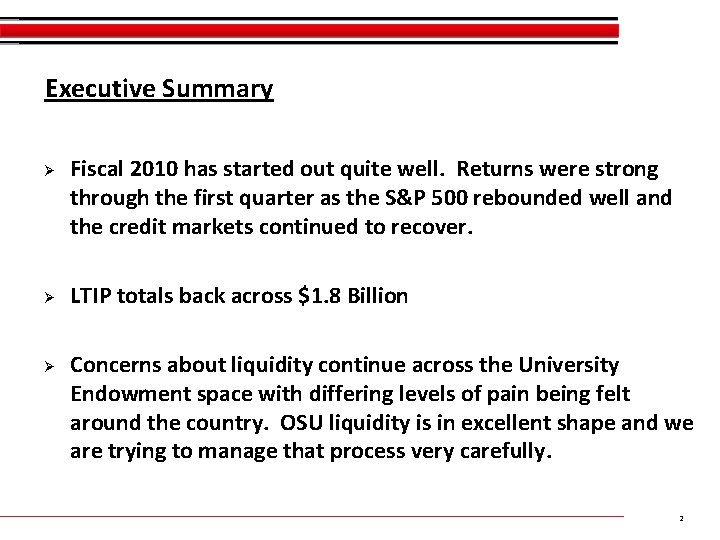
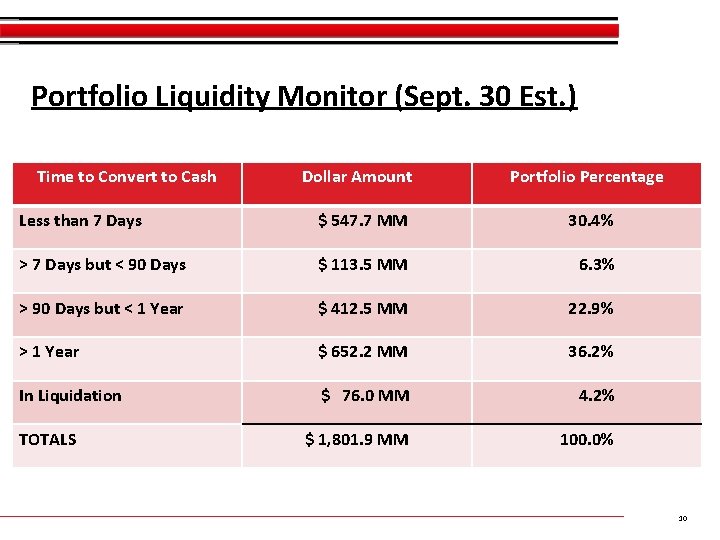
Executive Summary Ø Ø Ø Fiscal 2010 has started out quite well. Returns were strong through the first quarter as the S&P 500 rebounded well and the credit markets continued to recover. LTIP totals back across $1. 8 Billion Concerns about liquidity continue across the University Endowment space with differing levels of pain being felt around the country. OSU liquidity is in excellent shape and we are trying to manage that process very carefully. 2
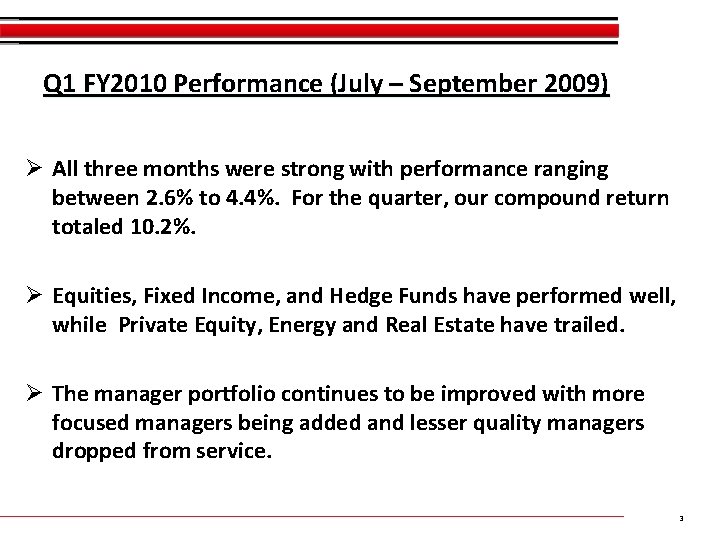
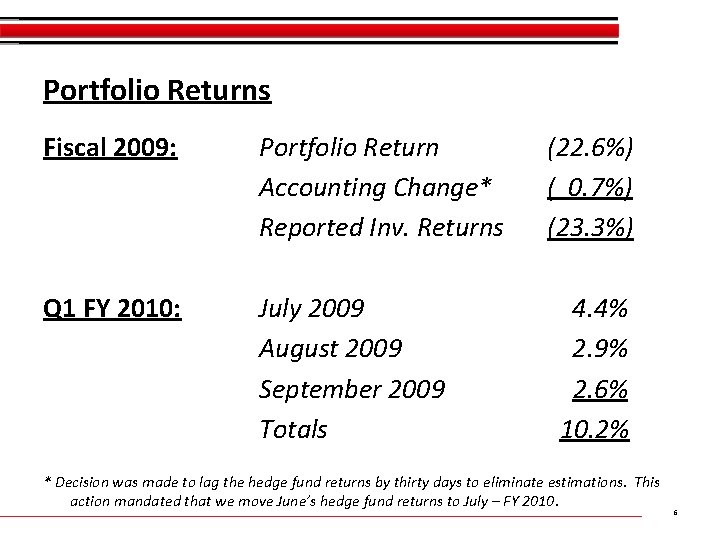
Q 1 FY 2010 Performance (July – September 2009) Ø All three months were strong with performance ranging between 2. 6% to 4. 4%. For the quarter, our compound return totaled 10. 2%. Ø Equities, Fixed Income, and Hedge Funds have performed well, while Private Equity, Energy and Real Estate have trailed. Ø The manager portfolio continues to be improved with more focused managers being added and lesser quality managers dropped from service. 3
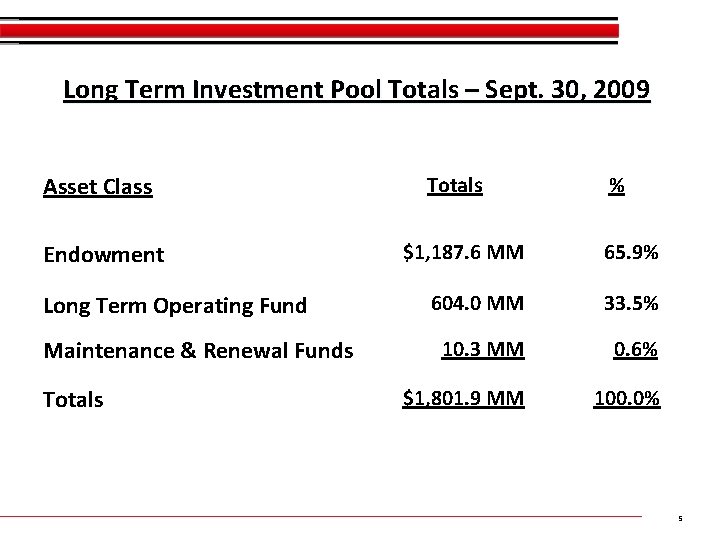
Long Term Investment Pool Totals – Sept. 30, 2009 Asset Class Endowment Long Term Operating Fund Maintenance & Renewal Funds Totals % $1, 187. 6 MM 65. 9% 604. 0 MM 33. 5% 10. 3 MM 0. 6% $1, 801. 9 MM 100. 0% 5
Portfolio Returns Fiscal 2009: Portfolio Return Accounting Change* Reported Inv. Returns Q 1 FY 2010: July 2009 August 2009 September 2009 Totals (22. 6%) ( 0. 7%) (23. 3%) 4. 4% 2. 9% 2. 6% 10. 2% * Decision was made to lag the hedge fund returns by thirty days to eliminate estimations. This action mandated that we move June’s hedge fund returns to July – FY 2010. 6
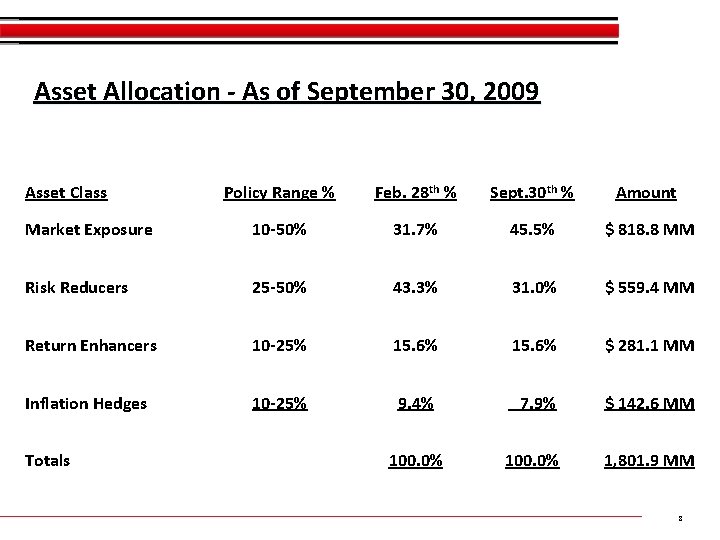
Asset Allocation - As of September 30, 2009 Asset Class Policy Range % Feb. 28 th % Sept. 30 th % Amount Market Exposure 10 -50% 31. 7% 45. 5% $ 818. 8 MM Risk Reducers 25 -50% 43. 3% 31. 0% $ 559. 4 MM Return Enhancers 10 -25% 15. 6% $ 281. 1 MM Inflation Hedges 10 -25% 9. 4% 7. 9% $ 142. 6 MM 100. 0% 1, 801. 9 MM Totals 100. 0% 8
Portfolio Liquidity Monitor (Sept. 30 Est. ) Time to Convert to Cash Dollar Amount Portfolio Percentage Less than 7 Days $ 547. 7 MM 30. 4% > 7 Days but < 90 Days $ 113. 5 MM 6. 3% > 90 Days but < 1 Year $ 412. 5 MM 22. 9% > 1 Year $ 652. 2 MM 36. 2% In Liquidation $ 76. 0 MM 4. 2% $ 1, 801. 9 MM 100. 0% TOTALS 10
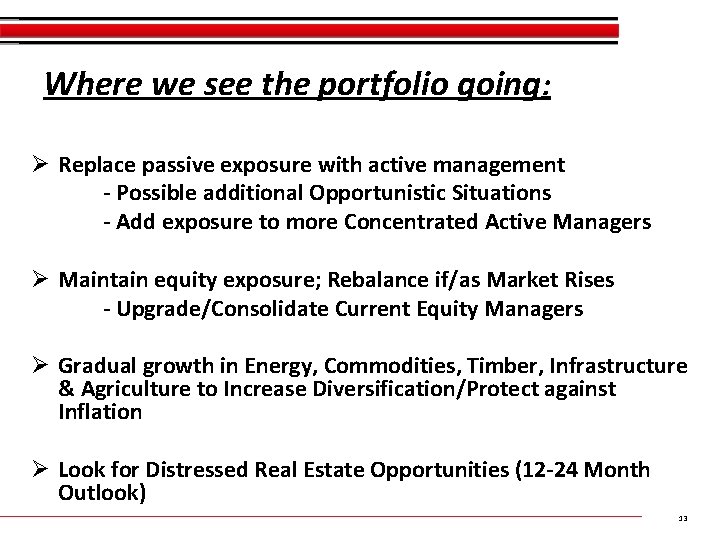
Where we see the portfolio going: Ø Replace passive exposure with active management - Possible additional Opportunistic Situations - Add exposure to more Concentrated Active Managers Ø Maintain equity exposure; Rebalance if/as Market Rises - Upgrade/Consolidate Current Equity Managers Ø Gradual growth in Energy, Commodities, Timber, Infrastructure & Agriculture to Increase Diversification/Protect against Inflation Ø Look for Distressed Real Estate Opportunities (12 -24 Month Outlook) 13
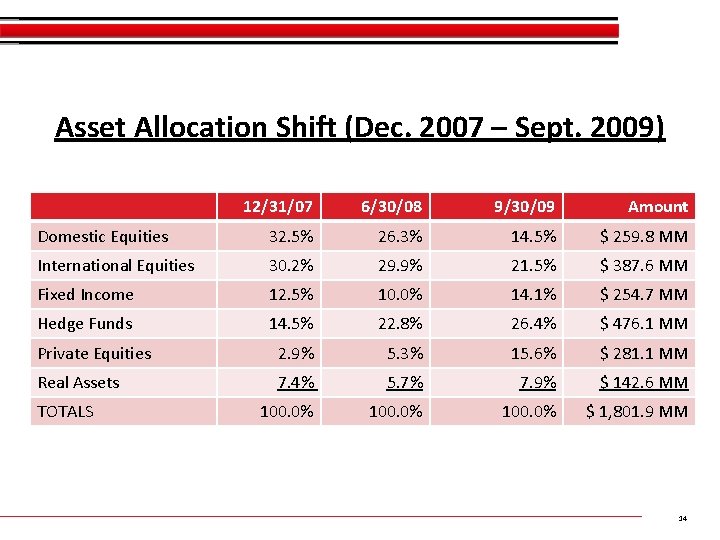
Asset Allocation Shift (Dec. 2007 – Sept. 2009) 12/31/07 6/30/08 9/30/09 Amount Domestic Equities 32. 5% 26. 3% 14. 5% $ 259. 8 MM International Equities 30. 2% 29. 9% 21. 5% $ 387. 6 MM Fixed Income 12. 5% 10. 0% 14. 1% $ 254. 7 MM Hedge Funds 14. 5% 22. 8% 26. 4% $ 476. 1 MM Private Equities 2. 9% 5. 3% 15. 6% $ 281. 1 MM Real Assets 7. 4% 5. 7% 7. 9% $ 142. 6 MM 100. 0% $ 1, 801. 9 MM TOTALS 14
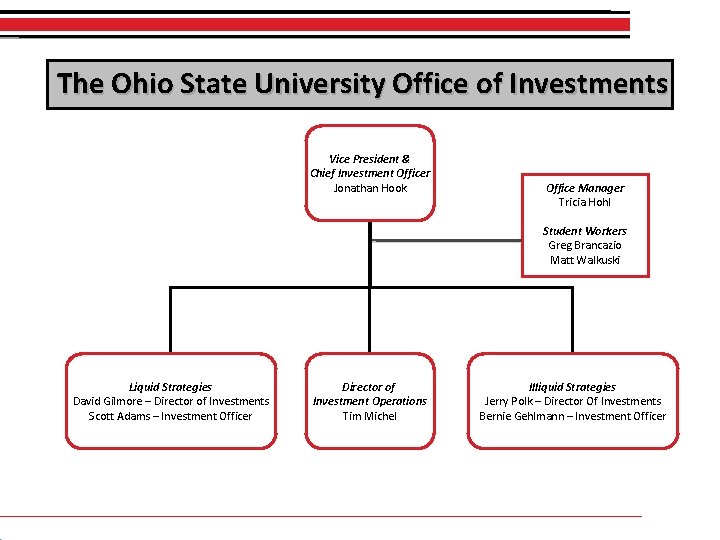
The Ohio State University Office of Investments Vice President & Chief Investment Officer Jonathan Hook Office Manager Tricia Hohl Student Workers Greg Brancazio Matt Walkuski Liquid Strategies David Gilmore – Director of Investments Scott Adams – Investment Officer Director of Investment Operations Tim Michel Illiquid Strategies Jerry Polk – Director Of Investments Bernie Gehlmann – Investment Officer