The Nuclear Level Densities in Closed Shell 205


 resonances Discrete levels counting Evaporation")


 determines the energy")


- Slides: 26
The Nuclear Level Densities in Closed Shell 205 -208 Pb Nuclei Syed Naeem Ul Hasan
Introduction: ü Nuclear level density: Bethe Fermi gas model in 1936. For many years, measurements of NLD have been interpreted in the framework of an infinite Fermi-gas model. ü Gil. & Cam. CTF, BSFG were later proposed accounting shell effects etc. ü Shell Model Monte Carlo (SMMC)
ü Experimental NLD, ü ü Counting of neutron (proton) resonances Discrete levels counting Evaporation spectra OSLO METHOD ü Method has successfully been proven for a No. of nuclei. ü However in cases where statistical properties are less favorable the method foundation is more doubtful. ü A test at the lighter nuclei region has been made already for 27, 28 Si. ü The limit of applicability of method on closed shell nuclei was also required.
Experimental details ü MC-35 cyclotron at OCL, 38 Me. V 3 He beam bombarded on 206 Pb and 208 Pb targets having thickness of 4. 707 and 1. 4 mg/cm 2. Following reactions were studied, ü 206 Pb(3 He, 3 He´)206 Pb )205 Pb 208 Pb(3 He, 3 He´)208 Pb(3 He, )207 Pb 206 Pb(3 He, ��� The particle- coincidences were recorded while the experiment ran for 2 -3 weeks.
Oslo Cyclotron Lab CACTUS Concrete wall http: //www. physics. . no/ocl/intro/
ü Detector Arrangement The charged ejectiles ----> 8 collimated Si at 45 o to the beam. The -rays detection -----> CACTUS: 28 Na. I(Tl) 5”x 5” detection = 15% of 4π. Particles & -rays are produced in rxns are measured in both particle- coincidence & particle singles mode by the CACTUS multi-detector array.
Data Analysis: Raw Data Unfolding of coincidence spectra Particle Spectra Calibration -spectra calibration and alignment Data Reduction thickness spectrum Gating on particles Particle - coincidences Extracting Primary- spectra
Coincidence Spectra: 3 He- -
Unfolding: Detector response of 28 Na. I detectors are determined 11 energies and interpolation is made for intermediate -energies. ü Folding iteration method is used; Unfolded spectrum is starting point, such that, f = R u. – First trial fn as, uo = r – – First folded spectrum, fo = R uo Response function Next trial fn, u 1 = uo + (r - fo) – – Generally, ui+1 = ui + (r - fi) Iteration continues until fi ~ r Fluctuations in folded spectra Compton background are subtracted. of 4 Me. V �. Response Matrix
Test of method: Raw unfolded
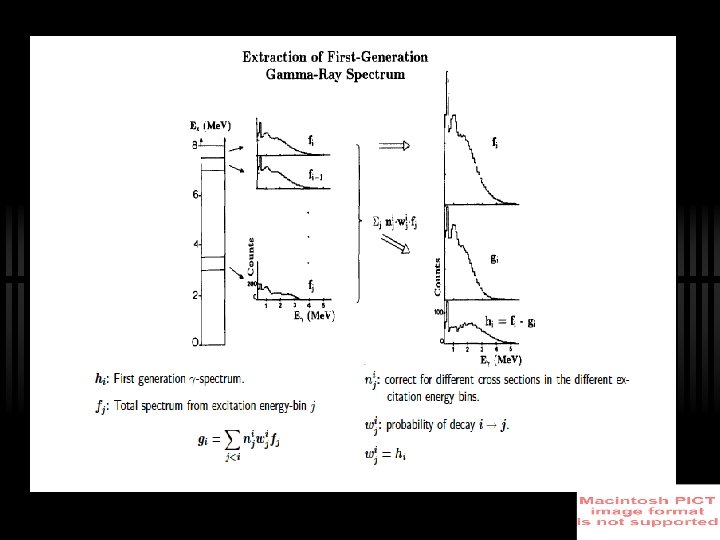
Primary -matrix: Assumption: ü The -decay pattern from any Ex is independent of the population mechanism �� ü������ The nucleus seems to be an CN like system prior to -emission. Method: The f. g. -spectrum of the highest Ex is estimated by, f 1 = f. g. -spectrum of highest Ex bin. g = weighted sum of all spectra. wi = prob. of decay from bin 1 - i. ni = i / j
Multiplicity Normalization : Algorithm: 1. 2. 3. 4. Apply a trial fn wi Deducing hi = fi - g Transforming hi to wji (i. e. Unfold h, make h having same energy calibration as wi, normalize the area of h to 1). If wji (new) ≈ wji (old) then the calculated hi would be the Primary - function for the level Ei, else proceed with (2) Some experimental conditions can introduce severe systematic errors, like pile-up effects, isomers etc.
Testing of an Experimental spectrum: h=f-gf g Ex ~ 4. 5 -5. 5 Me. V.
Extraction of NLD & GSF: f. Ediff ü Brink-Axel Hypothesis; ü Transforming; A, B, are free parameters. A. Schiller et al. / Nucl. Instr. & Methods in Physics Research A 447 (2000) 498 -511 Ef
ü Gamma transition probability ü Theoretically ü Minimizing;
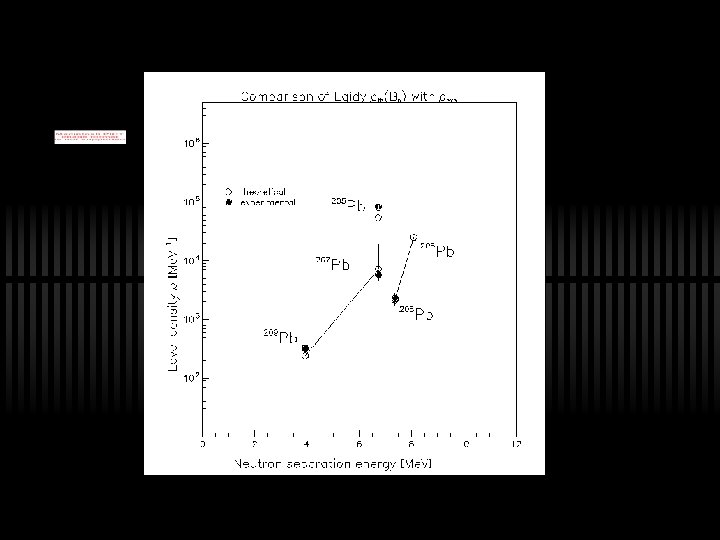
Nuclear Level Density: ü At low Ex; o comparing the extracted NLD to ü At Bn deducing NLD from resonance spacing 208 data. Pb =0. 634 ü BSFG level density extrapolation where a = level density parameter, U = E-E 1 and E 1 = back-shifted parameter,
Experimental NLD
Entropy: ü o is adjusted to give S = ln ~ 0 close to ground state band ü The ground band properties fullfil the Third law of dynamics: S(T =0) = 0;
Gamma Strength Function: ü The fitting procedure of P(Ei, E ) determines the energy dependence of T(Ei, E ). ü The fitting of B must be done here. ü Assumptions: – – ü The decay in the continuum E 1, M 1. No of states with = ± is equal Radiative strength function is,
Collaborators Magne Guttormsen University of Oslo Suniva Siem University of Oslo Ann Cecilie University of Oslo Rositsa Chankova University of Oslo A. Voinov Ohio university, OH, USA Andreas Schiller MSU, USA Tom Lønnroth Åbo Akademi, Finnland Jon Rekstad University of Oslo Finn Ingebretsen University of Oslo
Thank You