The Normal ECG Normal P Wave Negative in


 show r. S or RS •")

- Slides: 22
The Normal ECG
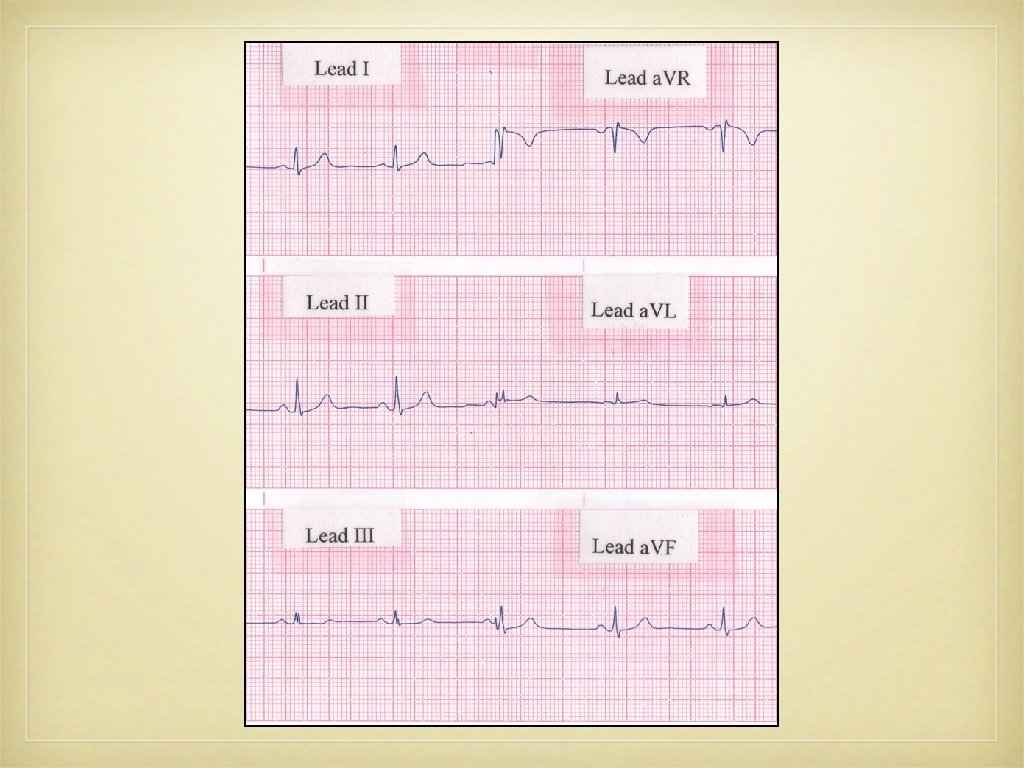
Normal P Wave • Negative in a. VR • Positive in II • 2. 5 mm in amplitude • < 0. 12 sec. in width
Normal P Wave Normal direction of atrial depolarization a. VR? II? Figures 4 -2 and 4 -3
Abnormal P Wave Direction of atrial depolarization with junction rhythm This is an example of a retrograde conduction a. VR? II?
Normal QRS • Two phases • brief phase; depolarization of ventricular septum • longer phase; depolarization of both ventricles but the left is larger
First Phase • Depolarization of ventricular septum
Second Phase • Depolarization of both ventricles but the left is larger
Precordial Leads V 6 V 1
Normal QRS V 6? V 1? Fig. 4 -6 V 1? V 6?
Normal QRS V 1 V 6
Normal QRS • Septal r wave • Septal q wave
Normal R Wave Progression Transition Zone?
R Wave Progression Transition Zone?
Transition Zone • Figure 4 -7
Early Transition • Figure 4 -7
Delayed Transition • Figure 4 -7
Limb Leads • a. VR • predominately negative QRS and T • r. S, QS, or Qr pattern (Fig. 4 -9)
Limb Leads & Electrical Position • Electrical Position = Mean QRS Axis • horizontal QRS axis • vertical QRS axis • intermediate QRS axis
Horizontal Axis • I and a. VL show q. R • II, III and a. VF show r. S or RS • Figure 4 -10
Vertical Axis • a. VL (and sometimes I) show r. S or RS • II, III and a. VF show q. R • Figure 4 -11
Intermediate Axis • I, a. VL, III and a. VF can be predominately positive • Figure 4 -12