The Normal Distribution The Normal Distribution z For

The Normal Distribution

The Normal Distribution z For quantities following a normal distribution: · 68. 2% of the observations will be within 1 standard deviation of the mean. · 95. 4% of the observations will be within 2 standard deviations of the mean. · 99. 8% of the observations will be within 3 standard deviations of the mean.

The Normal Distribution

The Normal Distribution

The Normal Distribution z Practice Problem 1: Suppose the monthly sales for a product is closely approximated by a normal distribution, with a mean of 200 units and a standard deviation of 40 units. How much inventory must be available at the beginning of the month to ensure that the probability of running out of the product is no more than 0. 023?

The Normal Distribution z Practice Problem 1: Suppose the monthly sales for a product is closely approximated by a normal distribution, with a mean of 200 units and a standard deviation of 40 units. How much inventory must be available at the beginning of the month to ensure that the probability of running out of the product is no more than 0. 023? z Solution:

The Normal Distribution z Solution:

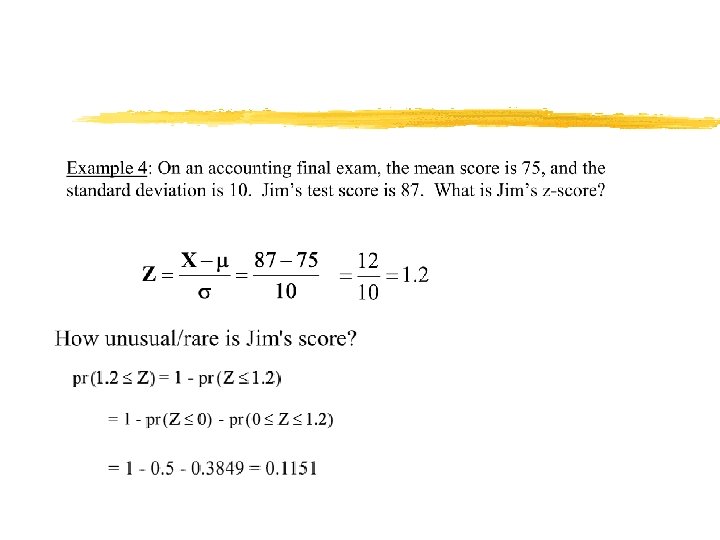
Measures of Relative Standing – Standardizing an Observation –

Z-Score

Measures of Relative Standing – Standardizing an Observation –

Standard Normal Table

Sampling Distributions

Applications of sampling

Steps for Generating a Sample Mean

Questions to consider

What’s your Weekly Entertainment Spending? What is The Average Weekly Entertainment spending level of Marketing Research Students?

What’s your Weekly Entertainment Spending? Sample #1 1, 4, 15, 17, 31 Average = 52. 59 Standard Deviation = 11. 25

What’s your Weekly Entertainment Spending? Sample #2 2, 5, 11, 13, 37 Average = 43. 72 Standard Deviation = 11. 47

What’s your Weekly Entertainment Spending? Sample #3 1, 8, 19, 22, 27 Average = 52. 40 Standard Deviation = 9. 88

What’s your Average Weekly Entertainment Spending? Total Population: Average = 49. 75 Standard Deviation = 11. 9 12 10 8 6 4 2 Std. Dev = 11. 90 Mean = 49. 8 N = 38. 00 0 30. 0 35. 0 40. 0 45. 0 50. 0 55. 0 60. 0 65. 0 70. 0 75. 0 Weekly Entertainment Spending

Sampling Distributions
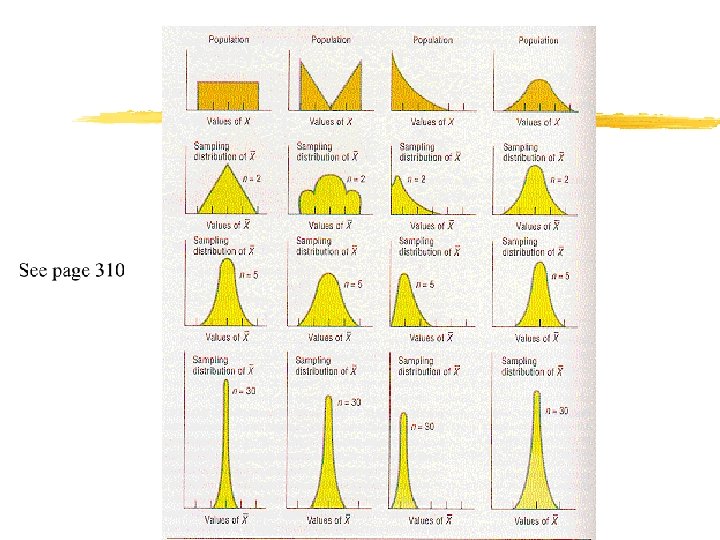

Central Limit Theorem

Confidence Interval

Confidence Interval Weekly Entertainment Spending Interval Estimates 12 10 8 6 4 2 Std. Dev = 11. 90 Mean = 49. 8 N = 38. 00 0 30. 0 35. 0 40. 0 45. 0 50. 0 55. 0 60. 0 65. 0 70. 0 75. 0 Weekly Entertainment Spending

The 95% CI

The 95% CI

The 95% CI
% Confidence Interval")
The 100(1 - )% Confidence Interval

Standard Normal Table
% Confidence Interval")
The 100(1 - )% Confidence Interval

Confidence Interval

Necessary Sample Size

Necessary Sample Size

Confidence Intervals for Proportions

Confidence Intervals for Proportions Proportion of success Proportion of failures

Confidence Intervals for Proportions

Necessary Sample Size

Necessary Sample Size
- Slides: 40