The Normal Curve Standardization and z Scores CHAPTER


 De Moivre – Bernoulli – De Morgan")


- Slides: 41
The Normal Curve, Standardization and z Scores CHAPTER 6
Freakanomics! Go go go!
The Bell Curve is Born (1769) De Moivre – Bernoulli – De Morgan
A Modern Normal Curve Remember: unimodal, symmetric
Development of a Normal Curve: Sample of 5
Development of a Normal Curve: Sample of 30
Development of a Normal Curve: Sample of 140
Central Limit Theorem As the sample size increases, the shape of the distribution becomes more like the normal curve Can you think of variables that might be normally distributed? ◦ Think about it: Can nominal (categorical) variables be normally distributed?
Standardization, z Scores, and the Normal Curve Let’s say we wanted to compare our student scores on the old GRE (800 point scale) to the new GRE (170 point scale) Standardization: allows comparisons by creating a common shared distribution ◦ Also allows us to create percentiles (p-values!)
Standardization, z Scores, and the Normal Curve Normal curve = standardized ◦ z distribution (draw it) ◦ z scores ◦ Comparing z scores ◦ Percentiles are p values ◦ Different ways to think about p
Standardization, z Scores, and the Normal Curve Z-distribution – normal distribution of standardized scores Also called standard normal distribution
Standardization, z Scores, and the Normal Curve So what are z-scores? ◦ Number of standard deviations away from the mean of a particular score ◦ Can be positive or negative ◦ Positive = above mean ◦ Negative = below mean
The z Distribution
Standardization, z Scores, and the Normal Curve Z-distribution ◦ Mean = 0 ◦ Standard deviation = 1
Examples Be sure you can do the following: 1. 2. 3. 4. 5. 6. 7. 8. Find a z score Find a raw score (x) Compare scores Find a percent above Find a percent below Find a percent between Given percent find a z score Given percent find a raw score
Transforming Raw Scores to z Scores Step 1: Subtract the mean of the population from the raw score Step 2: Divide by the standard deviation of the population
Transforming z Scores into Raw Scores Step 1: Multiply the z score by the standard deviation of the population Step 2: Add the mean of the population to this product
Using z Scores to Make Comparisons If you know your score on an exam, and a friend’s score on an exam, you can convert to z scores to determine who did better and by how much. z scores are standardized, so they can be compared!
Comparing Apples and Oranges If we can standardize the raw scores on two different scales, converting both scores to z scores, we can then compare the scores directly
Transforming z Scores into Percentiles z scores tell you where a value fits into a normal distribution. Based on the normal distribution, there are rules about where scores with a z value will fall, and how it will relate to a percentile rank You can use the area under the normal curve to calculate percentiles for any score
The Normal Curve and Percentages
Sketching the Normal Curve The benefits of sketching the normal curve: ◦ Stays clear in memory; minimizes errors ◦ Practical reference ◦ Condenses the information ◦ Allows you to make sure the JASP information you are getting seems right
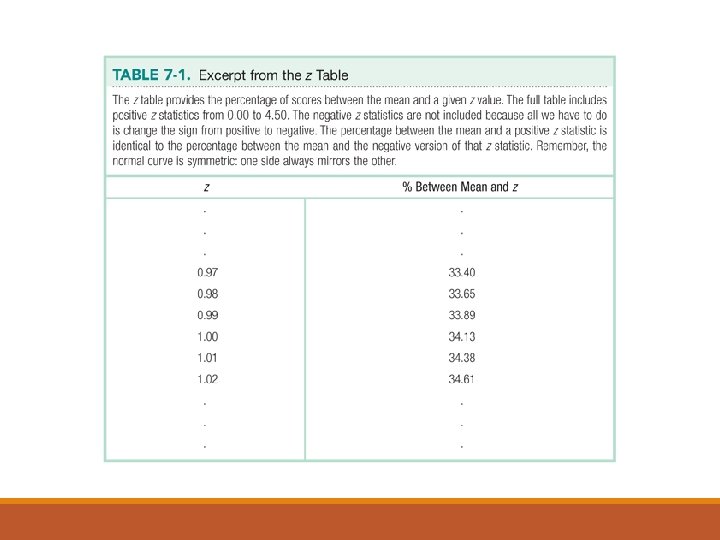
Getting a p value from a z score To get a p value from a z score: ◦ Find your z score on the table % in tail ◦ p value = % in tail / 100 ◦ e. g. , the p value for a z score of 1. 28 would be. 100
Getting a z score from a p value To get a z score from a p value: ◦ Calculate the % in tail from your p value ◦ % in tail = p value * 100 ◦ Find your % in tail on the table z score ◦ e. g. , the z score for a p value of. 03 would be 1. 88
Calculating the Percentage Above a Positive z Score
Calculating the Percentile for a Positive z Score
Calculating the Percentage Above a Negative z Score
Calculating the Percentile for a Negative z Score
Calculating the Percentage at Least as Extreme as Our z Score
Calculating a Score from a Percentile
Creating a Distribution of Scores These distributions were obtained by drawing from the same population
Creating a Distribution of Means
The Mathematical Magic of Large Samples
Distribution Bunnies! https: //youtu. be/jvox. EYm. QHNM
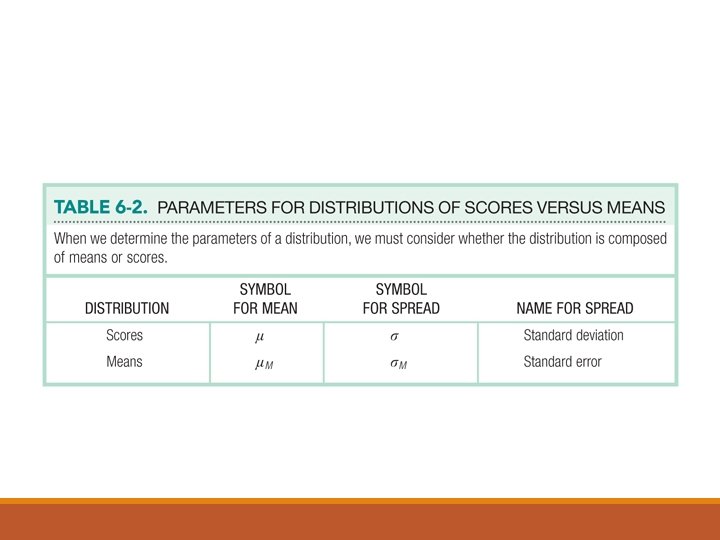
The Central Limit Theorem Distribution of sample means is normally distributed even when the population from which it was drawn is not normal! A distribution of means is less variable than a distribution of individual scores ◦ meaning SD is smaller… but we don’t call it SD
Distribution of Means Mean of the distribution tends to be the mean of the population Standard deviation of the distribution tends to be less than the standard deviation of the population ◦ The standard error: standard deviation of the distribution of means
Using the Appropriate Measure of Spread
Z statistic for Distribution of Means When you use a distribution of means, you tweak how you calculate z! Calculation of percentages stays the same z = M – μM σM
The Normal Curve and Catching Cheaters This pattern is an indication that researchers might be manipulating their analyses to push their z statistics beyond the cutoffs