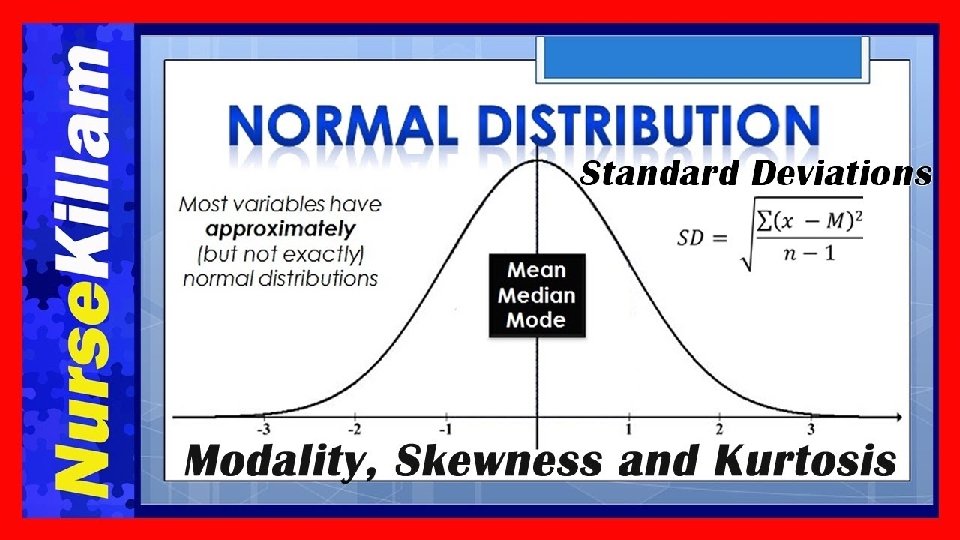
The Normal Curve Chapter 5 The Normal Curve


(σ) + µ")


- Slides: 28
The Normal Curve Chapter 5
The Normal Curve
Notation σ = Population Variance µ = Population Mean x = Sample Mean
The Normal Curve
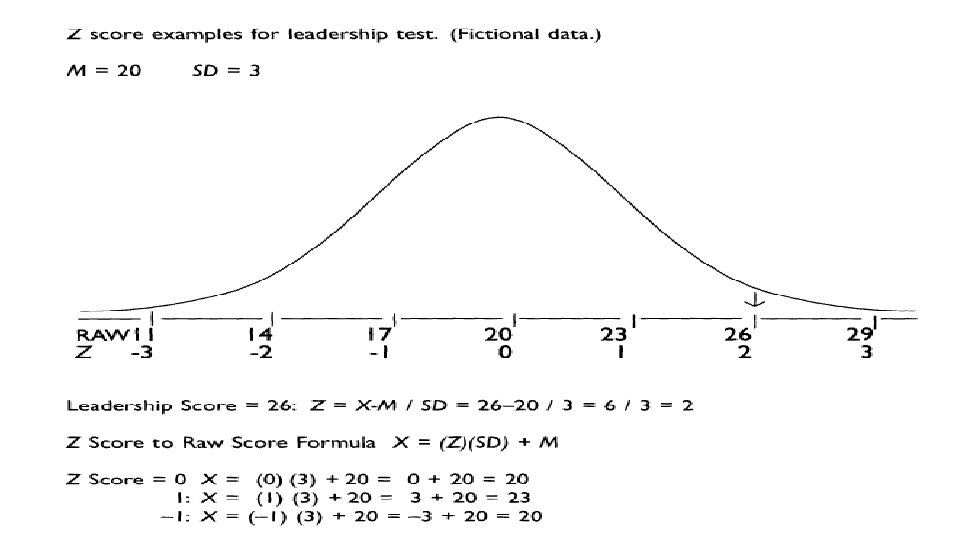
The Normal Curve: Z-scores Ø An individual has a score of 26 on a leadership test. Is that person a particularly good leader? If µ = 20 on this test, the person is above average (Think in terms of Deviation scores!) Ø Knowing the standard deviations of distribution allows you to tell how much above or below the average that score is in relation to the spread of scores in the distribution
The Normal Curve: Z-scores Leadership test: µ = 20, σ = 3 What can we say about a person with a score of 26 is? Answer: 2 σs above the mean of 20. Why? 1 σ = 3, so add the score (20) + σ (3) = 23 2 σs = 2(3 σ), so add the score (20) + σ (6) = 26
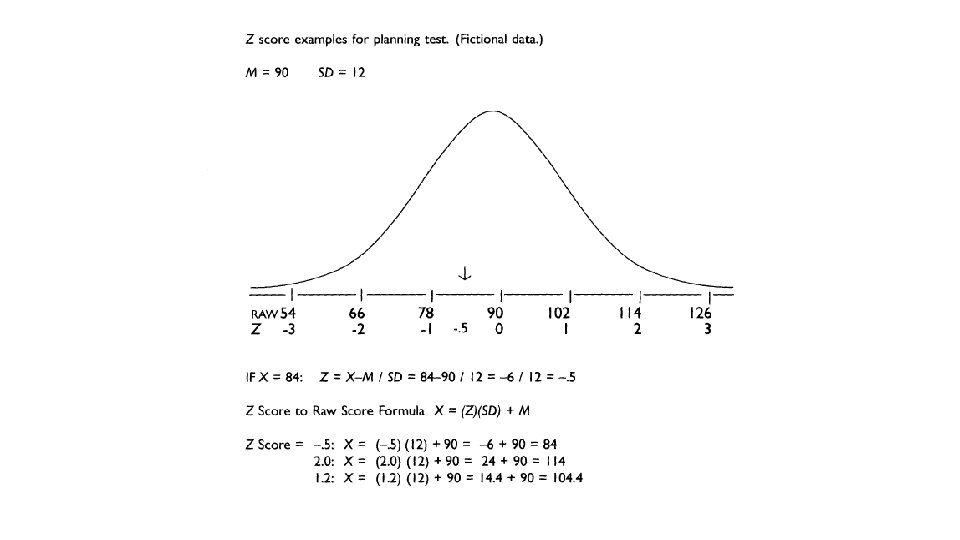
The Normal Curve: Z-scores An individual scores 78 on a test of planning ability If µ = 90, σ = 12 This person’s score is 1 σ below the mean 78 is below 90, hence below the mean 78 is 12 (78 -90 = -12) units below 90 1 σ is 12 units
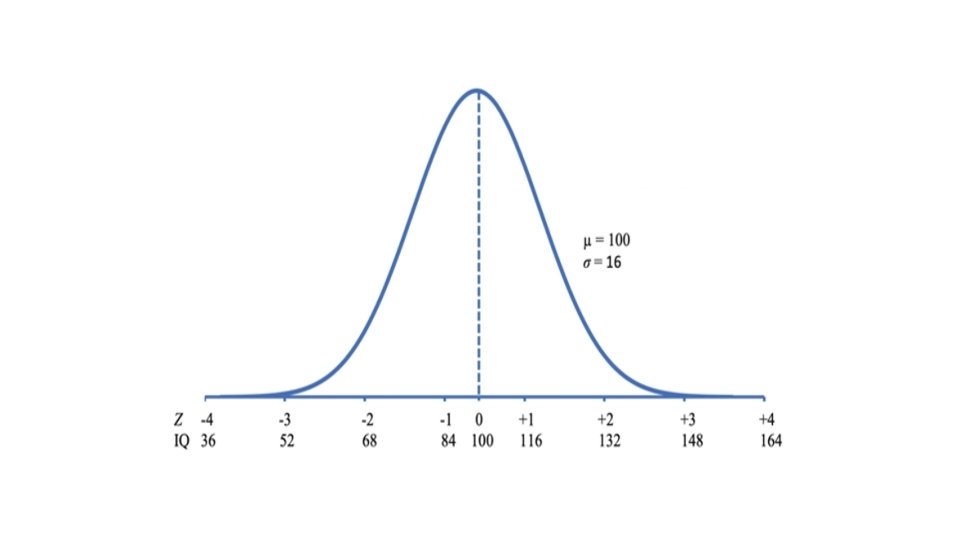
The Normal Curve: Z-scores The number of standard deviations a score is above or below the mean is called its z-score (Standardized score) How far a person is from the mean, in the metric of standard deviation units Z-scores provide a helpful way to compare scores on measures that are on completely different scales
The Normal Curve: Z-scores Ø Allow us to compare APPLES and ORANGES If a person scores 26 ( Z = +2) on leadership test and 84 (Z = -. 5) on a planning test, Ø we can say that the person scores much higher than average on leadership and slightly lower than average on planning Ø Z-scores provide a way to standardize or equate different metrics
The Normal Curve: Z-scores ØZ-scores describe a score in terms of where it fits into the overall group of scores. ØA z-score is the number of standard deviations a score is above (+Z) or below (-Z) the mean of the scores in a distribution. ØA raw score = a regular score before converted into Z-score. • Raw scores on very different variables can be converted into Z scores and directly compared.
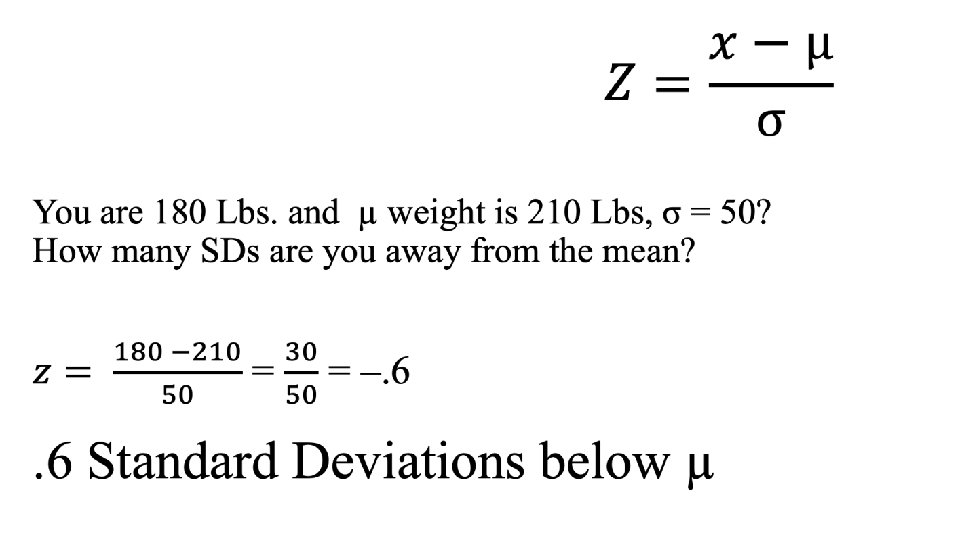
The Z-Score •
Calculating a Z Score •
Change Z-Score to Raw Score Formula X = (Z)(σ) + µ
Change Z Score to Raw Score A child had a z-score of 1. 5 on the number of times spoken with another child during an hour (From Previous problem: µ = 12; σ = 4). Z-score = 1. 5 µ = 12 σ=4 X = (Z)(σ) + µ Raw Score (X) = (1. 5)(4) + 12 = 18
Important Properties of Z-scores Mean of Z-scores = 0 Z-score = 0 = average σ of Z-score = 1
Why? Properties of Standard Scores The mean has been subtracted from each score. Therefore, following the definition of the mean as a balancing point, the sum (and, accordingly, the average) of all the deviation scores must be zero.
σ of a set of standardized scores is always 1 M = 50 SD = 10 x 20 30 40 50 60 70 80 z -3 -2 -1 0 1 2 3
The distribution of a set of standardized scores has the same shape as the unstandardized (raw) scores 0. 0 0. 1 0. 2 0. 3 0. 4 beware of the “normalization” misinterpretation -4 -2 0 2 SCORE A “Normal” Distribution 4
Comparing Apples & oranges Which grade is higher: 86 in English or 78 in Math? Don’t know unless we look at the distribution Need to know µ and σ of both distributions Assume: English µ = 90, σ = 2 Assume Math µ = 70, σ = 2 Conclusion? Math (Z = 4); English (Z= -2) 25
How Are You Doing? How would you change a raw score to a Z score? If you had a group of scores where µ = 15 and σ = 3, what would the raw score be if you had a Z score of 5?
Key Points A z-score is the number of standard deviations that a raw score is above or below the mean.