
The Next Giant Leap Chad Kessens Ryan Mc
- Slides: 18
The Next Giant Leap Chad Kessens, Ryan Mc. Daniel, Melahn Parker, Shane Ross, Luke Voss 28 May 2002
Heliopolis Mission To build a profitable, self-sustaining foothold for humanity in space 28 May 2002 2
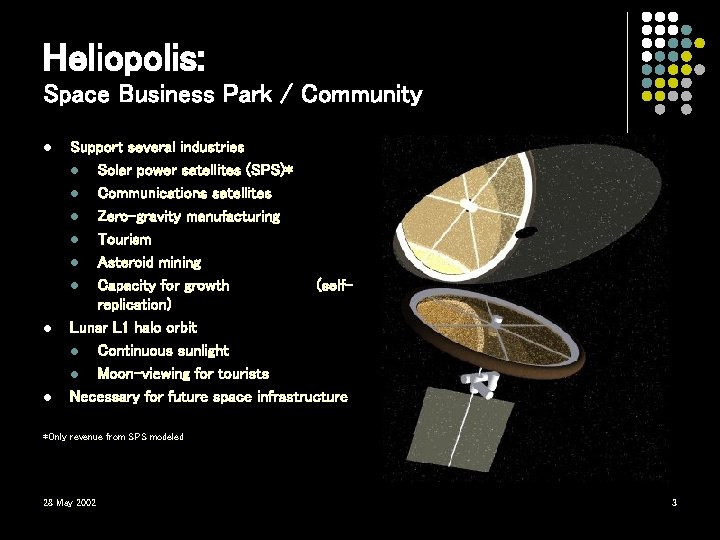
Heliopolis: Space Business Park / Community l l l Support several industries l Solar power satellites (SPS)* l Communications satellites l Zero-gravity manufacturing l Tourism l Asteroid mining l Capacity for growth (selfreplication) Lunar L 1 halo orbit l Continuous sunlight l Moon-viewing for tourists Necessary for future space infrastructure *Only revenue from SPS modeled 28 May 2002 3
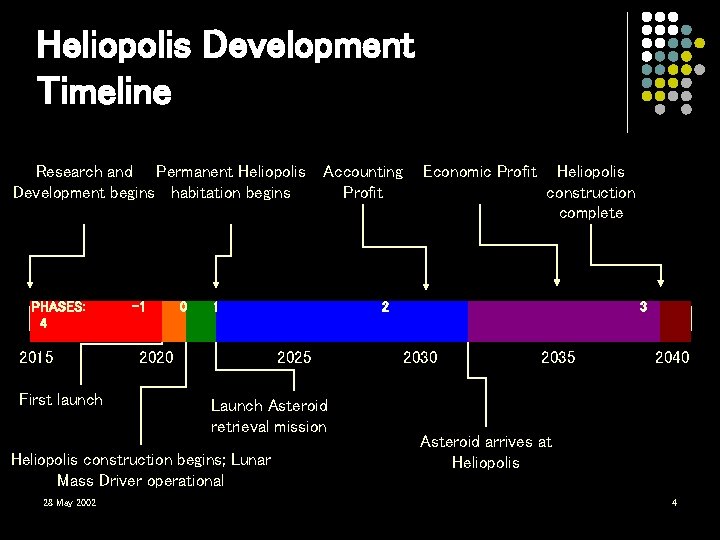
Heliopolis Development Timeline Research and Permanent Heliopolis Development begins habitation begins PHASES: 4 2015 First launch -1 0 1 2020 Economic Profit Heliopolis construction complete 2 a 2025 Launch Asteroid retrieval mission Heliopolis construction begins; Lunar Mass Driver operational 28 May 2002 Accounting Profit 3 2030 2035 2040 Asteroid arrives at Heliopolis 4
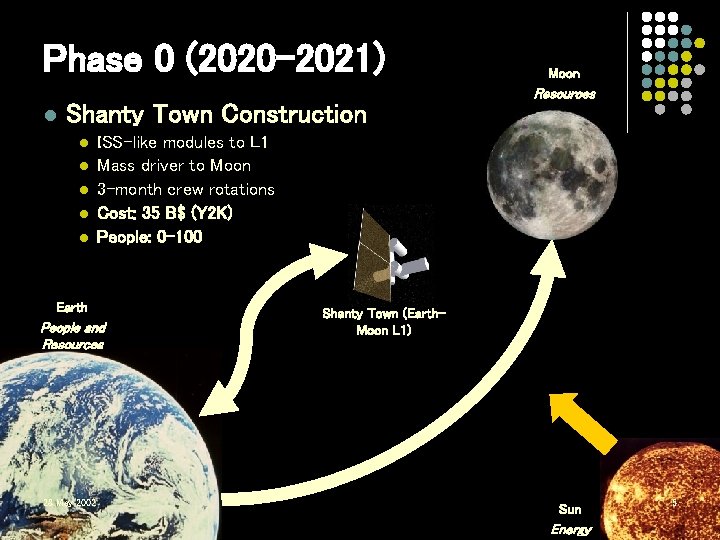
Phase 0 (2020 -2021) l Shanty Town Construction l l l Resources ISS-like modules to L 1 Mass driver to Moon 3 -month crew rotations Cost: 35 B$ (Y 2 K) People: 0 -100 Earth People and Resources 28 May 2002 Moon Shanty Town (Earth. Moon L 1) Sun Energy 5
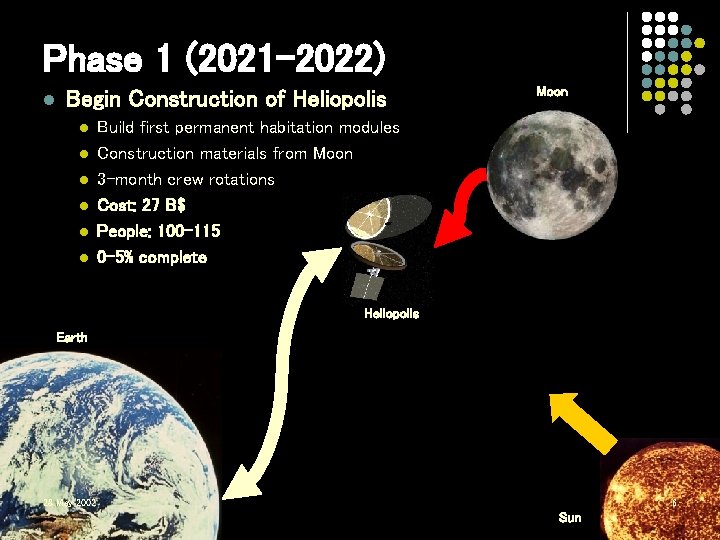
Phase 1 (2021 -2022) l Begin Construction of Heliopolis l l l Moon Build first permanent habitation modules Construction materials from Moon 3 -month crew rotations Cost: 27 B$ People: 100 -115 0 -5% complete Heliopolis Earth 28 May 2002 6 Sun
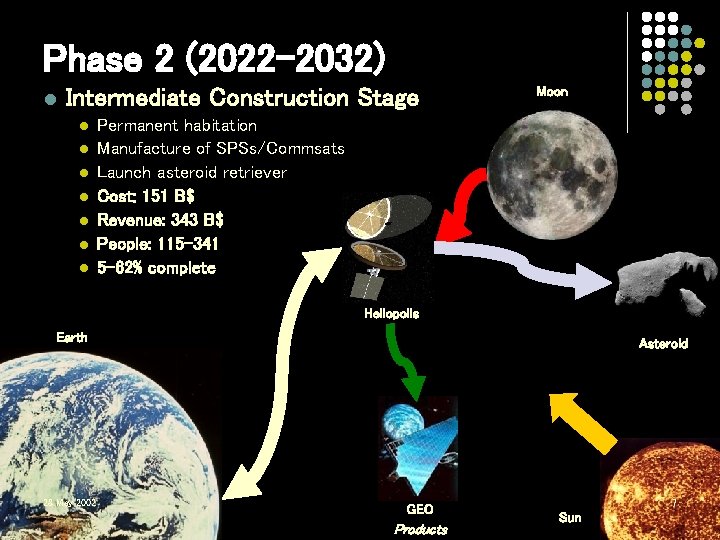
Phase 2 (2022 -2032) l Intermediate Construction Stage l l l l Moon Permanent habitation Manufacture of SPSs/Commsats Launch asteroid retriever Cost: 151 B$ Revenue: 343 B$ People: 115 -341 5 -62% complete Heliopolis Earth 28 May 2002 Asteroid GEO Products 7 Sun
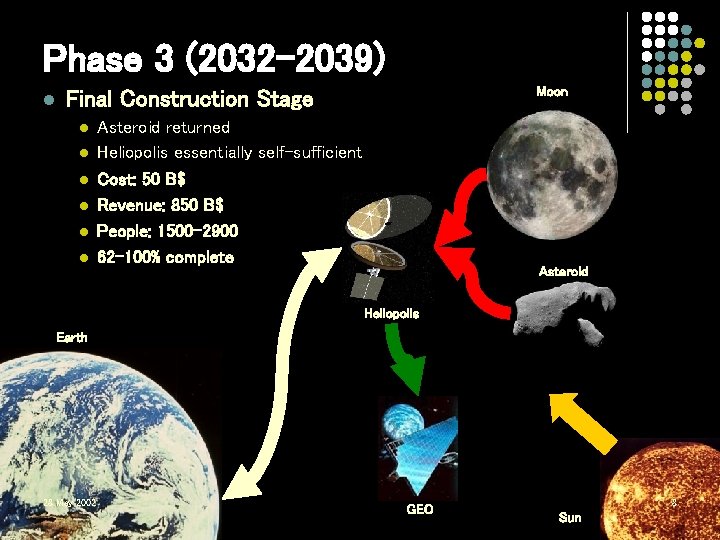
Phase 3 (2032 -2039) l Moon Final Construction Stage l l l Asteroid returned Heliopolis essentially self-sufficient Cost: 50 B$ Revenue: 850 B$ People: 1500 -2900 62 -100% complete Asteroid Heliopolis Earth 28 May 2002 GEO 8 Sun
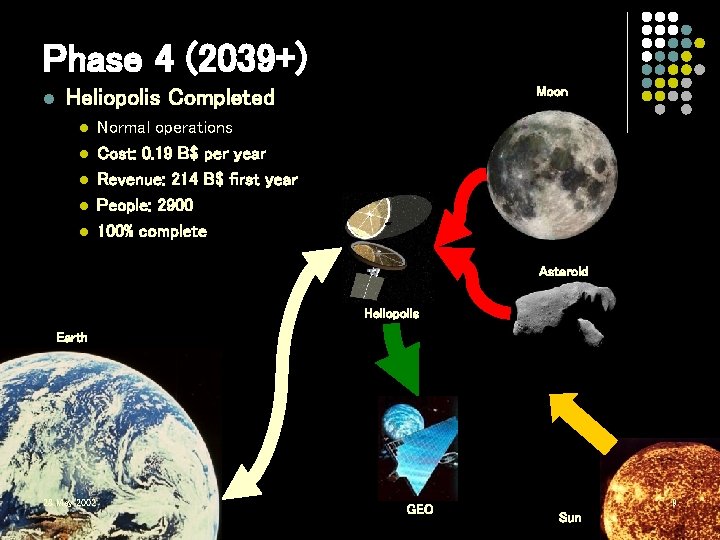
Phase 4 (2039+) l Moon Heliopolis Completed l l l Normal operations Cost: 0. 19 B$ per year Revenue: 214 B$ first year People: 2900 100% complete Asteroid Heliopolis Earth 28 May 2002 GEO 9 Sun
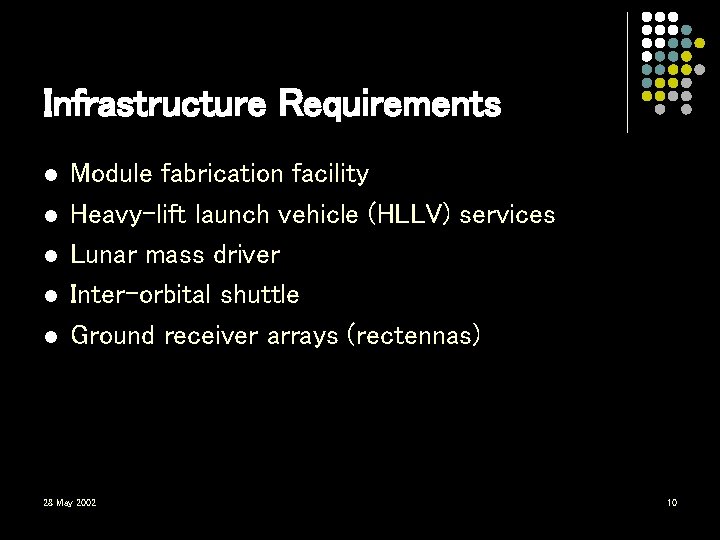
Infrastructure Requirements l l l Module fabrication facility Heavy-lift launch vehicle (HLLV) services Lunar mass driver Inter-orbital shuttle Ground receiver arrays (rectennas) 28 May 2002 10
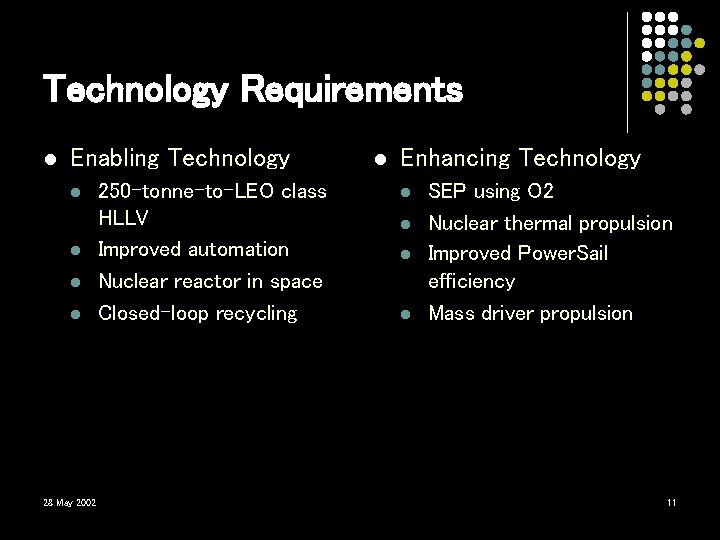
Technology Requirements l Enabling Technology l l 28 May 2002 250 -tonne-to-LEO class HLLV Improved automation Nuclear reactor in space Closed-loop recycling l Enhancing Technology l l SEP using O 2 Nuclear thermal propulsion Improved Power. Sail efficiency Mass driver propulsion 11
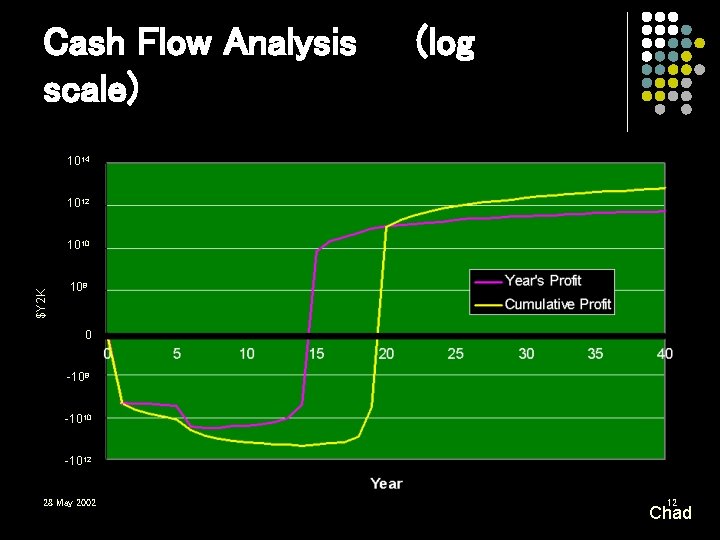
Cash Flow Analysis scale) (log 1014 1012 $Y 2 K 1010 108 0 -108 -1010 -1012 28 May 2002 12 Chad
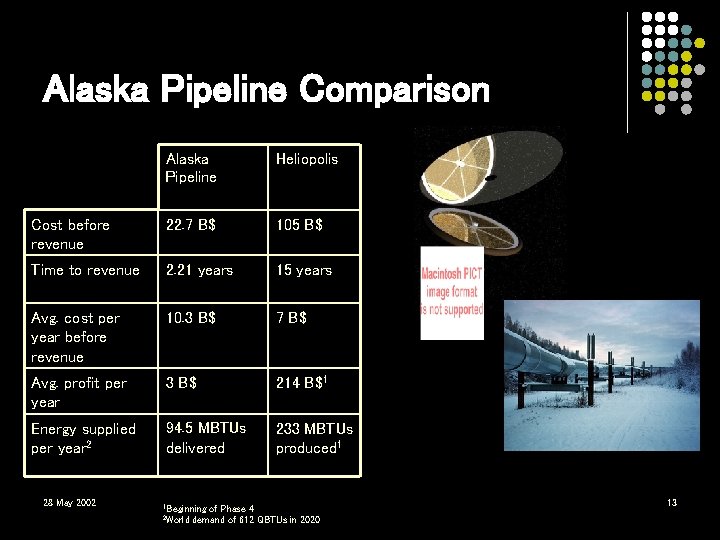
Alaska Pipeline Comparison Alaska Pipeline Heliopolis Cost before revenue 22. 7 B$ 105 B$ Time to revenue 2. 21 years 15 years Avg. cost per year before revenue 10. 3 B$ 7 B$ Avg. profit per year 3 B$ 214 B$1 Energy supplied per year 2 94. 5 MBTUs delivered 233 MBTUs produced 1 28 May 2002 1 Beginning of Phase 4 2 World demand of 612 QBTUs in 2020 13
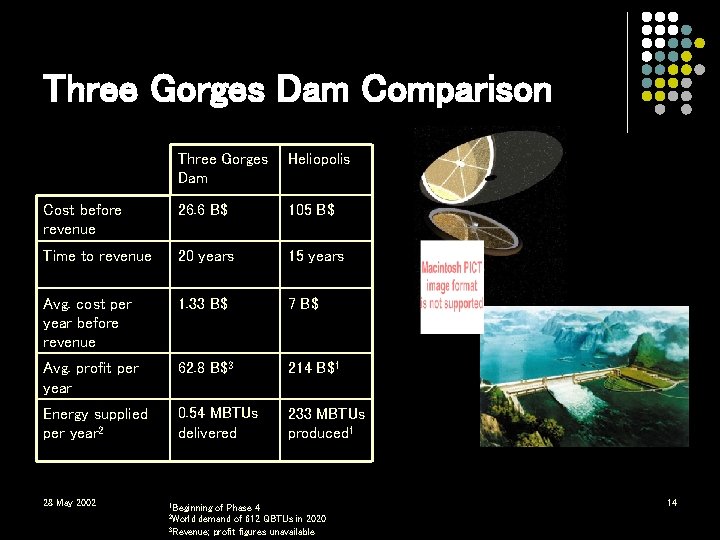
Three Gorges Dam Comparison Three Gorges Dam Heliopolis Cost before revenue 26. 6 B$ 105 B$ Time to revenue 20 years 15 years Avg. cost per year before revenue 1. 33 B$ 7 B$ Avg. profit per year 62. 8 B$3 214 B$1 Energy supplied per year 2 0. 54 MBTUs delivered 233 MBTUs produced 1 28 May 2002 1 Beginning of Phase 4 demand of 612 QBTUs in 2020 3 Revenue; profit figures unavailable 2 World 14
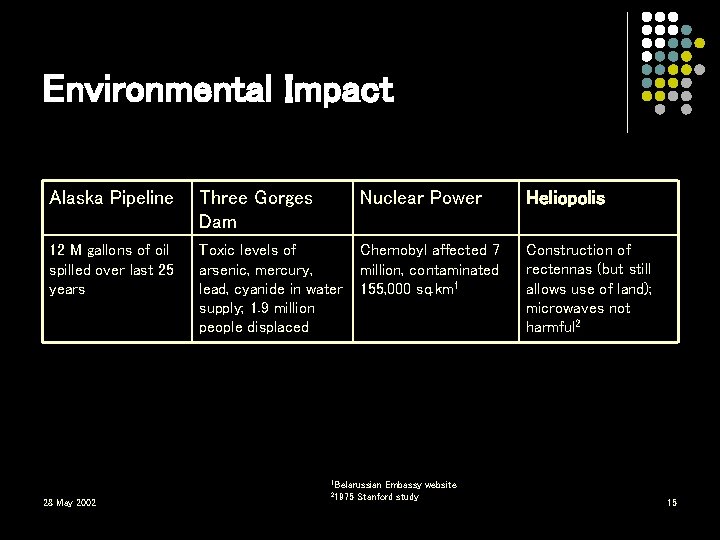
Environmental Impact Alaska Pipeline Three Gorges Dam Nuclear Power Heliopolis 12 M gallons of oil spilled over last 25 years Toxic levels of arsenic, mercury, lead, cyanide in water supply; 1. 9 million people displaced Chernobyl affected 7 million, contaminated 155, 000 sq. km 1 Construction of rectennas (but still allows use of land); microwaves not harmful 2 1 Belarussian 28 May 2002 21975 Embassy website Stanford study 15
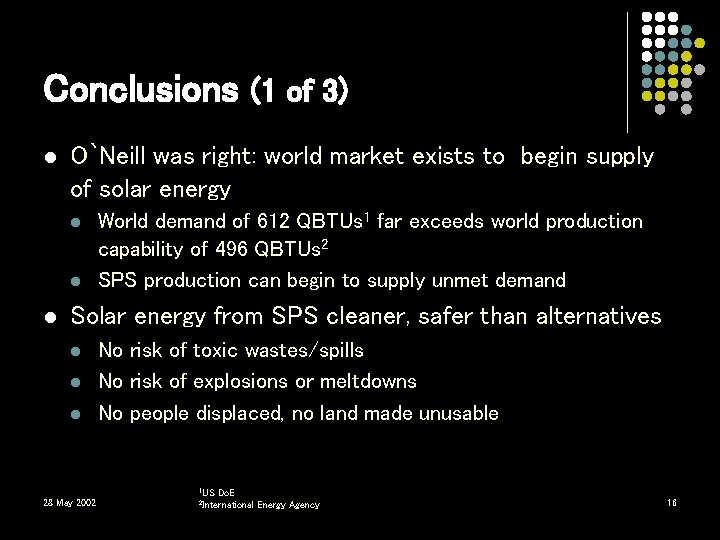
Conclusions (1 of 3) l O`Neill was right: world market exists to begin supply of solar energy l l l World demand of 612 QBTUs 1 far exceeds world production capability of 496 QBTUs 2 SPS production can begin to supply unmet demand Solar energy from SPS cleaner, safer than alternatives l l l No risk of toxic wastes/spills No risk of explosions or meltdowns No people displaced, no land made unusable 1 US 28 May 2002 Do. E 2 International Energy Agency 16
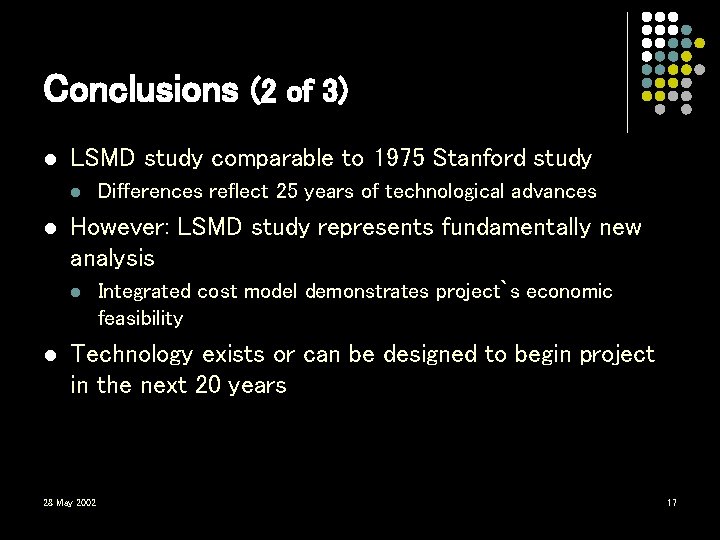
Conclusions (2 of 3) l LSMD study comparable to 1975 Stanford study l l However: LSMD study represents fundamentally new analysis l l Differences reflect 25 years of technological advances Integrated cost model demonstrates project`s economic feasibility Technology exists or can be designed to begin project in the next 20 years 28 May 2002 17
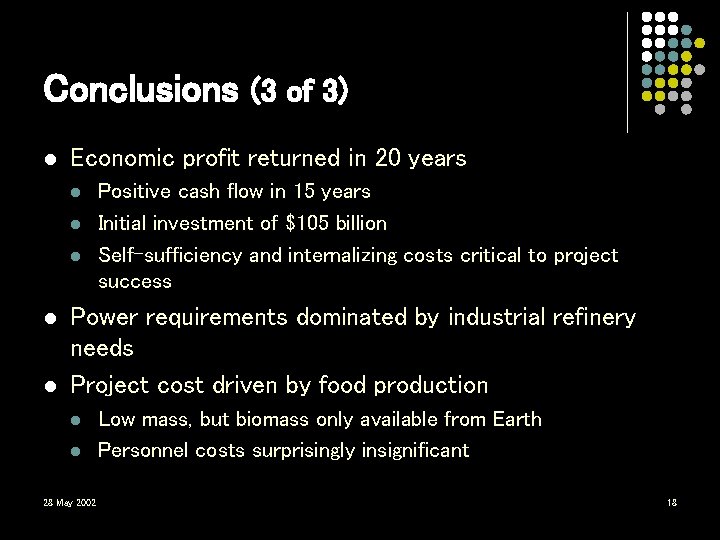
Conclusions (3 of 3) l Economic profit returned in 20 years l l l Positive cash flow in 15 years Initial investment of $105 billion Self-sufficiency and internalizing costs critical to project success Power requirements dominated by industrial refinery needs Project cost driven by food production l l 28 May 2002 Low mass, but biomass only available from Earth Personnel costs surprisingly insignificant 18