The Nature of Science The Methods of Science


 State a problem.")
 Gather information")
 Form a hypothesis n or educated guess based on knowledge and observation.")
 An experiment with variables is a common way to test")


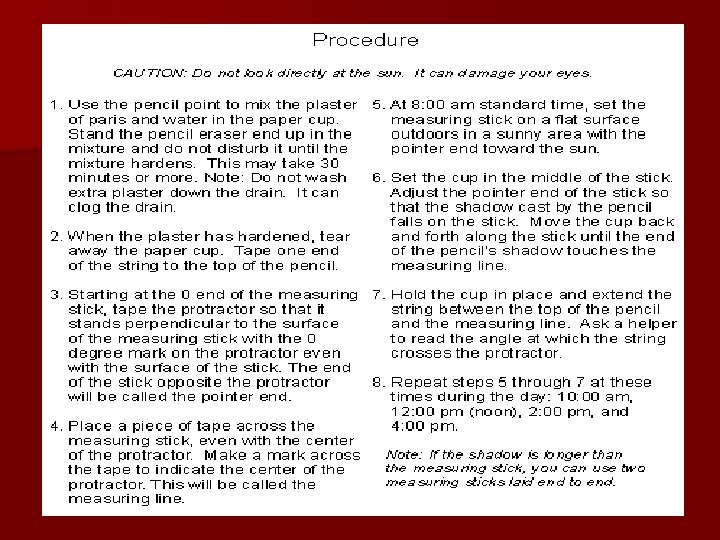
 Analyze data n from an experiment or investigation.")
 Form a conclusion based on the data.")
 Reduce bias n by keeping accurate records, using measurable data, and repeating the")


- Slides: 76
The Nature of Science The Methods of Science Scientific Measurements Graphing
The Methods of Science The Scientific Method Chapter 1
The Methods of Science n Science studies natural patterns. n Science is classified into three main categories: life science
Earth science
and physical science n sometimes a scientific study will overlap the categories.
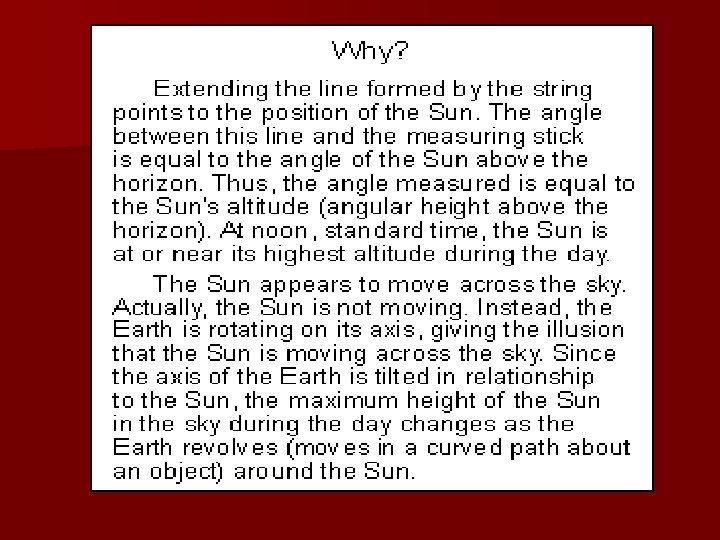
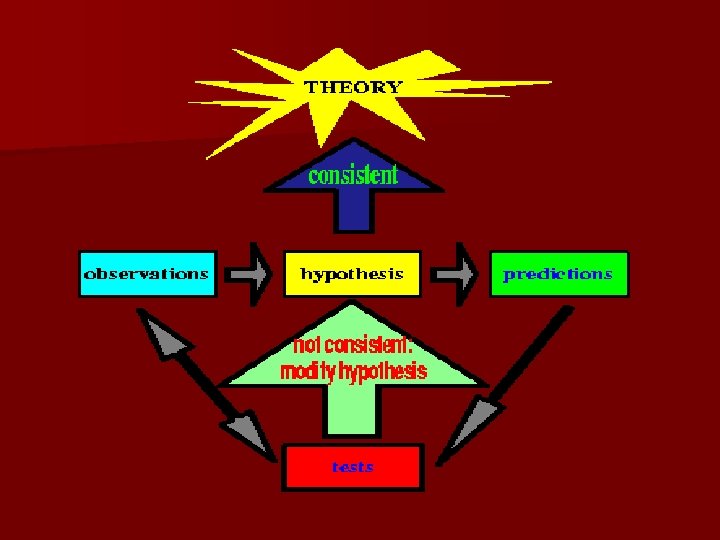
The Methods of Science n Science explains the natural world; explanations can change over time.
Scientists investigate n nature by observation, experimentation, or modeling.
Scientific method n Organized set of investigation procedures n 1) State a problem.
2) Gather information
3) Form a hypothesis n or educated guess based on knowledge and observation.
Scientific method n 4) An experiment with variables is a common way to test a hypothesis.
Experimental variables n A. A dependent variable changes value as other variables change. n B. An independent variable is changed to determine how it will affect the dependent variable.
Scientific method n C. A variable that does not change when other variables change is a constant. n D. A control is the standard to which test results can be compared.
5) Analyze data n from an experiment or investigation.
Scientific method n 6) Form a conclusion based on the data.
7) Reduce bias n by keeping accurate records, using measurable data, and repeating the experiment.
Models n Represent ideas, events, or objects and can be physical or computerized.
A theory n is an explanation based on many observations and investigations;
A scientific law n is a statement about something that always seems to be true.
Science deals with the natural world n Questions answered. of value or emotion cannot be
Technology n Applied science helping people
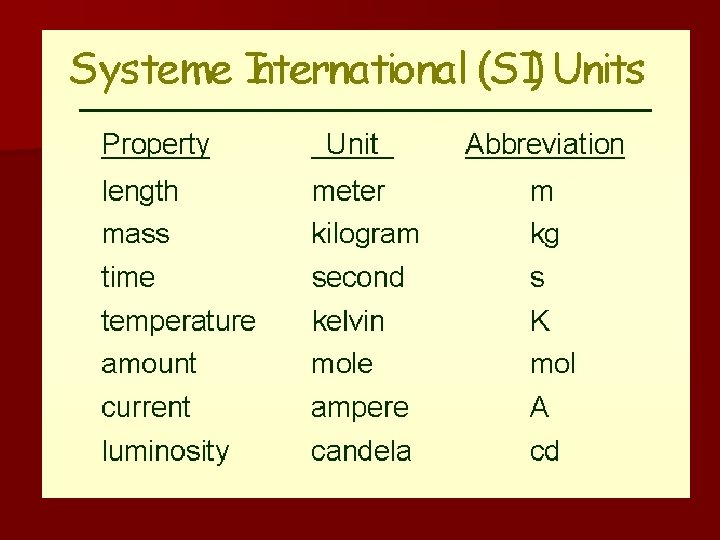
Standard n Exact quantity that people agree to use for comparison
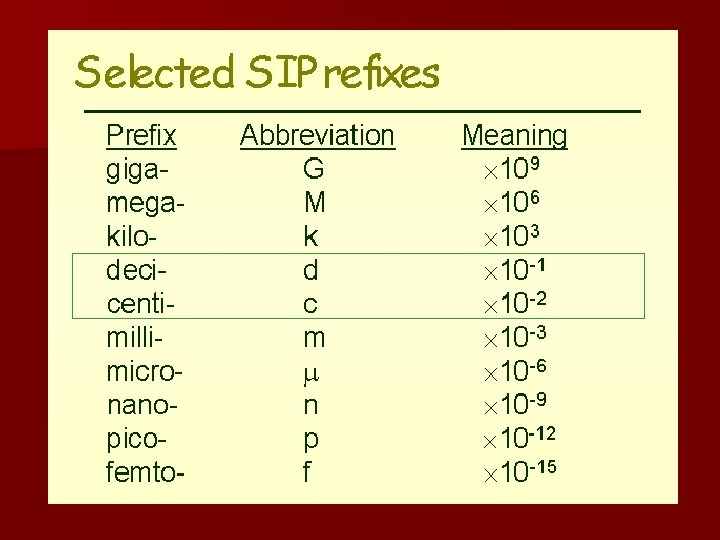
Standards of Measurement n Measurements must have a number and a unit. n SI – an improved version of the metric system used and understood by scientists worldwide.
SI system n is based on multiples of 10 and uses prefixes to indicate a specific multiple.
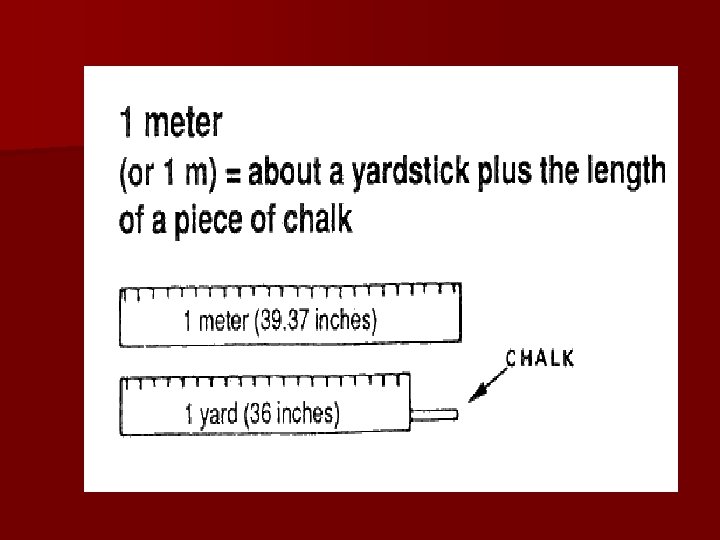
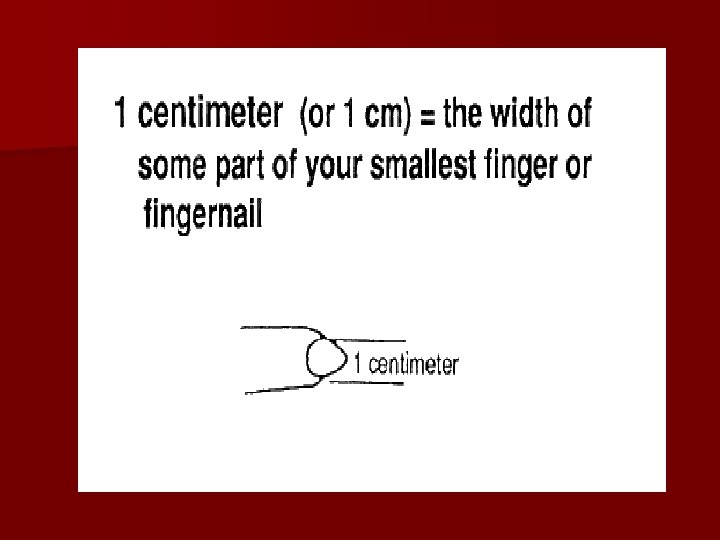
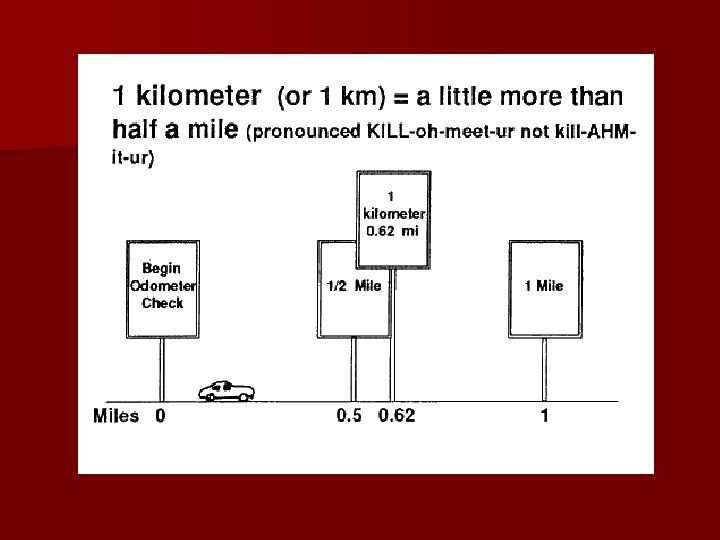
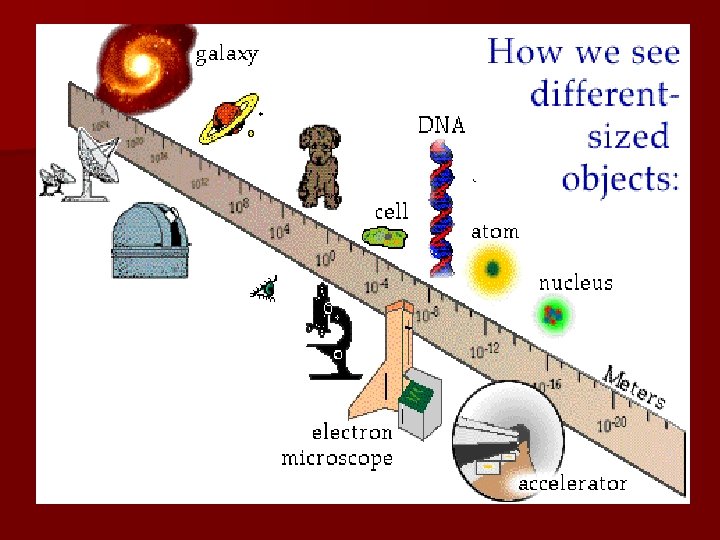
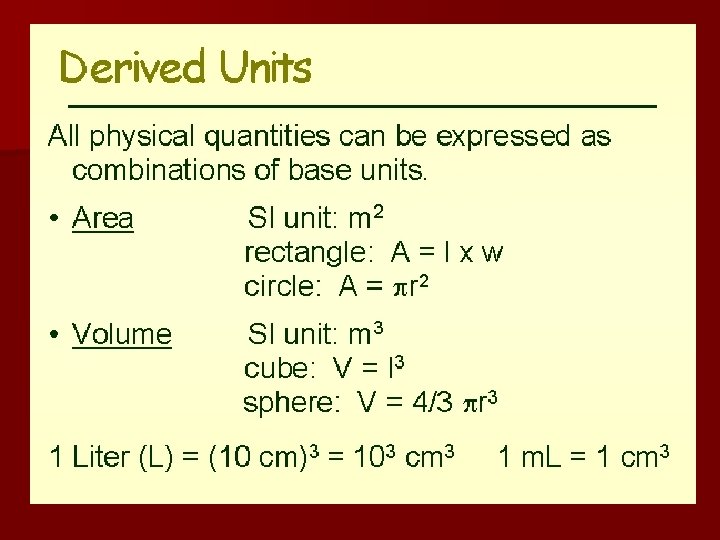
Length n Is measured using a unit appropriate for the distance between two points.
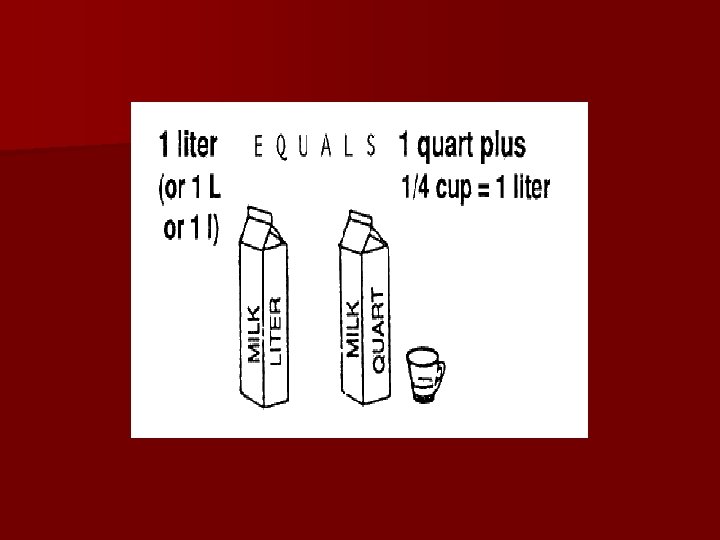
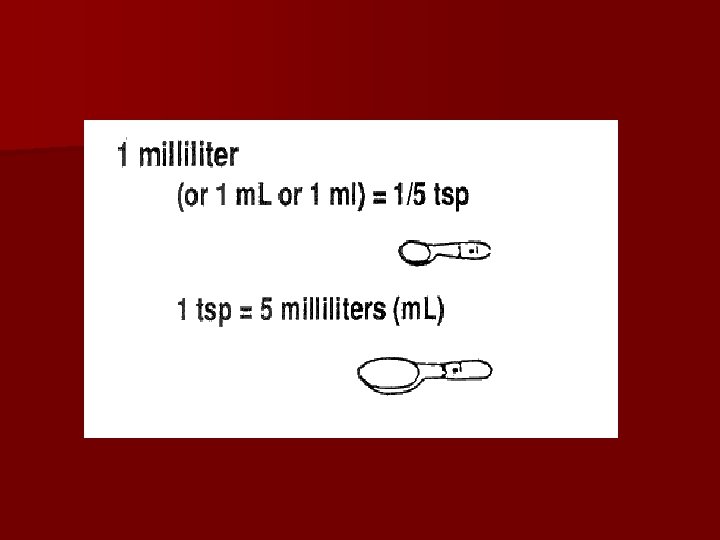
Volume The amount of space an object n occupies. n
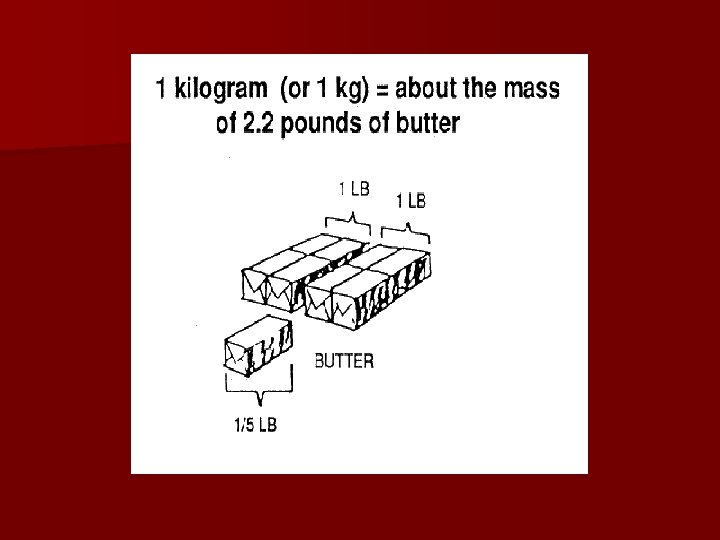
Mass n Measure of matter in an object
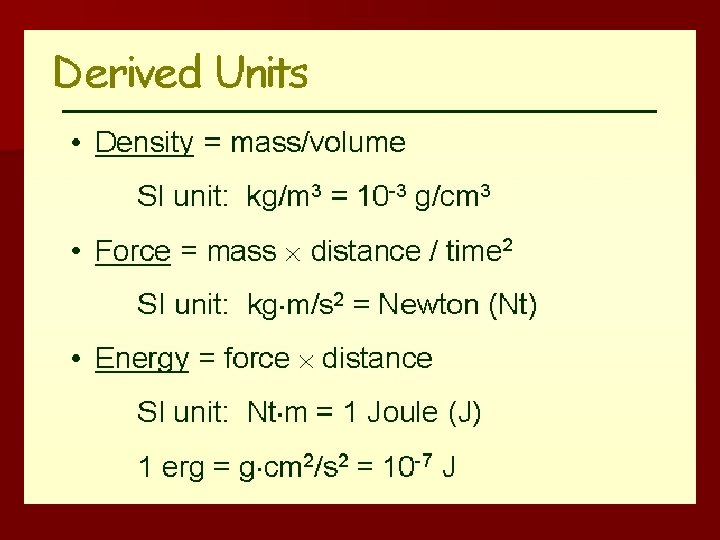
Density n Mass per unit volume of a material.
Derived unit n. A unit obtained by combining different SI units.
Time n The interval between two events
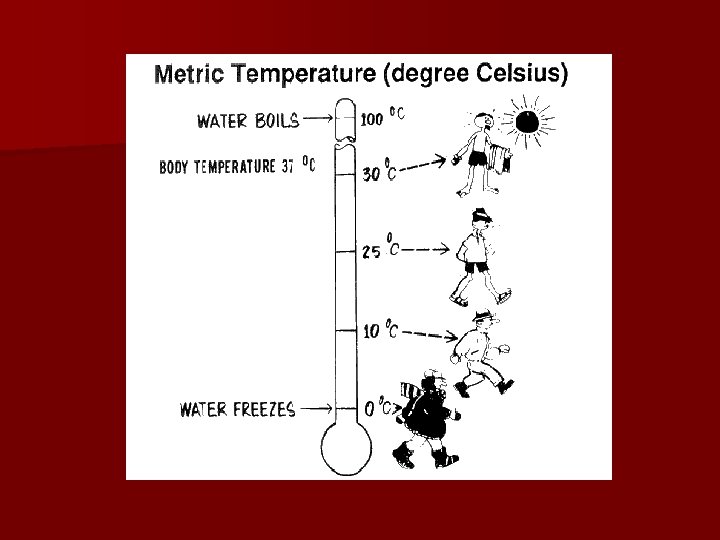
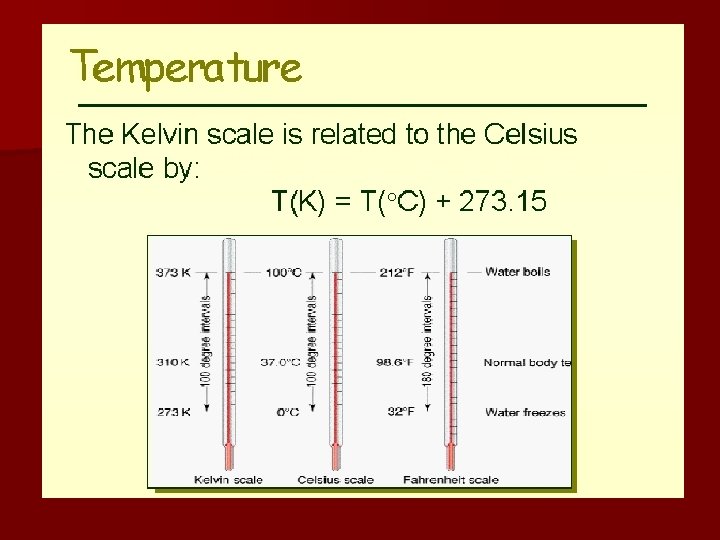
Temperature n Is measured using a thermometer.
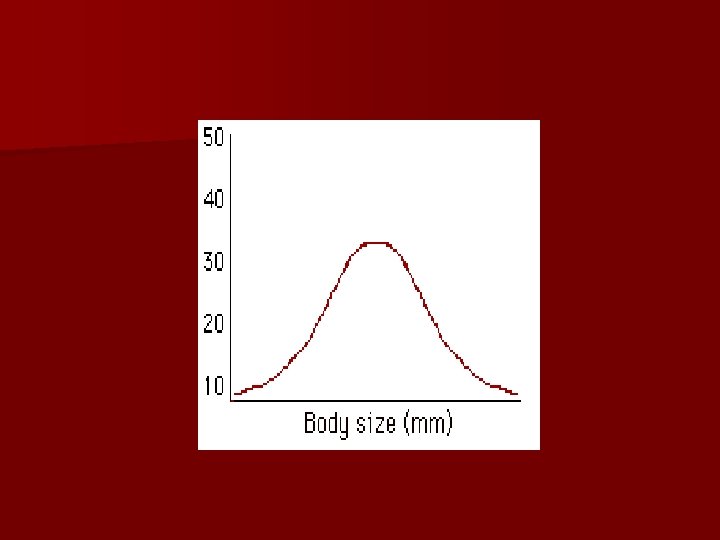
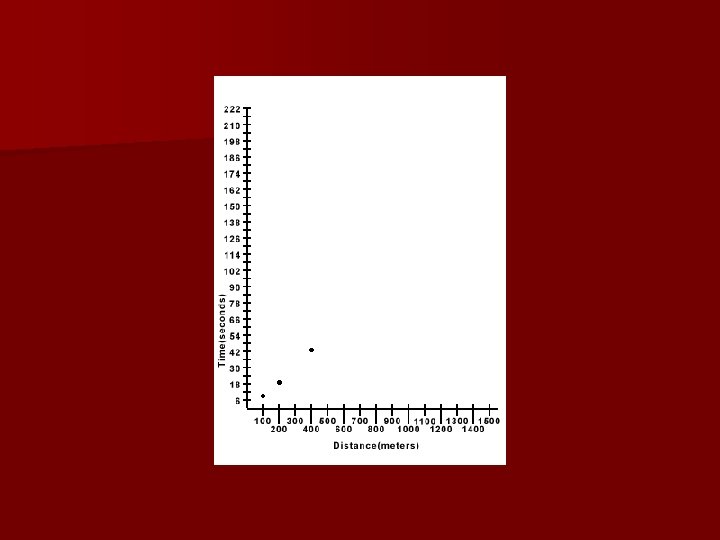
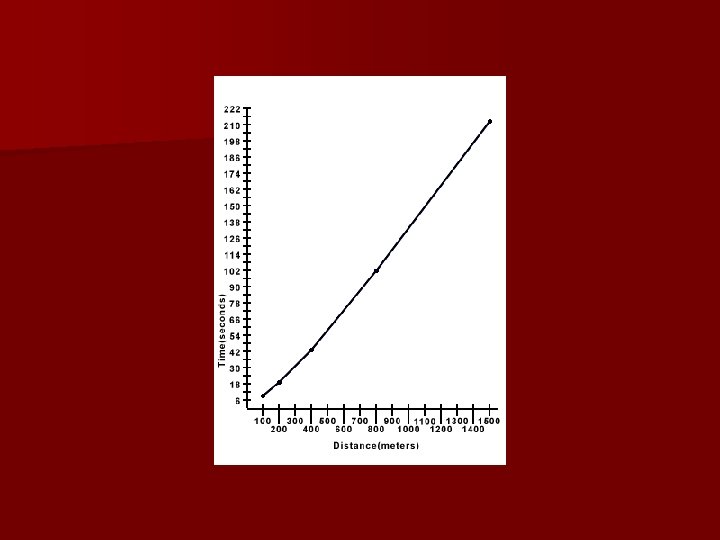
Graph n Visual display of information or data that is used to detect patterns n A line graph shows a relationship where the dependent variable changes due to a change in the independent variable.
Line graph n The scale should make the graph readable. n The x-axis should always be used for the independent variable. n Units of measurement must be consistent.
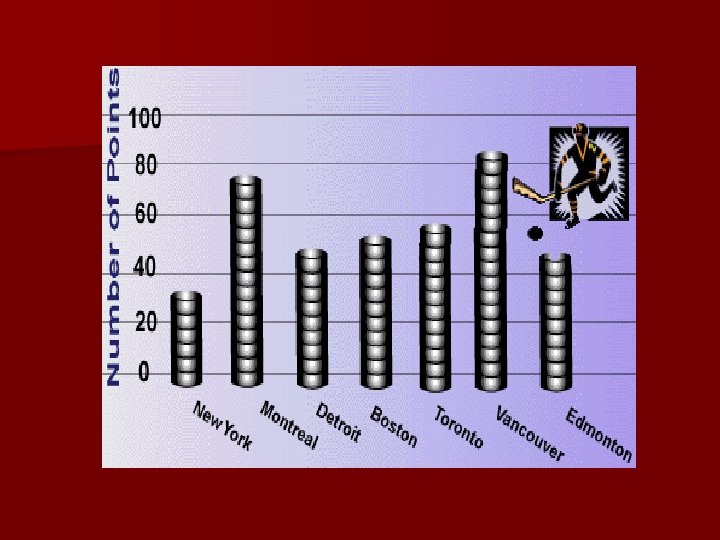
Bar graphs n Compare information collected by counting.
Circle graphs n Show a whole is broken into parts.
What axis should always be used for the independent variable? n The x – axis
What is the difference between the Independent and Dependent Variable? ? The dependent variable is the variable that changes when the independent variable is altered - that is, the dependent variable is what changes as a result of what you did in the experiment.
Drawing a Graph by Hand * Always use a straight edge to make any marks or lines on your graph *Always use as much of the graph paper as possible
Where do I begin? *Identify the independent and dependent variables of your experiment * Organize your data into a chart or table
Steps to follow: *Write the label of the independent variable on the x-axis. Be sure to include the units that were used. *Write the label of the dependent variable on the y-axis. Be sure to include the units that were used.
Steps to follow continued: *Subtract the lowest value of the independent variable from the highest value. This gives you the range for the independent variable. * Mark off the x-axis in a way that best fits the range of the independent variable. Spread out the data as much as possible. *Number the x-axis. Don’t forget to label zero if your data begins at zero.
Steps to follow continued: *Repeat the above steps for the y-axis *Plot your data values on the graph. Make each mark a small, dark dot. *Draw the best straight line or curve that best fits your data markings. Not every dot must fall on the line!
What is extrapolation? Extrapolation of data is the prediction of data beyond the graphed data points
What is interpolation? *Interpolation is the prediction of data located between known data points.
Let’s Extrapolate !! How many grams of Na. Cl will dissolve in 150 ml of water? 10 g of Na. Cl
Let’s Interpolate!! How many grams of Na. Cl will dissolve in 100 ml of water? 6. 7 g of Na. Cl