The Methods of Multivariate Statistical Analysis Survival Analysis


 Standard Number T Survival Failure Error Failed Left 14. 000 0. 5200 0.")

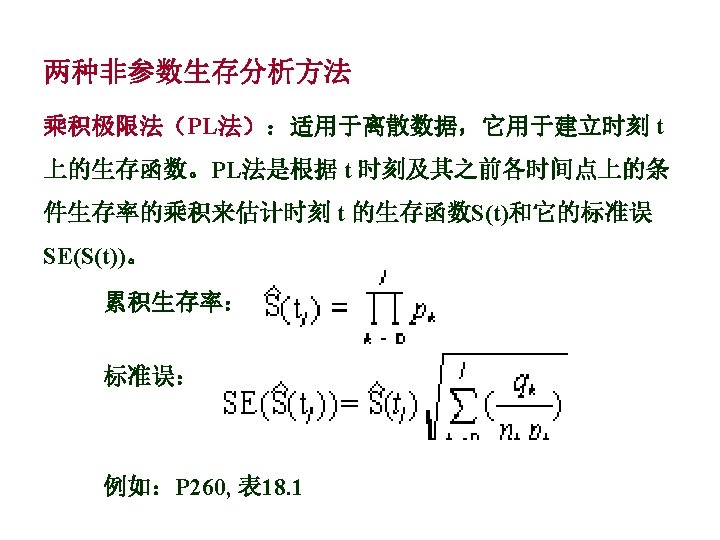


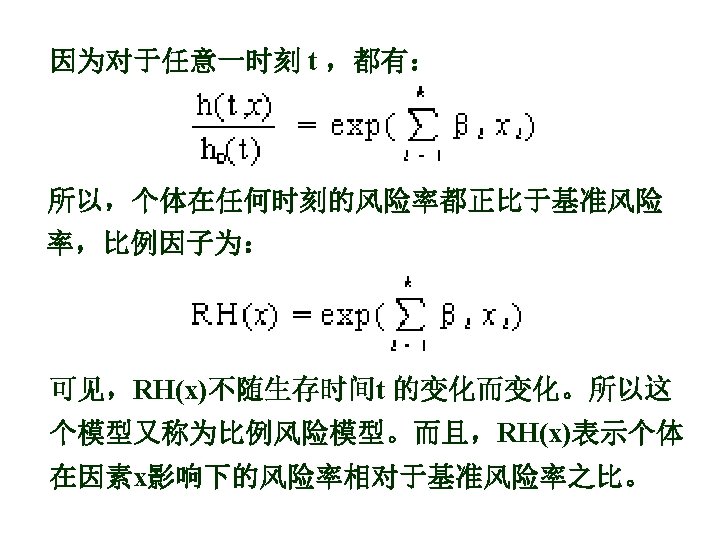
 Effective Conditional Probability")


- Slides: 49
多元统计分析方法 The Methods of Multivariate Statistical Analysis
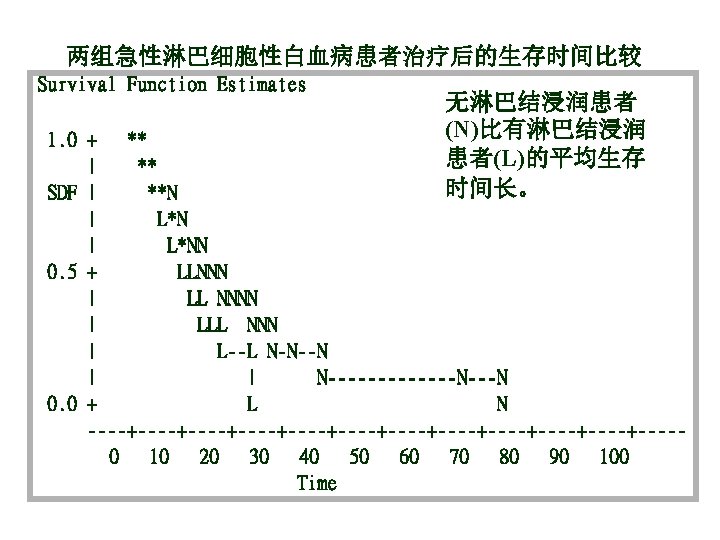
第十章 生存分析 Survival Analysis
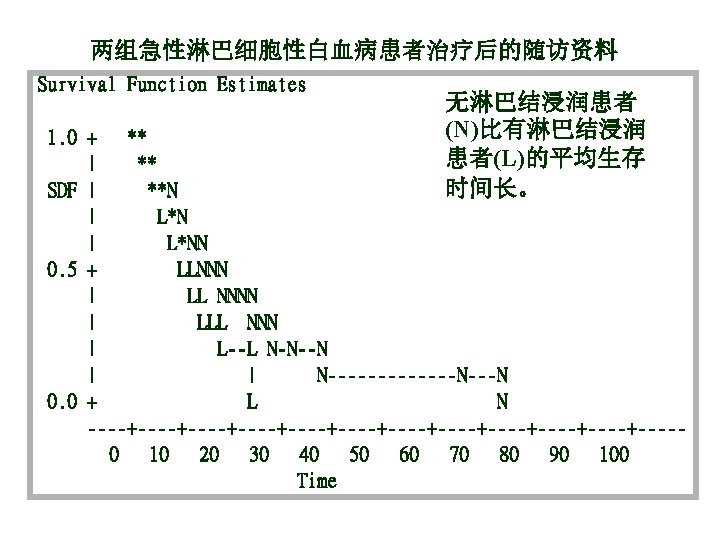
LA组生存时间分布规律 T 0. 000 1. 000 2. 000 3. 000 4. 000 5. 000 7. 000 8. 000 9. 000 10. 000 11. 000 13. 000 14. 000 15. 000 18. 000 19. 000* 20. 000* 21. 000* 23. 000 Survival 1. 0000 0. 9444 0. 8889 0. 8333 0. 7778 0. 7222 0. 6667 0. 6111 0. 5556 0. 5000 0. 4444 0. 3889 0. 3333 0. 2778 0. 2222. . . 0 Failure 0 0. 0556 0. 1111 0. 1667 0. 2222 0. 2778 0. 3333 0. 3889 0. 4444 0. 5000 0. 5556 0. 6111 0. 6667 0. 7222 0. 7778. . . 1. 0000 Standard Error 0 0. 0540 0. 0741 0. 0878 0. 0980 0. 1056 0. 1111 0. 1149 0. 1171 0. 1179 0. 1171 0. 1149 0. 1111 0. 1056 0. 0980. . . 0 Number Failed 0 1 2 3 4 5 6 7 8 9 10 11 12 13 14 14 15 Number Left 18 17 16 15 14 13 12 11 10 9 8 7 6 5 4 3 2 1 0
NLA组生存时间分布规律 Standard Number Error Failed Left T Survival Failure 0. 000 1. 0000 0 25 1. 000 0. 9600 0. 0400 0. 0392 1 24 2. 000 0. 9200 0. 0800 0. 0543 2 23 3. 000 0. 8800 0. 1200 0. 0650 3 22 4. 000 0. 8400 0. 1600 0. 0733 4 21 5. 000 0. 8000 0. 2000 0. 0800 5 20 7. 000 0. 7600 0. 2400 0. 0854 6 19 8. 000 0. 7200 0. 2800 0. 0898 7 18 9. 000 0. 6800 0. 3200 0. 0933 8 17 10. 000 0. 6400 0. 3600 0. 0960 9 16 11. 000 0. 6000 0. 4000 0. 0980 10 15 13. 000 0. 5600 0. 4400 0. 0993 11 14
NLA组生存时间分布规律(续) Standard Number T Survival Failure Error Failed Left 14. 000 0. 5200 0. 4800 0. 0999 12 13 15. 000 0. 4800 0. 5200 0. 0999 13 12 18. 000 0. 4400 0. 5600 0. 0993 14 11 19. 000 0. 4000 0. 6000 0. 0980 15 10 . . . 15 9 21. 000 0. 3556 0. 6444 0. 0966 16 8 23. 000 0. 3111 0. 6889 0. 0942 17 7 26. 000 0. 2667 0. 7333 0. 0906 18 6 28. 000 0. 2222 0. 7778 0. 0857 19 5 31. 000 0. 1778 0. 8222 0. 0793 20 4 37. 000 0. 1333 0. 8667 0. 0708 21 3 66. 000 0. 0889 0. 9111 0. 0596 22 2 73. 000 0. 0444 0. 9556 0. 0433 23 1 . . . 23 0 20. 000* 124. 000*
【SAS程序】 data d 1; input sln $ n; do i=1 to n; input t @@; if t<0 then censor=0; else censor=1; t=abs(t); output; end; cards; LA 18 1 2 3 4 5 7 8 9 10 11 13 14 15 18 -19 -20 -21 23 NLA 25 1 2 3 4 5 7 8 9 10 11 13 14 15 18 19 -20 21 23 26 28 31 37 66 73 -124 run; proc lifetest plots=(s, lls) method=pl ; time t*censor(0); strata sln; run;
The LIFETEST Procedure Product-Limit Survival Estimates T 0. 000 1. 000 2. 000 3. 000 4. 000 5. 000 7. 000 8. 000 9. 000 10. 000 11. 000 13. 000 14. 000 15. 000 18. 000 19. 000* 20. 000* 21. 000* 23. 000 Survival 1. 0000 0. 9444 0. 8889 0. 8333 0. 7778 0. 7222 0. 6667 0. 6111 0. 5556 0. 5000 0. 4444 0. 3889 0. 3333 0. 2778 0. 2222. . . 0 Failure 0 0. 0556 0. 1111 0. 1667 0. 2222 0. 2778 0. 3333 0. 3889 0. 4444 0. 5000 0. 5556 0. 6111 0. 6667 0. 7222 0. 7778. . . 1. 0000 SLN = LA Survival Standard Error 0 0. 0540 0. 0741 0. 0878 0. 0980 0. 1056 0. 1111 0. 1149 0. 1171 0. 1179 0. 1171 0. 1149 0. 1111 0. 1056 0. 0980. . . 0 Number Failed 0 1 2 3 4 5 6 7 8 9 10 11 12 13 14 14 15 Number Left 18 17 16 15 14 13 12 11 10 9 8 7 6 5 4 3 2 1 0
生存曲线的比较: H 0:k个组的生存函数曲线一致 H 1:至少两组生存函数曲线不一致。 Test of Equality over Strata Test Pr > Chi-Square DF Chi-Square Log-Rank 2. 2036 1 0. 1377 Wilcoxon 1. 5598 1 0. 2117 -2 Log(LR) 3. 4627 1 0. 0628 结论:两组患者的生存时间没有显著性差异。
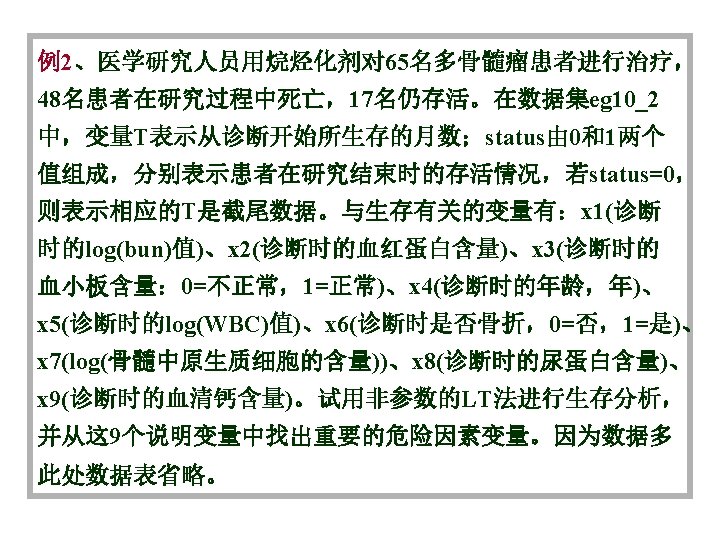
【SAS程序】 data eg 10_2;input t status x 1 -x 9;cards; 1. 25 1 2. 2175 9. 4 1 67 3. 6628 1 1. 9542 12 10 …… 77. 00 0 1. 0792 14. 0 1 60 3. 6812 0 0. 9542 0 12 run; proc lifetest plots( s, lls) time t*status(0); test x 1 -x 9; run; method=lt width=12;
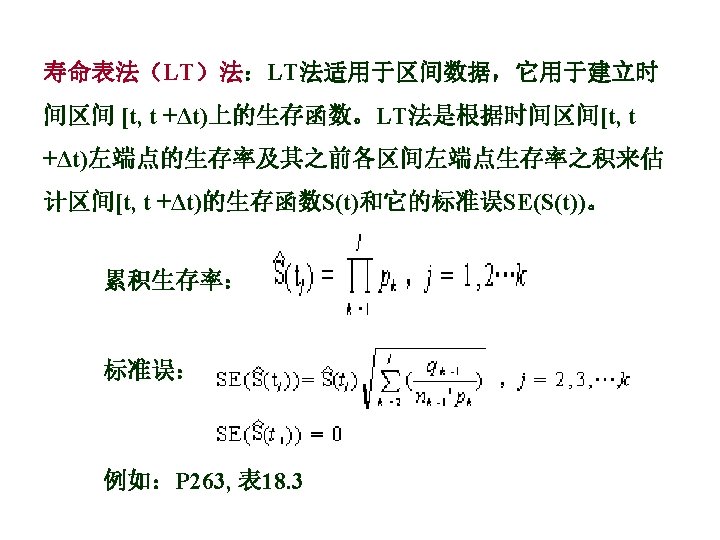
The LIFETEST Procedure Life Table Survival Estimates Conditional Interval [Lower, Upper) Effective Conditional Probability Number Sample Probability Standard Failed Censored Size of Failure Error 0 12 21 6 62. 0 0. 3387 0. 0601 12 24 10 6 35. 0 0. 2857 0. 0764 24 36 5 1 21. 5 0. 2326 0. 0911 36 48 3 1 15. 5 0. 1935 0. 1004 48 60 4 2 11. 0 0. 3636 0. 1450 60 72 2 0 6. 0 0. 3333 0. 1925 72 84 0 1 3. 5 0 0 84 . 3 0 3. 0 1. 0000 0
Forward Stepwise Sequence of Chi-Squares for the LOG RANK Test Pr > Variable DF Chi-Square Pr > Chi-Square Increment X 1 1 8. 5164 0. 0035 X 2 2 12. 7252 0. 0017 4. 2089 0. 0402 X 9 3 15. 3053 0. 0016 2. 5801 0. 1082 X 4 4 16. 9873 0. 0019 1. 6820 0. 1947 X 6 5 17. 6291 0. 0034 0. 6417 0. 4231 X 7 6 17. 9120 0. 0065 0. 2830 0. 5948 X 3 7 18. 1517 0. 0113 0. 2397 0. 6244 X 5 8 18. 3925 0. 0185 0. 2408 0. 6236 X 8 9 18. 4550 0. 0302 0. 0625 0. 8025 危 险 因 素
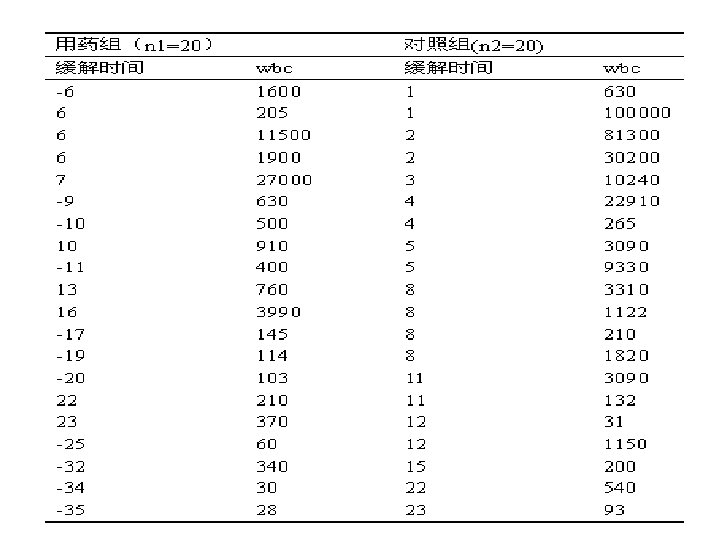
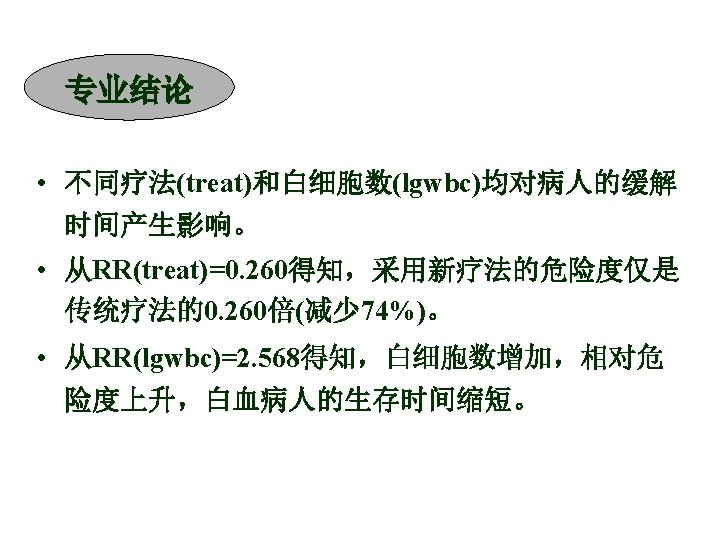
令treat=1表示治疗组,treat=0表示对照组;wbc表 示白细胞计数,是连续变量。为了减少内部变异的 影响,将白细胞计数取自然对数。 SAS程序 data d 1; do i=1 to 20; do treat=1 , 0; input time wbc @@ ; if time<0 then censor=0; else censor=1; time=abs(time); lgwbc=log(wbc); output; end; cards; -6 1600 1 630 …… -35 28 23 93 run; proc phreg; model time*censor(0)=treat lgwbc / risklimits; run;
SAS输出结果 The PHREG Procedure Testing Global Null Hypothesis: BETA=0 Without With Covariates 177. 760 136. 516 41. 245 with 2 DF (p=0. 0001) Score . . 40. 746 with 2 DF (p=0. 0001) Wald . . 30. 478 with 2 DF (p=0. 0001) Criterion -2 LOG L Model Chi-Square Analysis of Maximum Likelihood Estimates Conditional Risk Ratio and 95% Confidence Limits Variable DF Parameter Standard Estimate Error Wald Pr > Risk Chi-Square Ratio Lower Upper TREAT 1 -1. 347940 0. 42883 9. 88034 0. 0017 0. 260 0. 112 0. 602 LGWBC 1 0. 669281 0. 13963 22. 97495 0. 0001 1. 953 1. 485 2. 568