The Median Test The median test is a


 12(b) 20(a+b) Below")
- Slides: 11
The Median Test • The median test is a non-parametric test that is used to test whether two (or more) independent groups differ in central tendency - specifically whether the groups have been drawn from a population with the same median. • The null hypothesis is that the groups are drawn from populations with the same median.
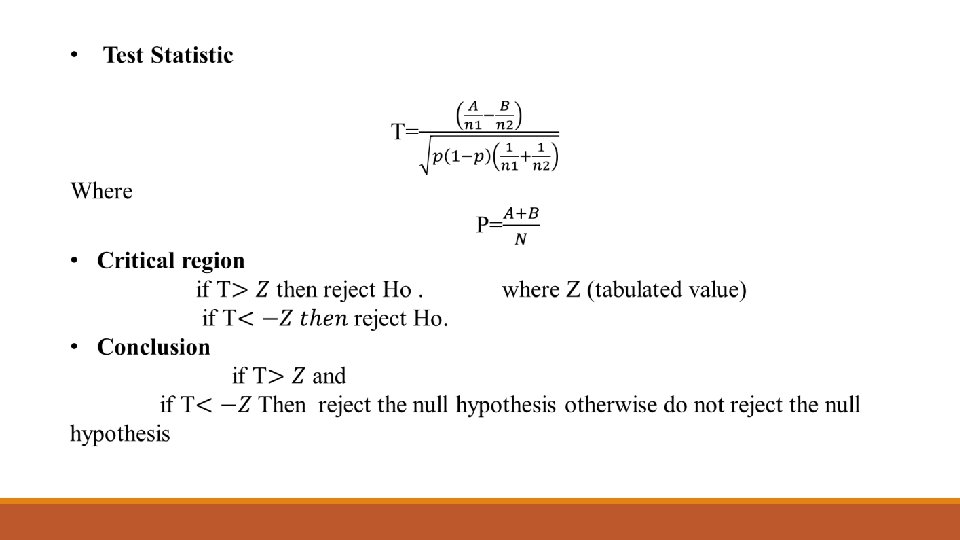
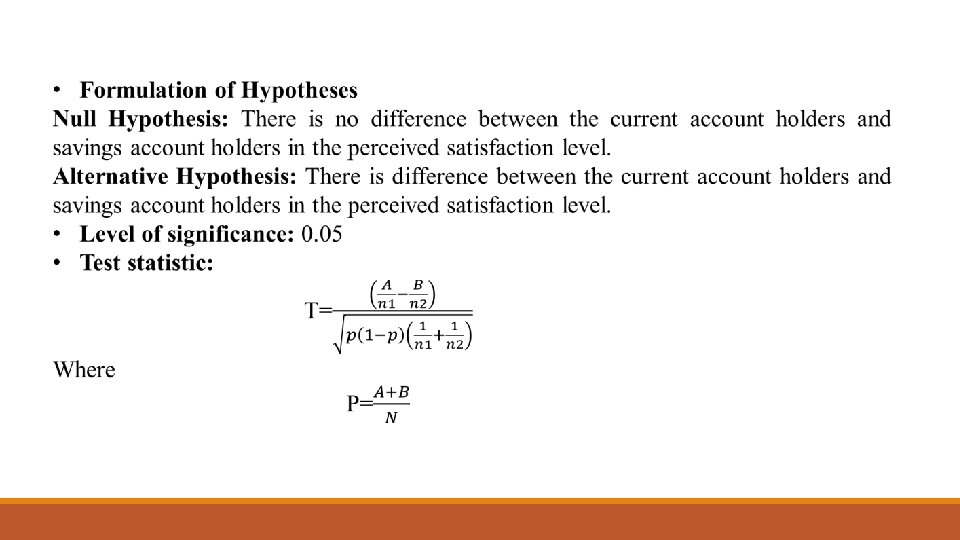
General Procedure • Hypothesis Null hypothesis H 0 : the two groups are from populations with the same median Alternate hypothesis H 1 : the median of one population is different from that of the other (two-tailed test) • Level of significance : α=0. 05
Example A private bank is interested in finding out whether the customers belonging to two groups differ in their satisfaction level. The two groups are customers belonging to current account holders and savings account holders. A random sample of 20 customers of each category was interviewed regarding their perceptions of the bank's service quality using a Likert-type (ordinal scale) statements. A score of "1" represents very dissatisfied and a score of "5" represents very satisfied. The compiled aggregate scores for each respondent in each group are tabulated be given below: What are your conclusions regarding the satisfaction level of these two groups?
Current Account Current account Saving account 79 61 85 80 86 50 80 55 40 80 50 75 50 60 55 65 75 30 65 50 38 70 50 75 70 70 63 62 73 50 75 50 55 40 45 20 30 80 85 55 65
descending Order 86 85 85 80 80 79 75 75 73 70 70 65 65 65 63 62 Rank 1 2. 5 5. 5 8 10. 5 13 14. 5 17 17 17 19 20 Descending Order 61 60 55 55 50 50 45 40 40 38 30 30 20 Rank 21 22 24. 5 30 30 34 35. 5 37 38. 5 40
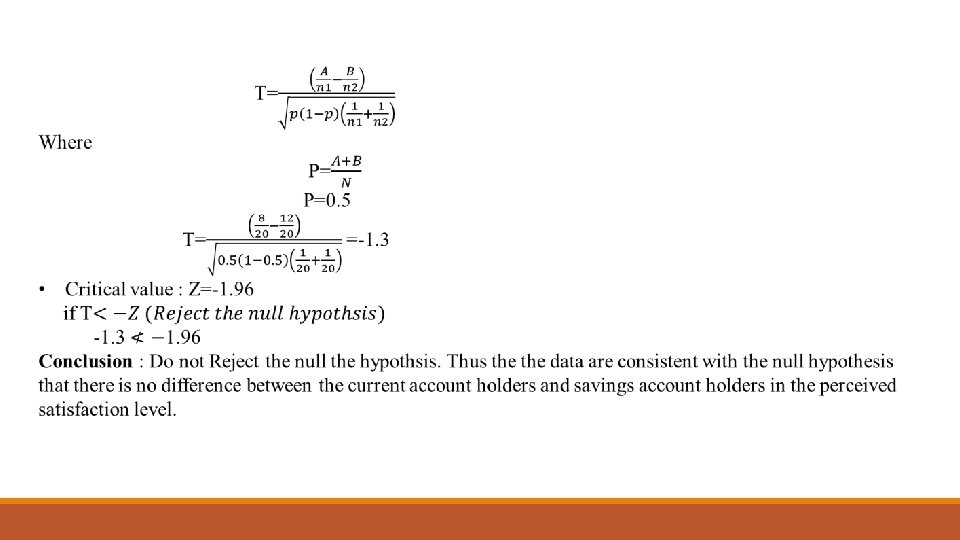
Calculations • Arrange in ascending order. • Find the grand median • Grand median is the average of 20 th and 21 st observation = (62+61)/2 =61. 5. In the above table, average rank is taken whenever the scores are tied. The next step is to prepare a contingency table of two rows and two columns. The cells represent the number of observations that are above and below the grand median in each group. Whenever some observations in each group coincide with the median value, the accepted practice is to first count the observations that are strictly above grand median and put the rest under below grand median. In other words, below grand median in such cases would include less than or equal to grand median.
Total Current Account Holders Savings Account Holders Above Grand Median 8(a) 12(b) 20(a+b) Below Grand Median 12(c) 8(d) 20(c+d) Marginal Total 20(a+c) 20(b+d) 40(a+b+c+d)= n