
The Master Budget and Responsibility Accounting Chapter 22
The Master Budget and Responsibility Accounting Chapter 22 1 Copyright © 2012 Pearson Education, Inc. Publishing as Prentice Hall.
Learning Objectives Learn why managers use budgets Understand the components of the master budget Prepare an operating budget Prepare a financial budget Use sensitivity analysis in budgeting Prepare performance reports for responsibility centers and account for traceable and common shared fixed costs 2 Copyright © 2012 Pearson Education, Inc. Publishing as Prentice Hall.
1 Learn why managers use budgets 3 Copyright © 2012 Pearson Education, Inc. Publishing as Prentice Hall.
Why Managers Use Budgets To plan and control actions and the related revenues and expenses To incorporate management’s strategic and operational plans Planning technology upgrades Planning capital asset replacements, improvements, or expansions. Compare actual results with budgeted amounts to determine corrective actions 4 Copyright © 2012 Pearson Education, Inc. Publishing as Prentice Hall.
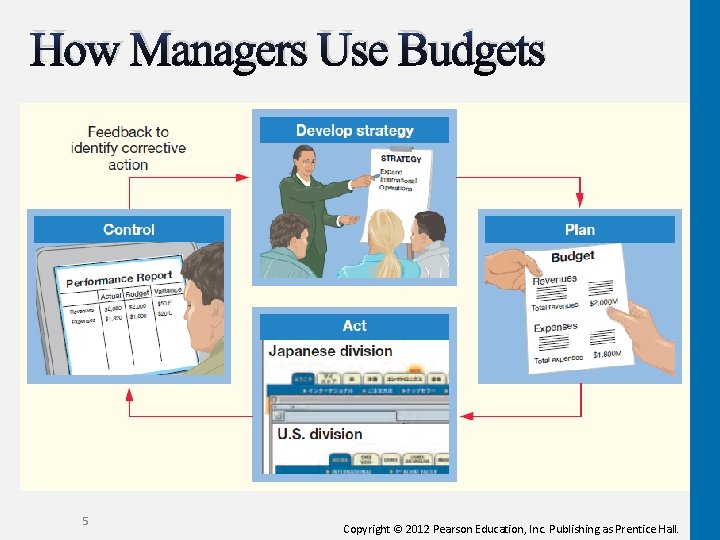
How Managers Use Budgets 5 Copyright © 2012 Pearson Education, Inc. Publishing as Prentice Hall.
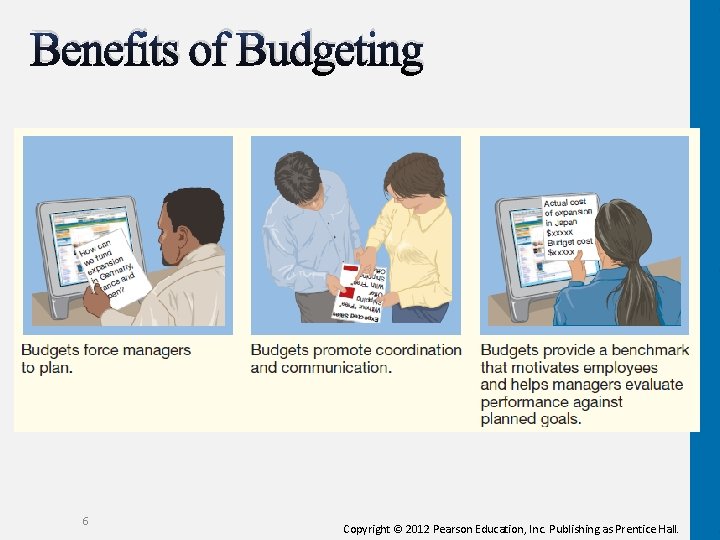
Benefits of Budgeting 6 Copyright © 2012 Pearson Education, Inc. Publishing as Prentice Hall.
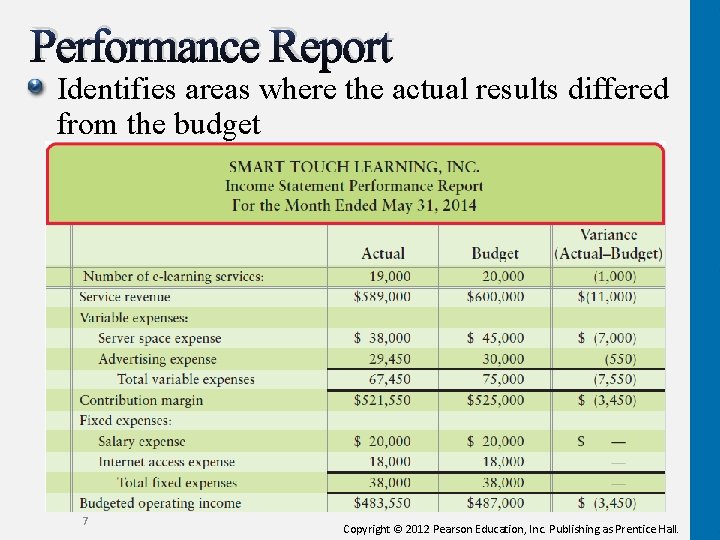
Performance Report Identifies areas where the actual results differed from the budget 7 Copyright © 2012 Pearson Education, Inc. Publishing as Prentice Hall.
2 Understand the components of the master budget 8 Copyright © 2012 Pearson Education, Inc. Publishing as Prentice Hall.
Steps Managers Take To Prepare A Master budget—the set of budgeted financial Budget statements and supporting schedules for the entire organization Budget includes three types of budgets: The operating budget The capital expenditures budget The financial budget Contain projected amounts, not actual amounts 9 Copyright © 2012 Pearson Education, Inc. Publishing as Prentice Hall.
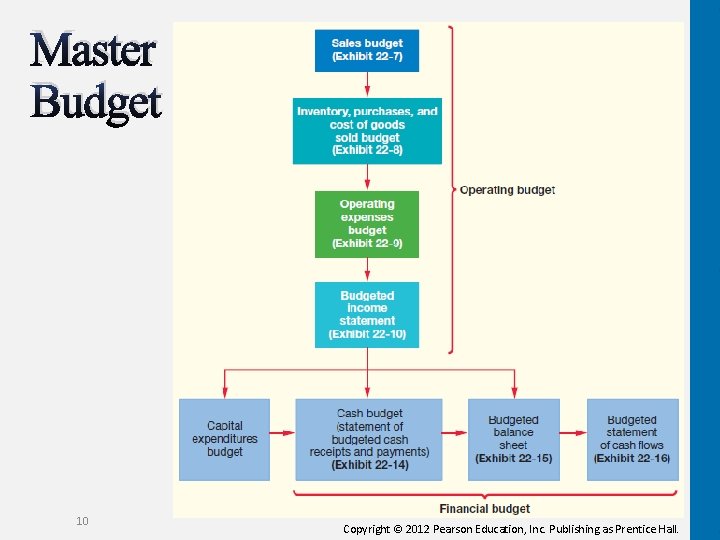
Master Budget 10 Copyright © 2012 Pearson Education, Inc. Publishing as Prentice Hall.
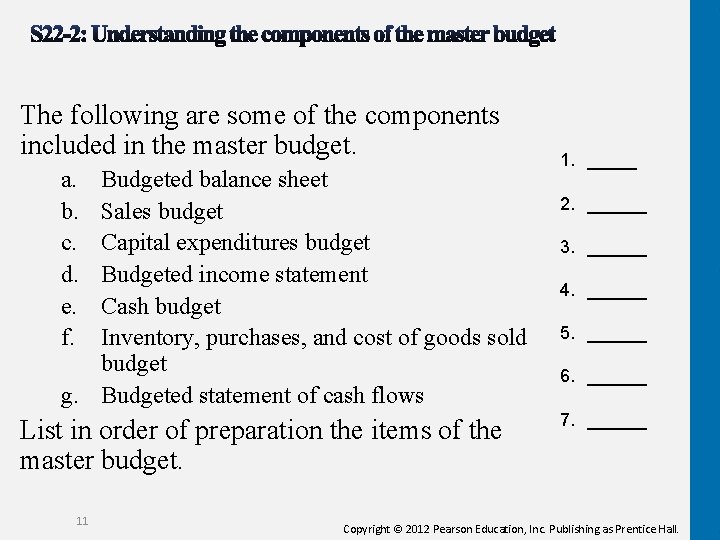
The following are some of the components included in the master budget. a. b. c. d. e. f. Budgeted balance sheet Sales budget Capital expenditures budget Budgeted income statement Cash budget Inventory, purchases, and cost of goods sold budget g. Budgeted statement of cash flows List in order of preparation the items of the master budget. 11 1. _____ 2. ______ 3. ______ 4. ______ 5. ______ 6. ______ 7. ______ Copyright © 2012 Pearson Education, Inc. Publishing as Prentice Hall.
3 Prepare an operating budget 12 Copyright © 2012 Pearson Education, Inc. Publishing as Prentice Hall.
Prepare an operating budget First three components Sales budget Inventory, purchases, and cost of goods sold budget Operating expenses Feed into the budgeted income statement 13 Copyright © 2012 Pearson Education, Inc. Publishing as Prentice Hall.
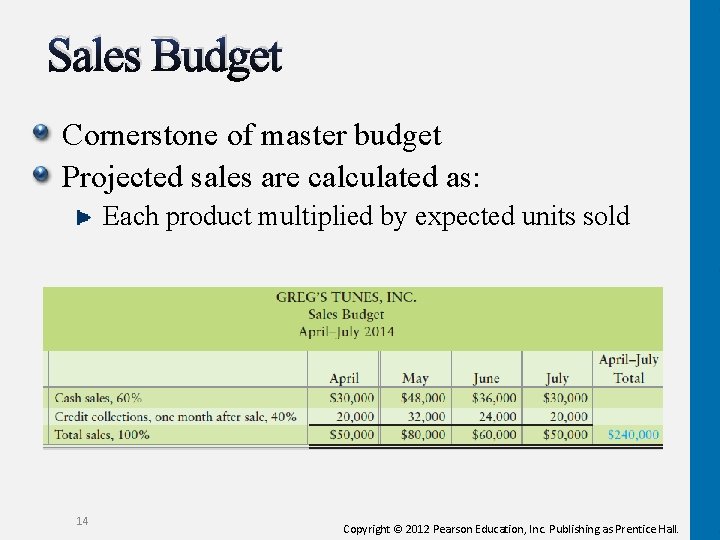
Sales Budget Cornerstone of master budget Projected sales are calculated as: Each product multiplied by expected units sold 14 Copyright © 2012 Pearson Education, Inc. Publishing as Prentice Hall.
Inventory, Purchases, and Cost of Goods Sold Budget determines: Cost of goods sold for the budgeted income statement Ending inventory for the budgeted balance sheet Purchases for the cash budget Familiar equation is used Beginning inventory + Purchases – Ending inventory = Cost of goods sold Rearrange equation to solve for unknowns Purchases = Cost of goods sold + Ending inventory – Beginning inventory 15 Copyright © 2012 Pearson Education, Inc. Publishing as Prentice Hall.
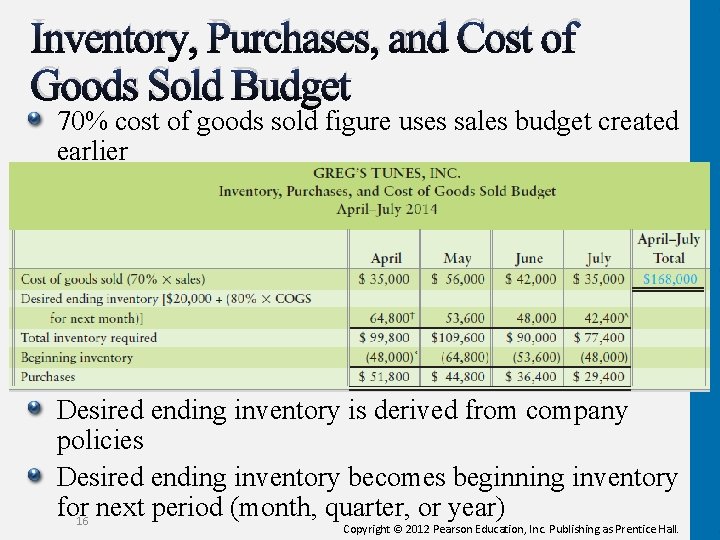
Inventory, Purchases, and Cost of Goods Sold Budget 70% cost of goods sold figure uses sales budget created earlier Desired ending inventory is derived from company policies Desired ending inventory becomes beginning inventory for next period (month, quarter, or year) 16 Copyright © 2012 Pearson Education, Inc. Publishing as Prentice Hall.
Operating Expense Budget Prepared after sales budget and cost of goods sold budget Shows estimated expenses for the period Includes fixed and/or variable expenses 17 Copyright © 2012 Pearson Education, Inc. Publishing as Prentice Hall.
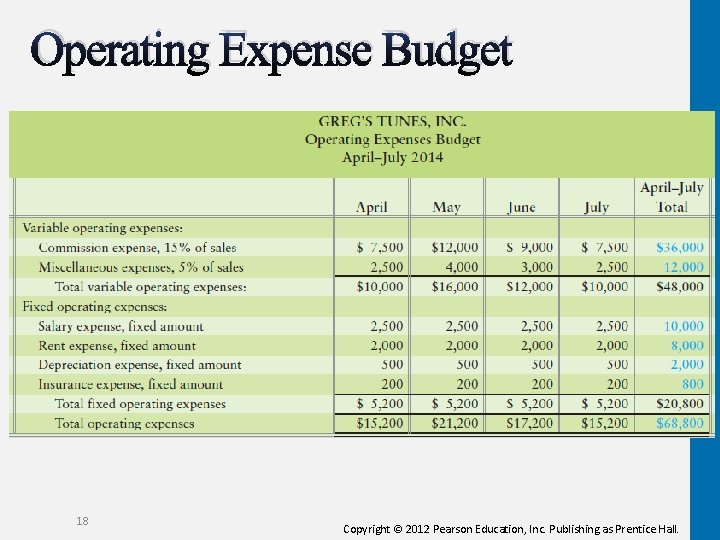
Operating Expense Budget 18 Copyright © 2012 Pearson Education, Inc. Publishing as Prentice Hall.
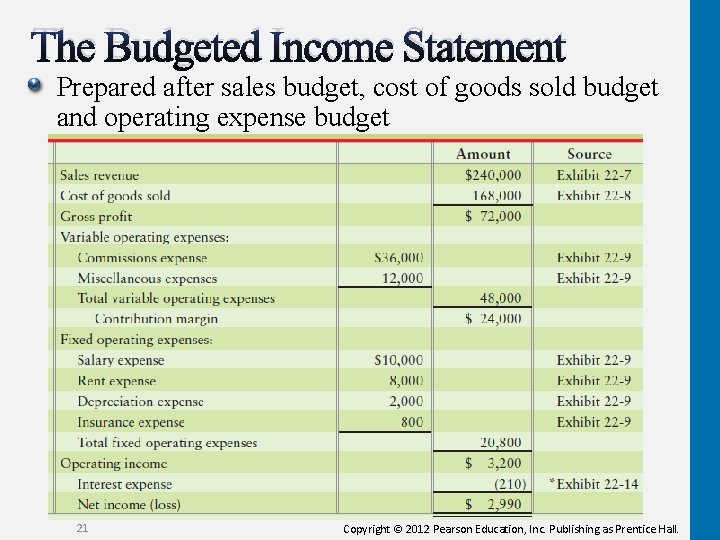
The Budgeted Income Statement Prepared after sales budget, cost of goods sold budget and operating expense budget 21 Copyright © 2012 Pearson Education, Inc. Publishing as Prentice Hall.
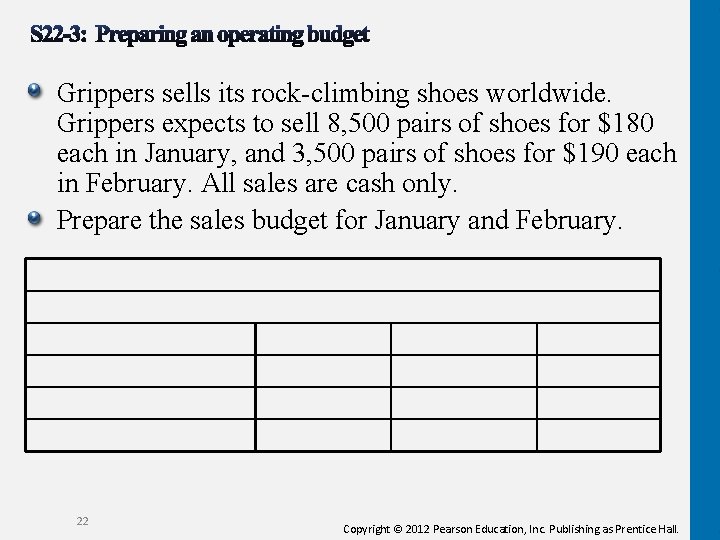
Grippers sells its rock-climbing shoes worldwide. Grippers expects to sell 8, 500 pairs of shoes for $180 each in January, and 3, 500 pairs of shoes for $190 each in February. All sales are cash only. Prepare the sales budget for January and February. 22 Copyright © 2012 Pearson Education, Inc. Publishing as Prentice Hall.
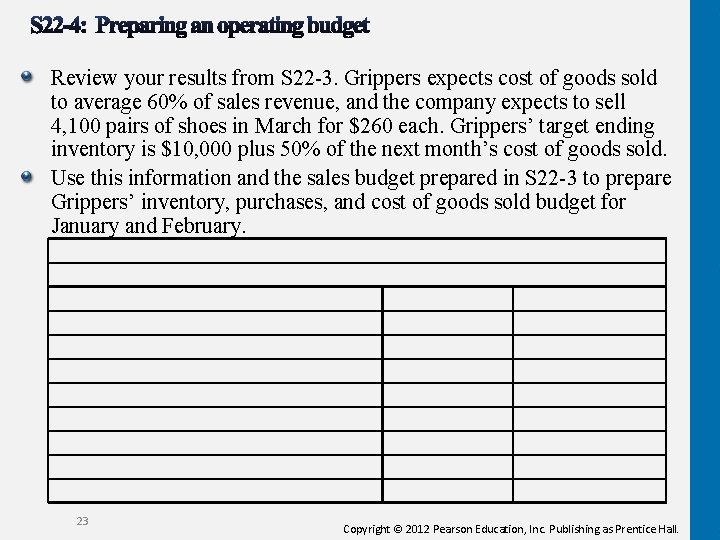
Review your results from S 22 -3. Grippers expects cost of goods sold to average 60% of sales revenue, and the company expects to sell 4, 100 pairs of shoes in March for $260 each. Grippers’ target ending inventory is $10, 000 plus 50% of the next month’s cost of goods sold. Use this information and the sales budget prepared in S 22 -3 to prepare Grippers’ inventory, purchases, and cost of goods sold budget for January and February. 23 Copyright © 2012 Pearson Education, Inc. Publishing as Prentice Hall.
4 Prepare a financial budget 24 Copyright © 2012 Pearson Education, Inc. Publishing as Prentice Hall.
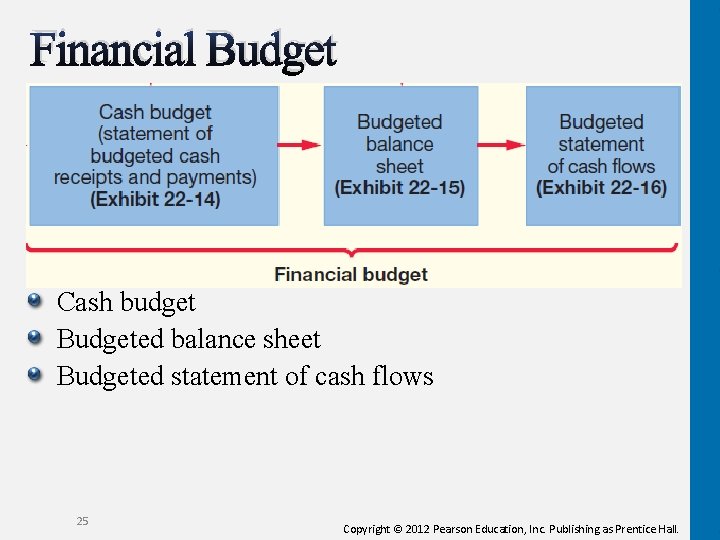
Financial Budget Cash budget Budgeted balance sheet Budgeted statement of cash flows 25 Copyright © 2012 Pearson Education, Inc. Publishing as Prentice Hall.
Cash Budget Statement of budgeted cash receipts and payments Details how to go from the beginning cash balance to the desired ending balance Four major parts: Cash collections from customers Cash payments for purchases Cash payments for operating expenses Cash payments for capital expenditures Depends on operating budget 26 Copyright © 2012 Pearson Education, Inc. Publishing as Prentice Hall.
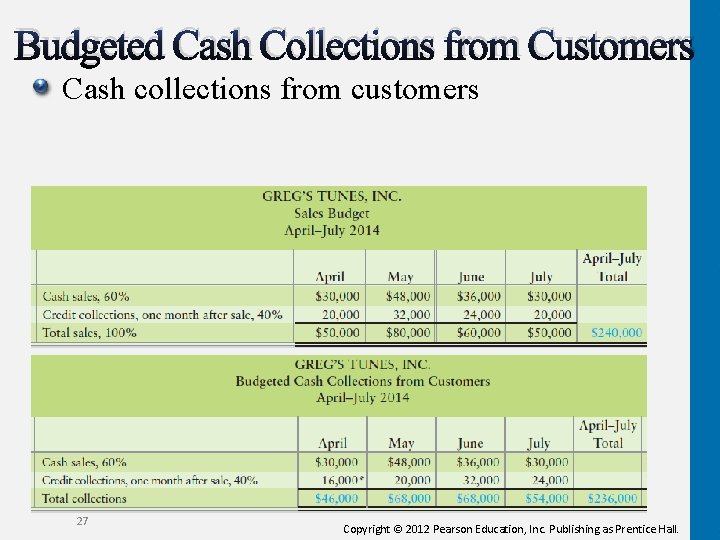
Budgeted Cash Collections from Customers Cash collections from customers 27 Copyright © 2012 Pearson Education, Inc. Publishing as Prentice Hall.
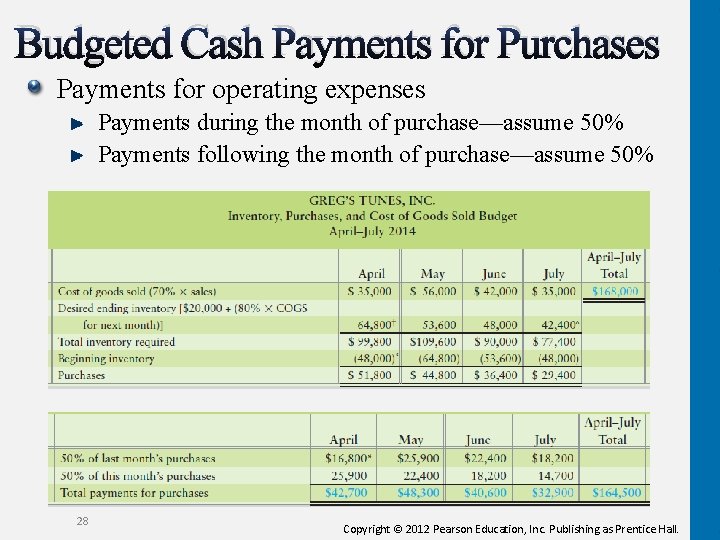
Budgeted Cash Payments for Purchases Payments for operating expenses Payments during the month of purchase—assume 50% Payments following the month of purchase—assume 50% 28 Copyright © 2012 Pearson Education, Inc. Publishing as Prentice Hall.
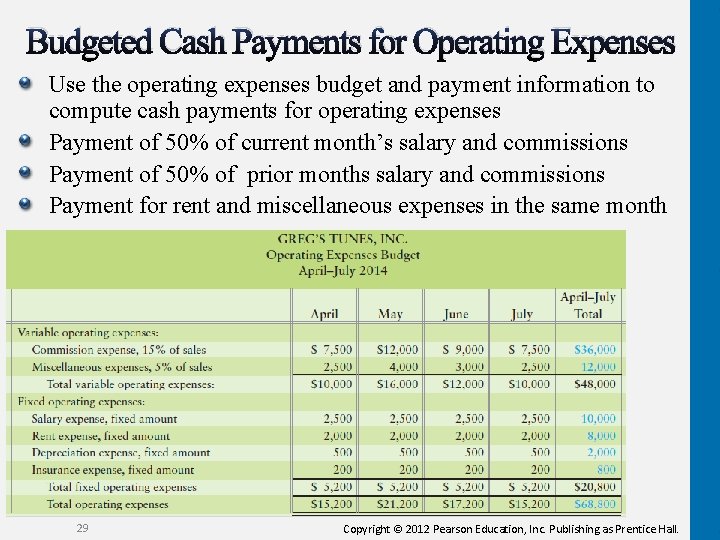
Budgeted Cash Payments for Operating Expenses Use the operating expenses budget and payment information to compute cash payments for operating expenses Payment of 50% of current month’s salary and commissions Payment of 50% of prior months salary and commissions Payment for rent and miscellaneous expenses in the same month 29 Copyright © 2012 Pearson Education, Inc. Publishing as Prentice Hall.
The Cash Budget 30 Copyright © 2012 Pearson Education, Inc. Publishing as Prentice Hall.
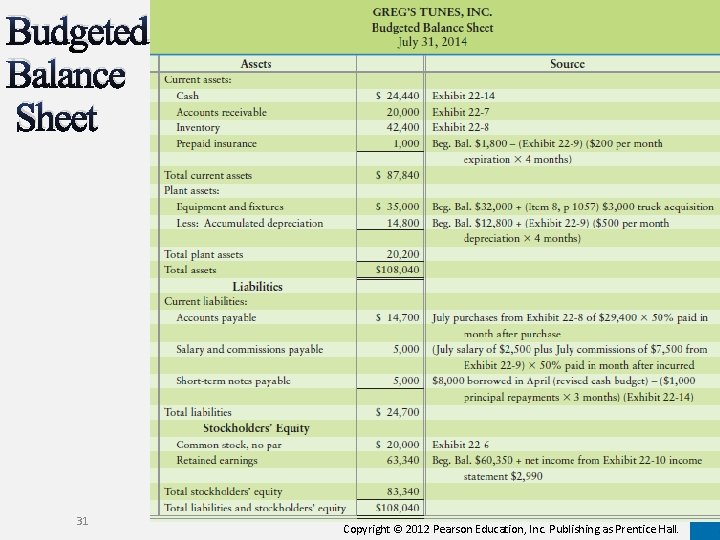
Budgeted Balance Sheet 31 Copyright © 2012 Pearson Education, Inc. Publishing as Prentice Hall.
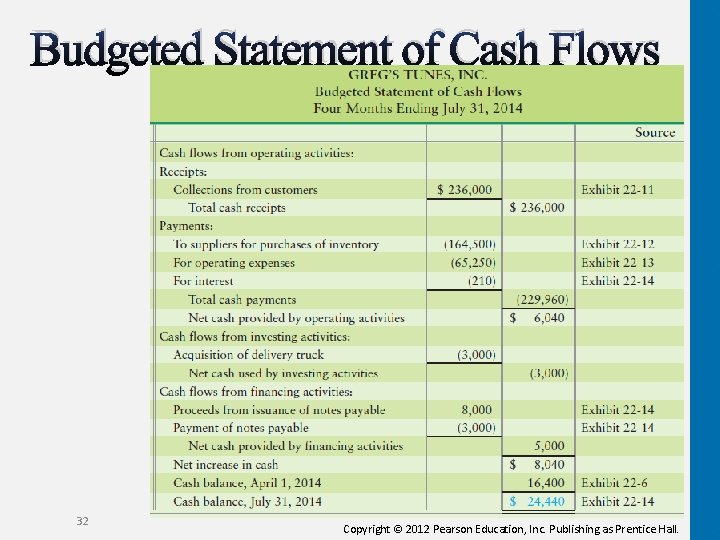
Budgeted Statement of Cash Flows 32 Copyright © 2012 Pearson Education, Inc. Publishing as Prentice Hall.
Getting Employees to Accept the Budget Most important part of the budgeting system Getting managers and employees to accept the budget Managers must motivate employees to accept the budget’s goals Do not build in slack–becomes less accurate 33 Copyright © 2012 Pearson Education, Inc. Publishing as Prentice Hall.
Refer to the Grippers sales budget that you prepared in S 22 -3. Now assume that Grippers’ sales are collected as follows: November sales totaled $400, 000 and December sales were $425, 000. 50% in the month of the sale 30% in the month after the sale 18% two months after the sale 2% never collected Prepare a schedule for the budgeted cash collections for January and February. Round answers to the nearest dollar. 34 Copyright © 2012 Pearson Education, Inc. Publishing as Prentice Hall.
35 Copyright © 2012 Pearson Education, Inc. Publishing as Prentice Hall.
Refer to the Grippers inventory, purchases, and cost of goods sold budget your prepared in S 22 -4. Assume Grippers pays for inventory purchases 50% in the month of purchase and 50% in the month after purchase. Prepare a schedule for the budgeted cash payments for purchases for January and February. 36 Copyright © 2012 Pearson Education, Inc. Publishing as Prentice Hall.
Grippers has $12, 500 in cash on hand on January 1. Refer to S 22 -5 and S 22 -6 for cash collections and cash payment information. Assume Grippers has cash payment for operating expenses including salaries of $50, 000 plus 1% of sales, all paid in the month of sale. The company requires a minimum cash balance of $10, 000. Prepare a cash budget for January and February. Will Grippers need to borrow cash by the end of February? 37 Copyright © 2012 Pearson Education, Inc. Publishing as Prentice Hall.
38 Copyright © 2012 Pearson Education, Inc. Publishing as Prentice Hall.
5 Use sensitivity analysis in budgeting 39 Copyright © 2012 Pearson Education, Inc. Publishing as Prentice Hall.
Using Information Technology for Sensitivity Analysis and Rolling Up Unit Budgets Technology makes it more cost-effective for managers to: Conduct sensitivity analysis on their own unit’s budget Combine individual unit budgets to create the companywide master budget Master budget models the company’s planned activities Must support key strategies 40 Copyright © 2012 Pearson Education, Inc. Publishing as Prentice Hall.
Sensitivity Analysis and Rolling Up Unit Budgets Sensitivity analysis Spreadsheet programs used for budgeting make sensitivity analysis cost-effective 41 Copyright © 2012 Pearson Education, Inc. Publishing as Prentice Hall.
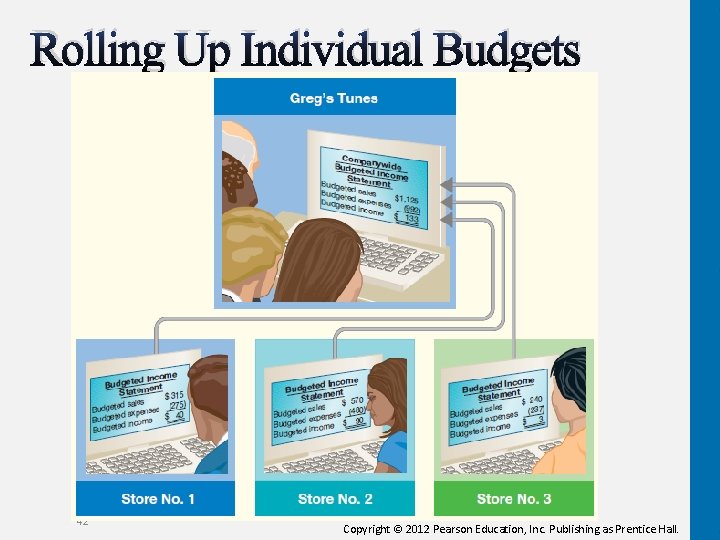
Rolling Up Individual Budgets 42 Copyright © 2012 Pearson Education, Inc. Publishing as Prentice Hall.
Rolling Up Individual Budgets Individual operating units roll up budgets to prepare company-wide budget Budget management software is used Allows management to conduct sensitivity analysis on unit data Managers can spend less time compiling and summarizing data and more time analyzing it 43 Copyright © 2012 Pearson Education, Inc. Publishing as Prentice Hall.
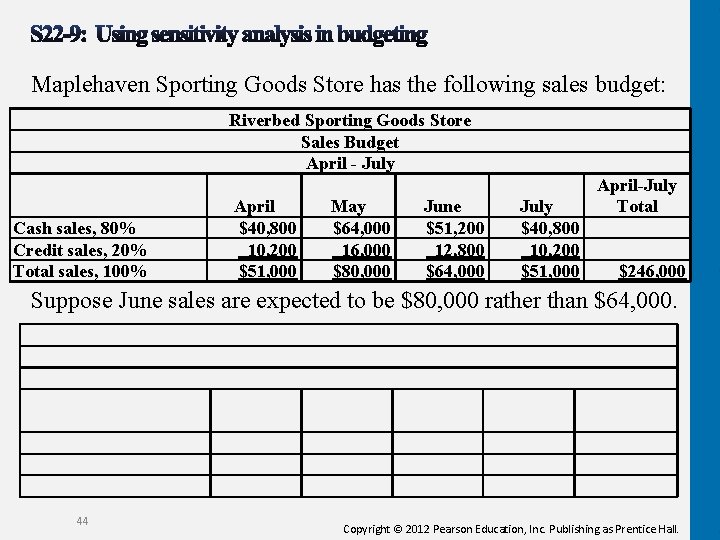
Maplehaven Sporting Goods Store has the following sales budget: Riverbed Sporting Goods Store Sales Budget April - July Cash sales, 80% Credit sales, 20% Total sales, 100% April $40, 800 10, 200 $51, 000 May $64, 000 16, 000 $80, 000 June $51, 200 12, 800 $64, 000 July $40, 800 10, 200 $51, 000 April-July Total $246, 000 Suppose June sales are expected to be $80, 000 rather than $64, 000. 44 Copyright © 2012 Pearson Education, Inc. Publishing as Prentice Hall.
6 Prepare performance reports for responsibility centers and account for traceable and common shared fixed costs 45 Copyright © 2012 Pearson Education, Inc. Publishing as Prentice Hall.
Responsibility Accounting A system for evaluating the performance of each responsibility center and its manager Four types: Cost center Revenue center Profit center Investment center Decentralization highlights the need for reports on individual segments 46 Copyright © 2012 Pearson Education, Inc. Publishing as Prentice Hall.
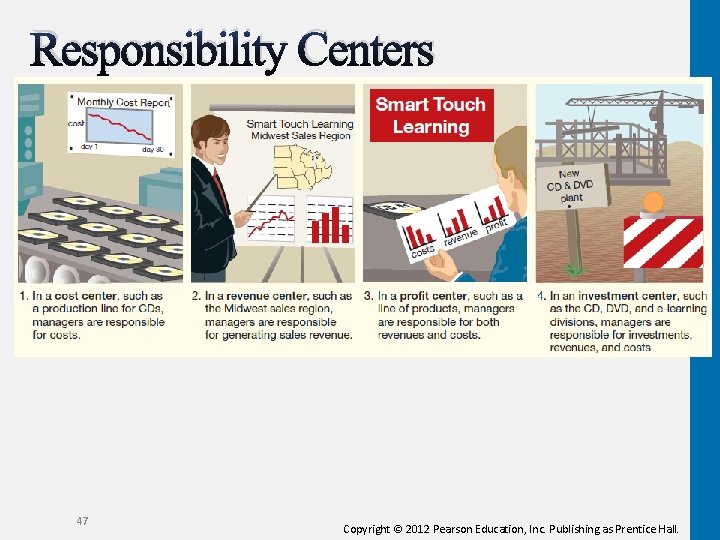
Responsibility Centers 47 Copyright © 2012 Pearson Education, Inc. Publishing as Prentice Hall.
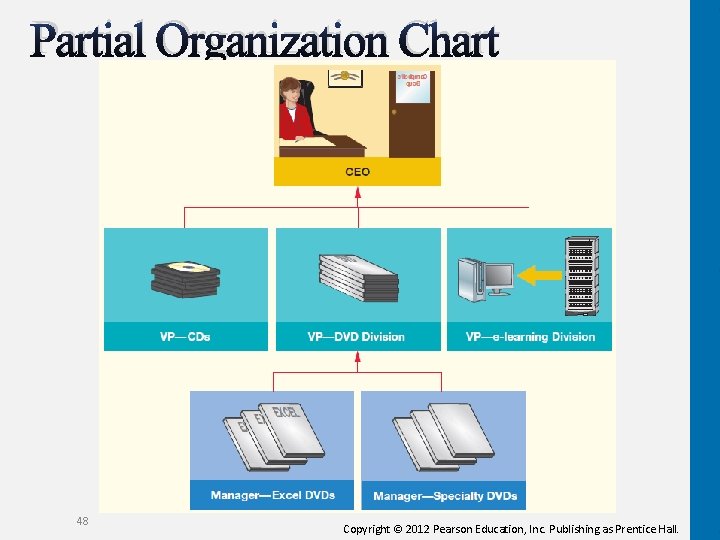
Partial Organization Chart 48 Copyright © 2012 Pearson Education, Inc. Publishing as Prentice Hall.
Responsibility Accounting Performance Reports Performance reports compare budgeted and actual amounts Reporting at all levels Management by exception 49 Copyright © 2012 Pearson Education, Inc. Publishing as Prentice Hall.
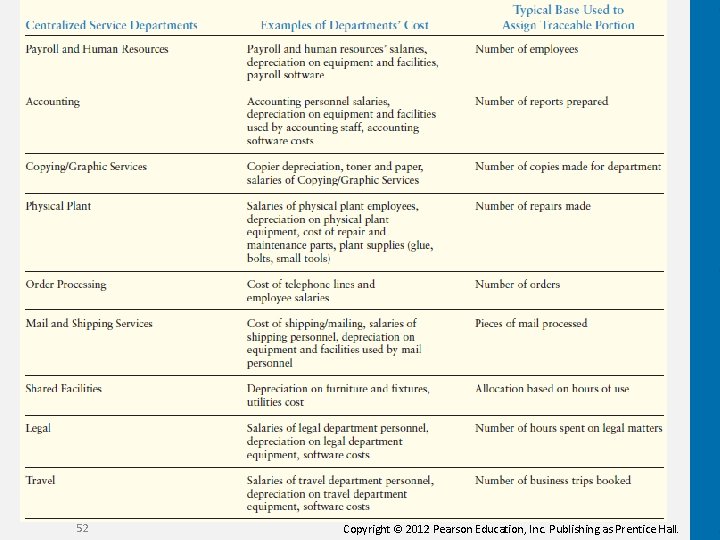
Learn about Service Departments that provide services to multiple departments or divisions for the company Usually do not generate revenues Similar to the shared production overhead Nonproduction related service departments 50 Copyright © 2012 Pearson Education, Inc. Publishing as Prentice Hall.
Traceable Fixed Costs directly associated with an individual product, division, or business segment Would disappear if the company discontinued the product , division or segment Assigning traceable fixed costs 51 Copyright © 2012 Pearson Education, Inc. Publishing as Prentice Hall.
52 Copyright © 2012 Pearson Education, Inc. Publishing as Prentice Hall.
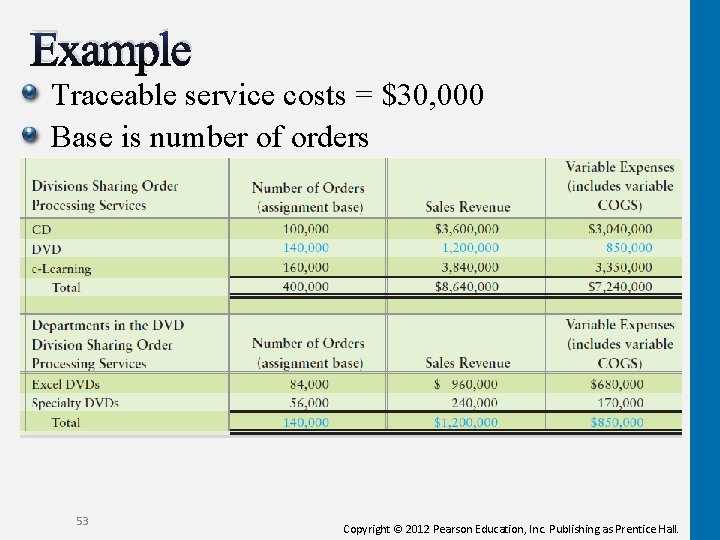
Example Traceable service costs = $30, 000 Base is number of orders 53 Copyright © 2012 Pearson Education, Inc. Publishing as Prentice Hall.
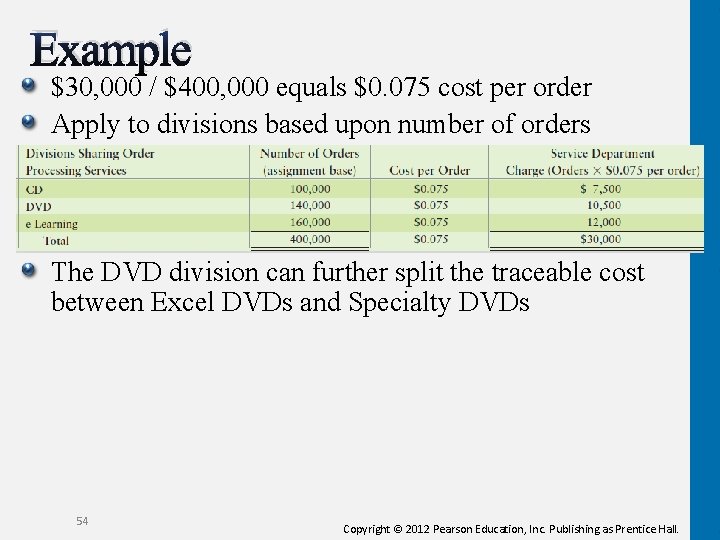
Example $30, 000 / $400, 000 equals $0. 075 cost per order Apply to divisions based upon number of orders The DVD division can further split the traceable cost between Excel DVDs and Specialty DVDs 54 Copyright © 2012 Pearson Education, Inc. Publishing as Prentice Hall.
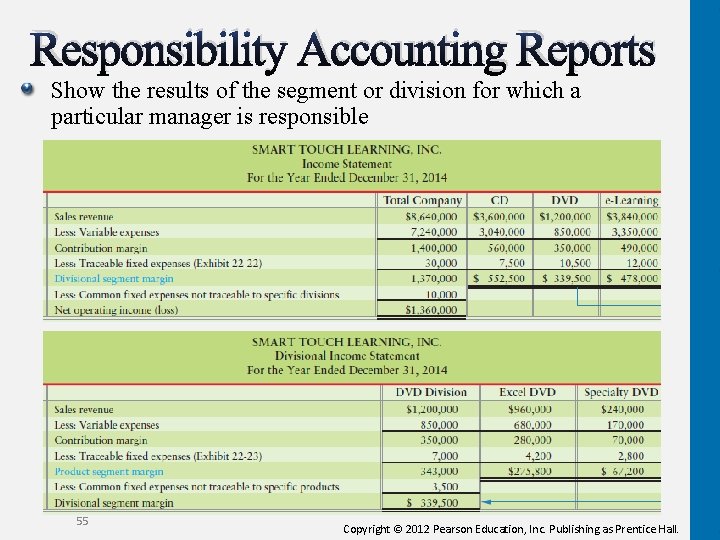
Responsibility Accounting Reports Show the results of the segment or division for which a particular manager is responsible 55 Copyright © 2012 Pearson Education, Inc. Publishing as Prentice Hall.

56 Copyright © 2012 Pearson Education, Inc. Publishing as Prentice Hall.
Copyright All rights reserved. No part of this publication may be reproduced, stored in a retrieval system, or transmitted, in any form or by any means, electronic, mechanical, photocopying, recording, or otherwise, without the prior written permission of the publisher. Printed in the United States of America. 57 Copyright © 2012 Pearson Education, Inc. Publishing as Prentice Hall.
- Slides: 55